| Param | Original file | Final file |
|---|---|---|
| Filename | modeM0/AS1T05_015T01_9000005026_35117cztM0_level2.evt | modeM0/AS1T05_015T01_9000005026_35117cztM0_level2_quad_clean.evt |
| Size (bytes) | 812,926,080 | 55,105,920 |
| Size | 775.3 MB | 52.6 MB |
| Events in quadrant A | 9,217,083 | 266,491 |
| Events in quadrant B | 2,981,497 | 383,758 |
| Events in quadrant C | 4,791,262 | 309,807 |
| Events in quadrant D | 7,283,670 | 346,493 |
| Mode SS | |||
|---|---|---|---|
| Quadrant | BADHDUFLAG | Total packets | Discarded packets |
| A | 0 | 104 | 0 |
| B | 0 | 104 | 0 |
| C | 0 | 104 | 0 |
| D | 0 | 104 | 0 |
| Mode M9 | |||
|---|---|---|---|
| Quadrant | BADHDUFLAG | Total packets | Discarded packets |
| A | 0 | 26 | 0 |
| B | 0 | 26 | 0 |
| C | 0 | 26 | 0 |
| D | 0 | 27 | 0 |
| Mode M0 | |||
|---|---|---|---|
| Quadrant | BADHDUFLAG | Total packets | Discarded packets |
| A | 0 | 31046 | 3 |
| B | 0 | 12018 | 2 |
| C | 0 | 17890 | 2 |
| D | 0 | 25292 | 2 |
| Quadrant | Total seconds | Saturated seconds | Saturation percentage |
|---|---|---|---|
| A | 5153 | 2847 | 55.249369% |
| B | 5153 | 46 | 0.892684% |
| C | 5153 | 729 | 14.147099% |
| D | 5153 | 547 | 10.615176% |
Noise dominated data is calculated using 1-second bins in cleaned event files. If a bin has >2000 counts, and if more than 50% of those come from <1% of pixels, then it is considered to be noise-dominated and hence unusable.
| Quadrant | # 1 sec bins | Bins with >0 counts | Bins with >2000 counts | High rate bins dominated by noise | Noise dominated (total time) | Noise dominated (detector-on time) | Marked lightcurve |
|---|---|---|---|---|---|---|---|
| A | 7246 | 5154 | 2481 | 2481 | 34.24% | 48.14% | 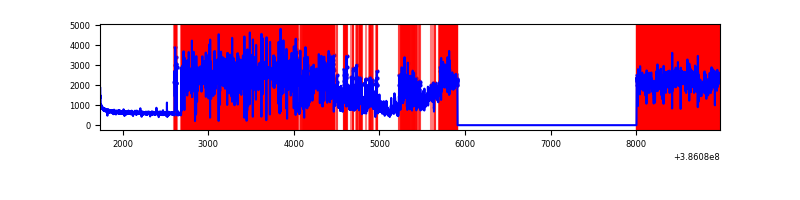 |
| B | 7246 | 5154 | 25 | 25 | 0.35% | 0.49% | 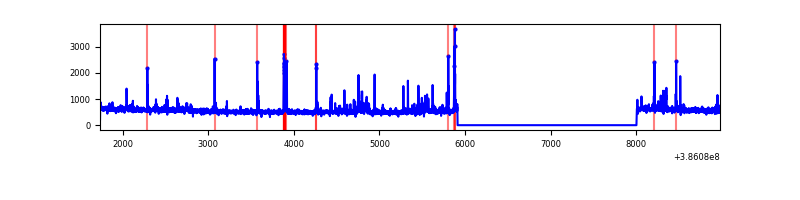 |
| C | 7246 | 5154 | 649 | 649 | 8.96% | 12.59% | 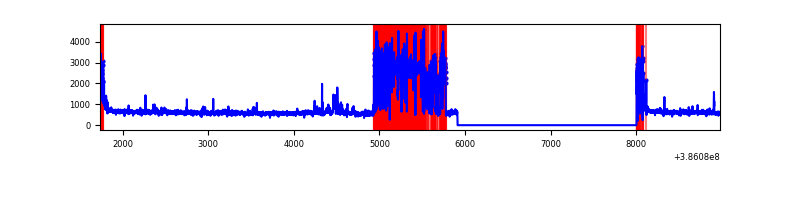 |
| D | 7246 | 5154 | 563 | 563 | 7.77% | 10.92% | 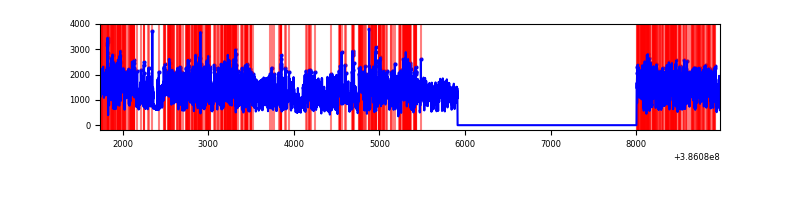 |
Top three noisy pixels from each quadrant. If the there are fewer than three noisy pixels in the level2.evt file, extra rows are filled as -1
| Pixel properties | Quadrant properties | ||||||
|---|---|---|---|---|---|---|---|
| Quadrant | DetID | PixID | Counts | Sigma | Mean | Median | Sigma |
| A | 15 | 169 | 7145332 | 68922.82 | 518 | 508 | 103.7 |
| A | 10 | 83 | 68154 | 652.55 | 518 | 508 | 103.7 |
| A | 13 | 254 | 6246 | 55.35 | 518 | 508 | 103.7 |
| B | 5 | 172 | 150809 | 1174.29 | 693 | 678 | 127.8 |
| B | 0 | 189 | 76053 | 589.56 | 693 | 678 | 127.8 |
| B | 4 | 232 | 19071 | 143.87 | 693 | 678 | 127.8 |
| C | 14 | 128 | 1719646 | 12042.89 | 631 | 638 | 142.7 |
| C | 0 | 10 | 225402 | 1574.63 | 631 | 638 | 142.7 |
| C | 15 | 214 | 200648 | 1401.21 | 631 | 638 | 142.7 |
| D | 8 | 195 | 4358219 | 26872.58 | 671 | 656 | 162.2 |
| D | 13 | 249 | 61461 | 374.98 | 671 | 656 | 162.2 |
| D | 14 | 52 | 55744 | 339.72 | 671 | 656 | 162.2 |
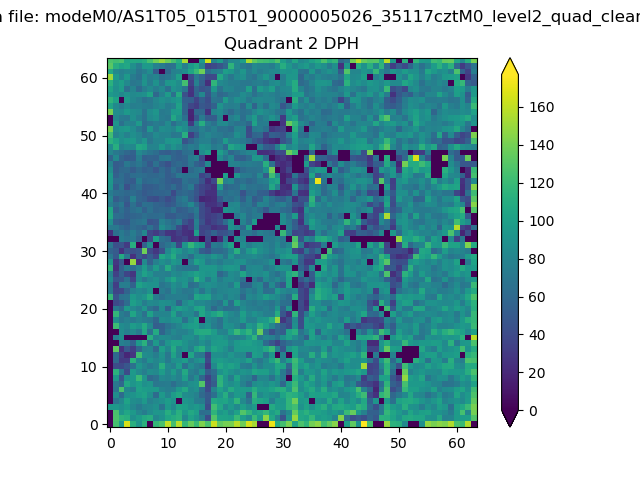
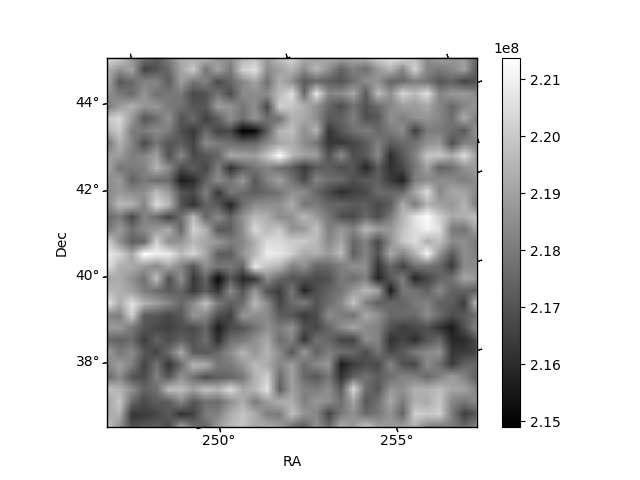
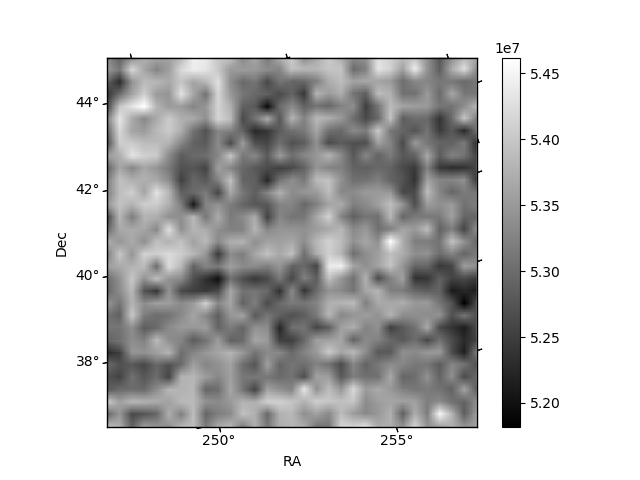
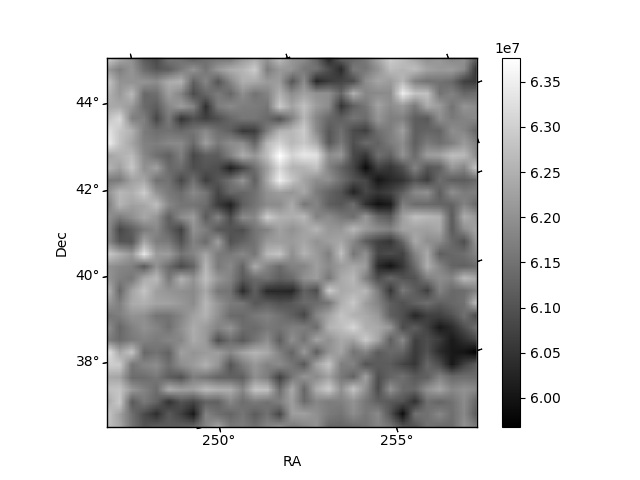
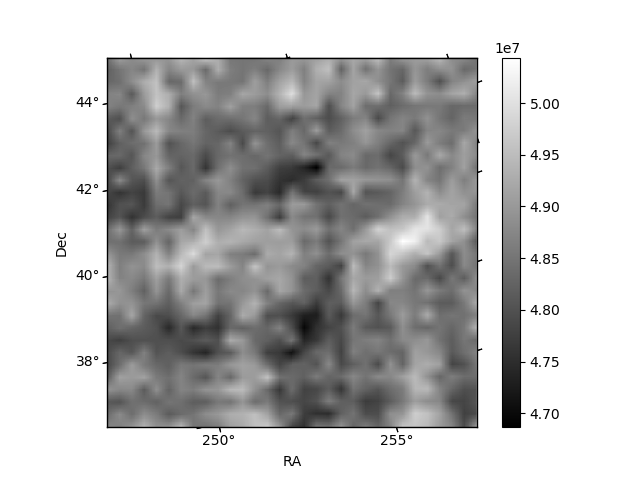
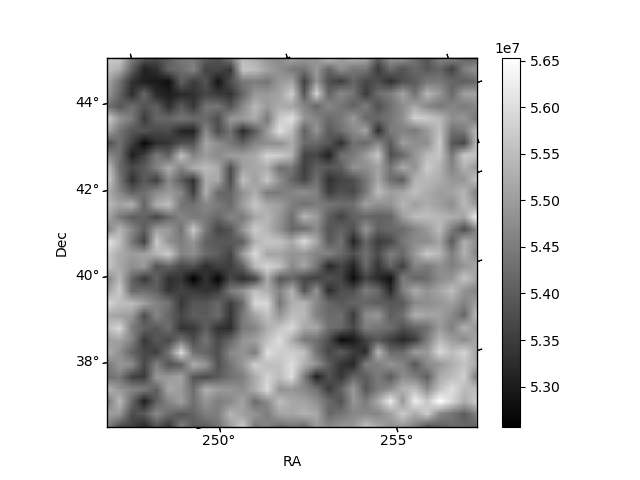
Histogram calculated using DETX and DETY for each event in the final _common_clean file
| Quadrant A | 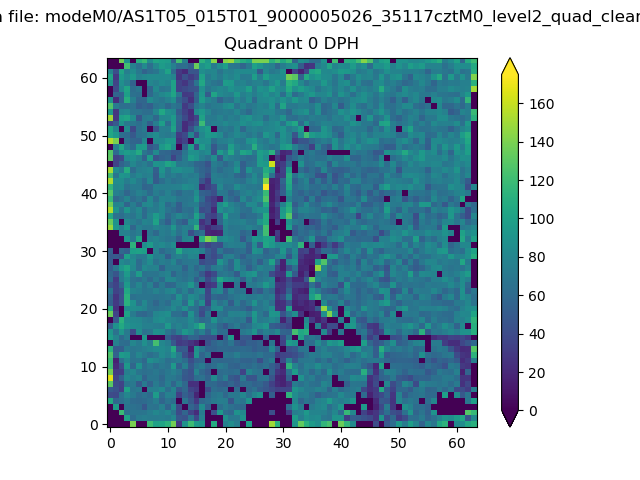 |
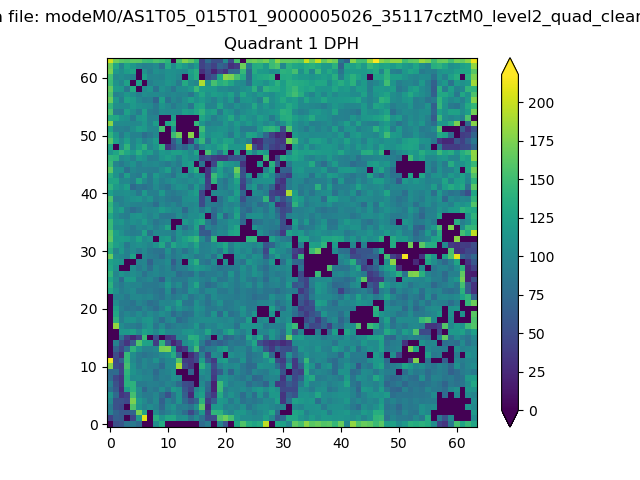 |
Quadrant B |
|---|---|---|---|
| Quadrant D | 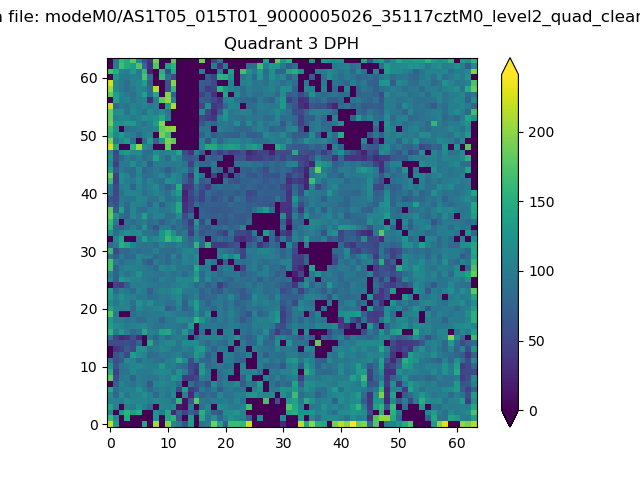 |
 |
Quadrant C |
| Plot type | Count rate plots | Images |
|---|---|---|
| Comparison with Poisson distribution Blue bars denote a histogram of data divided into 1 sec bins. Red curve is a Poisson curve with rate = median count rate of data. |
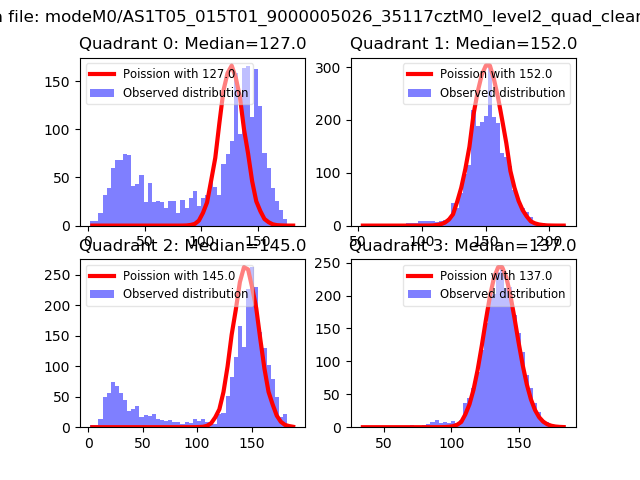 |
 |
| Quadrant-wise count rates Data is divided into 100 sec bins |
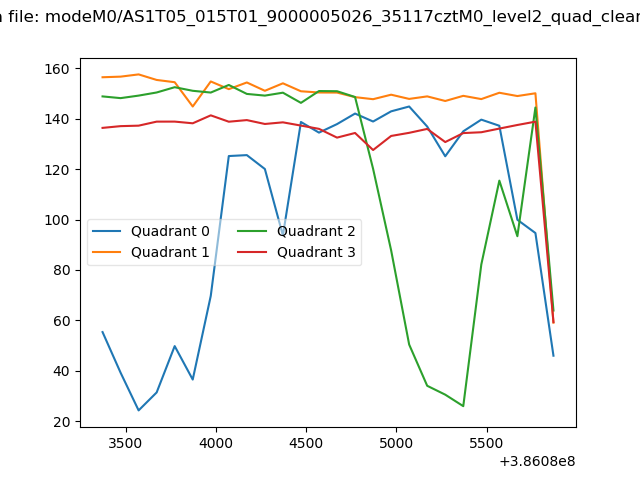 |
|
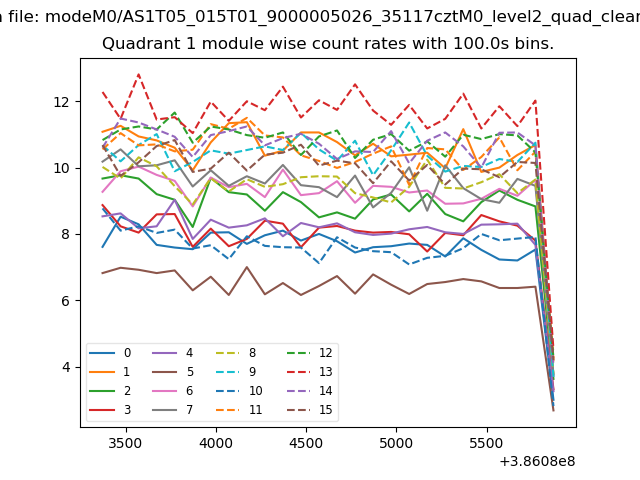
| Module-wise count rates for Quadrant A Data is divided into 100 sec bins |
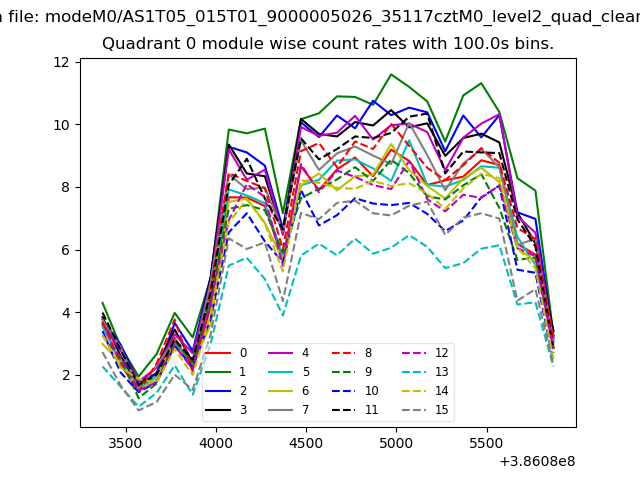 |
 |
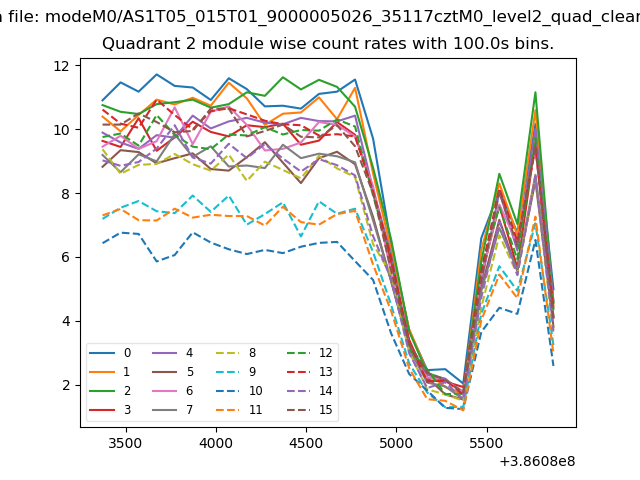
| Module-wise count rates for Quadrant B Data is divided into 100 sec bins |
 |
 |
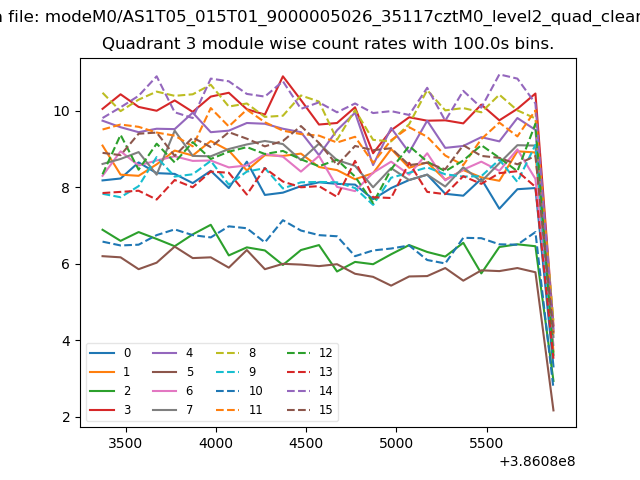
| Module-wise count rates for Quadrant C Data is divided into 100 sec bins |
 |
 |
| Module-wise count rates for Quadrant D Data is divided into 100 sec bins |
 |
 |
| Parameter | Plot |
|---|---|
| CZT HV Monitor | 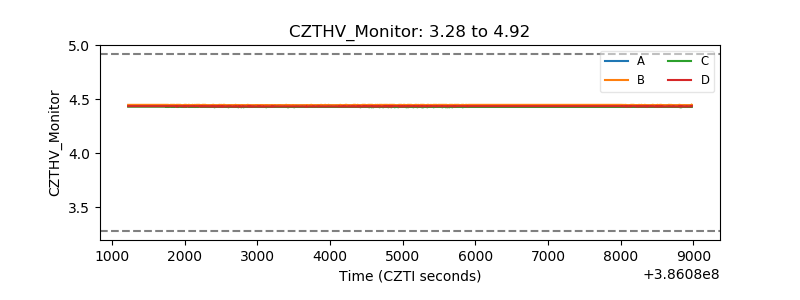 |
| D_VDD | 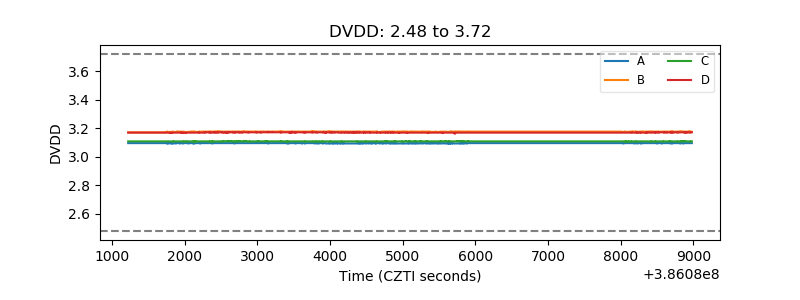 |
| Temperature 1 | 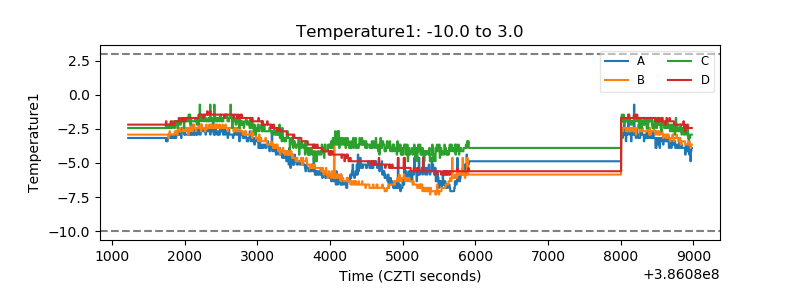 |
| Veto HV Monitor | 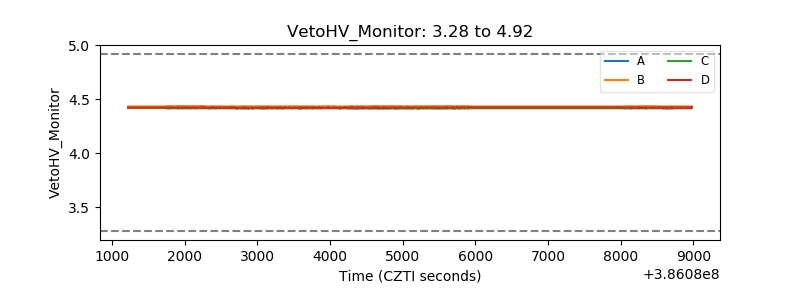 |
| Veto LLD | 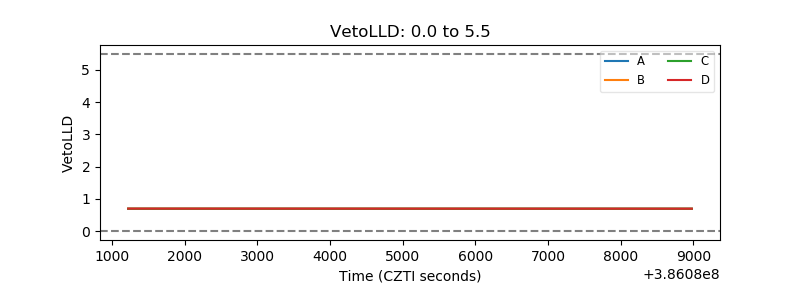 |
| Alpha Counter | 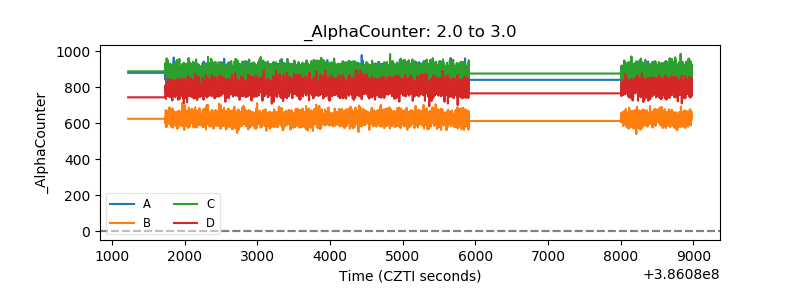 |
| _CPM_Rate | 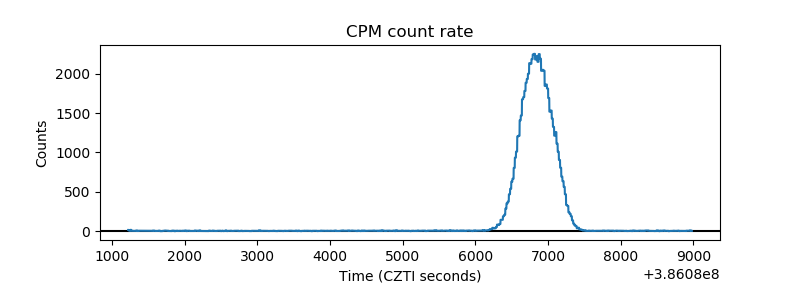 |
| CZT Counter | 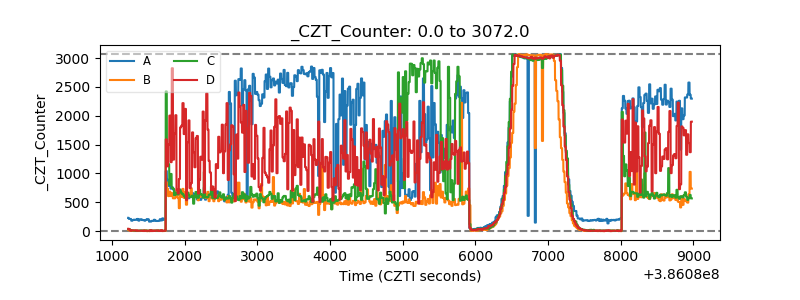 |
| +2.5 Volts monitor | 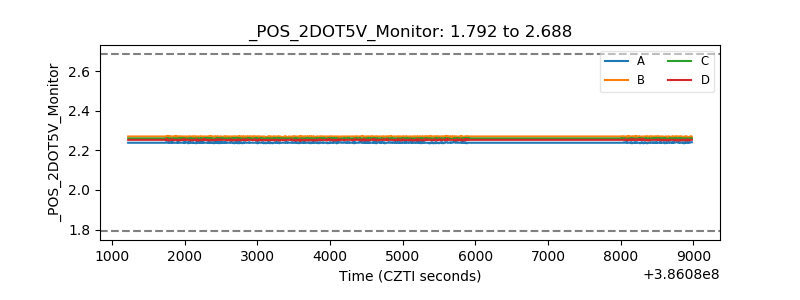 |
| +5 Volts monitor | 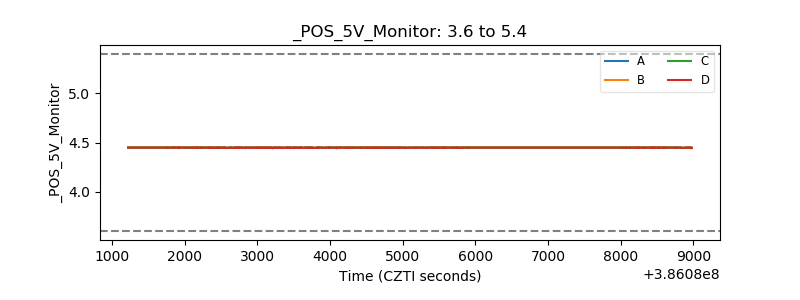 |
| _ROLL_ROT | 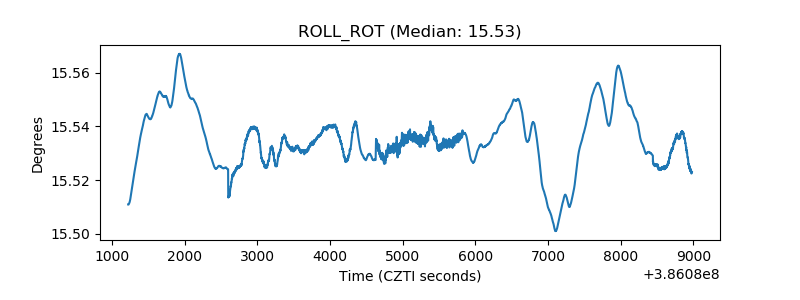 |
| _Roll_DEC | 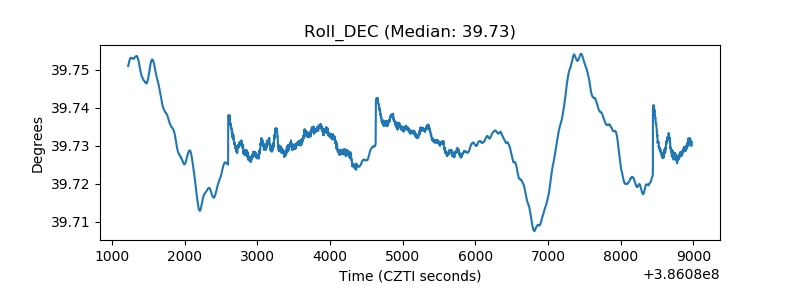 |
| _Roll_RA | 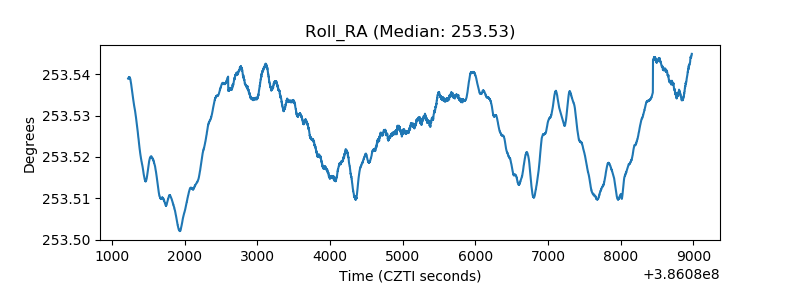 |
| Veto Counter | 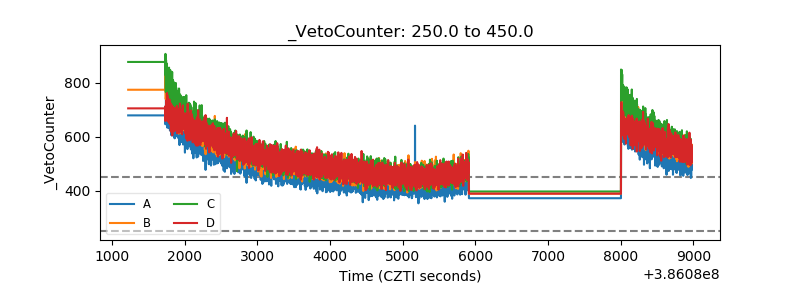 |