| Param | Original file | Final file |
|---|---|---|
| Filename | modeM0/AS1T05_015T01_9000005026_35114cztM0_level2.evt | modeM0/AS1T05_015T01_9000005026_35114cztM0_level2_quad_clean.evt |
| Size (bytes) | 558,650,880 | 63,342,720 |
| Size | 532.8 MB | 60.4 MB |
| Events in quadrant A | 2,595,330 | 396,913 |
| Events in quadrant B | 3,316,424 | 403,607 |
| Events in quadrant C | 3,023,248 | 390,235 |
| Events in quadrant D | 7,628,540 | 358,819 |
| Mode SS | |||
|---|---|---|---|
| Quadrant | BADHDUFLAG | Total packets | Discarded packets |
| A | 0 | 108 | 0 |
| B | 0 | 108 | 0 |
| C | 0 | 108 | 0 |
| D | 0 | 108 | 0 |
| Mode M9 | |||
|---|---|---|---|
| Quadrant | BADHDUFLAG | Total packets | Discarded packets |
| A | 0 | 18 | 0 |
| B | 0 | 18 | 0 |
| C | 0 | 18 | 0 |
| D | 0 | 19 | 0 |
| Mode M0 | |||
|---|---|---|---|
| Quadrant | BADHDUFLAG | Total packets | Discarded packets |
| A | 0 | 10916 | 3 |
| B | 0 | 13031 | 2 |
| C | 0 | 11956 | 2 |
| D | 0 | 26322 | 2 |
| Quadrant | Total seconds | Saturated seconds | Saturation percentage |
|---|---|---|---|
| A | 5254 | 10 | 0.190331% |
| B | 5254 | 193 | 3.673392% |
| C | 5254 | 115 | 2.188809% |
| D | 5254 | 654 | 12.447659% |
Noise dominated data is calculated using 1-second bins in cleaned event files. If a bin has >2000 counts, and if more than 50% of those come from <1% of pixels, then it is considered to be noise-dominated and hence unusable.
| Quadrant | # 1 sec bins | Bins with >0 counts | Bins with >2000 counts | High rate bins dominated by noise | Noise dominated (total time) | Noise dominated (detector-on time) | Marked lightcurve |
|---|---|---|---|---|---|---|---|
| A | 7017 | 5255 | 1 | 1 | 0.01% | 0.02% | 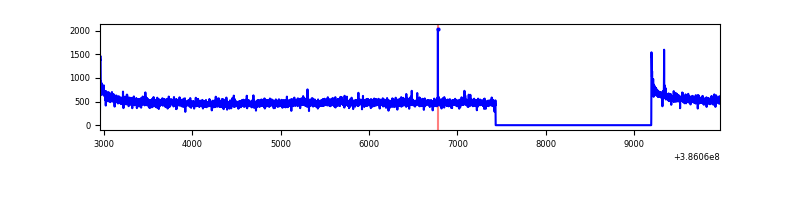 |
| B | 7017 | 5255 | 108 | 108 | 1.54% | 2.06% | 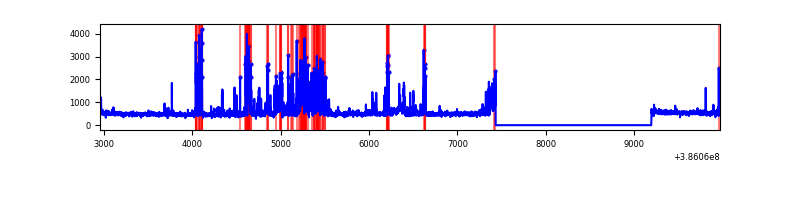 |
| C | 7017 | 5255 | 79 | 79 | 1.13% | 1.50% | 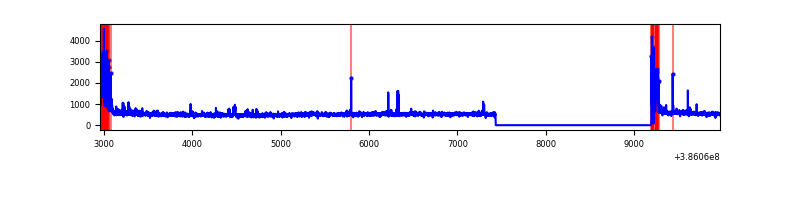 |
| D | 7017 | 5255 | 625 | 625 | 8.91% | 11.89% | 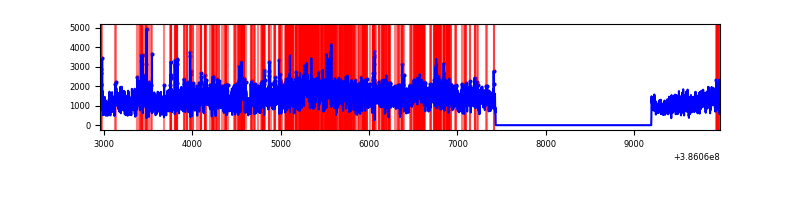 |
Top three noisy pixels from each quadrant. If the there are fewer than three noisy pixels in the level2.evt file, extra rows are filled as -1
| Pixel properties | Quadrant properties | ||||||
|---|---|---|---|---|---|---|---|
| Quadrant | DetID | PixID | Counts | Sigma | Mean | Median | Sigma |
| A | 10 | 83 | 84385 | 647.13 | 643 | 631 | 129.4 |
| A | 13 | 6 | 10978 | 79.95 | 643 | 631 | 129.4 |
| A | 13 | 254 | 8615 | 61.69 | 643 | 631 | 129.4 |
| B | 0 | 190 | 322425 | 2658.93 | 628 | 613 | 121.0 |
| B | 4 | 232 | 218689 | 1801.83 | 628 | 613 | 121.0 |
| B | 5 | 255 | 165596 | 1363.15 | 628 | 613 | 121.0 |
| C | 0 | 10 | 318139 | 2219.43 | 615 | 621 | 143.1 |
| C | 15 | 214 | 221770 | 1545.82 | 615 | 621 | 143.1 |
| C | 0 | 207 | 63293 | 438.07 | 615 | 621 | 143.1 |
| D | 8 | 195 | 4558572 | 30438.43 | 608 | 590 | 149.7 |
| D | 5 | 223 | 209613 | 1395.87 | 608 | 590 | 149.7 |
| D | 13 | 249 | 182403 | 1214.16 | 608 | 590 | 149.7 |
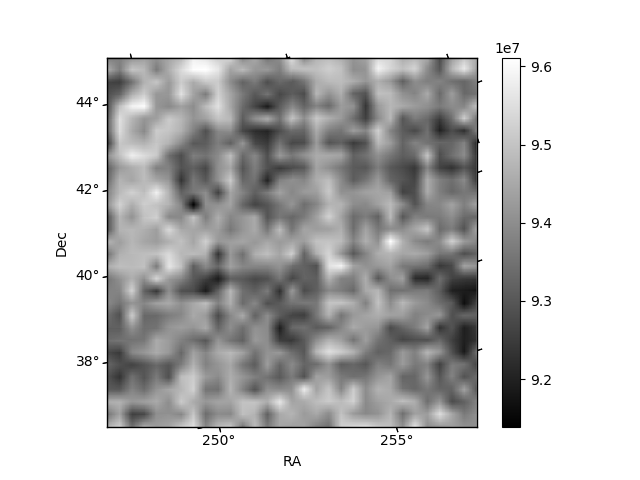
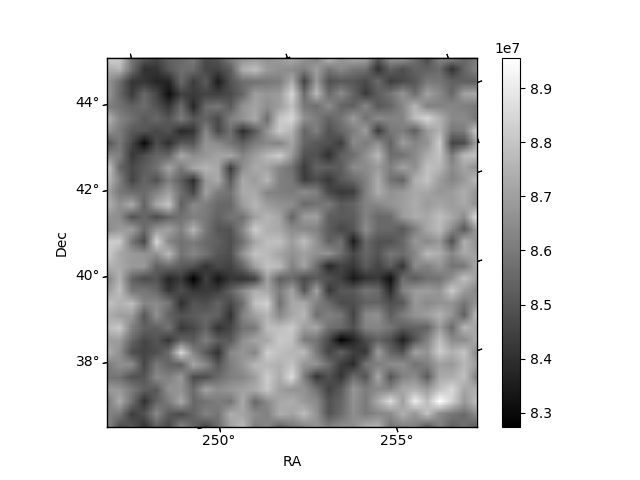
Histogram calculated using DETX and DETY for each event in the final _common_clean file
| Quadrant A | 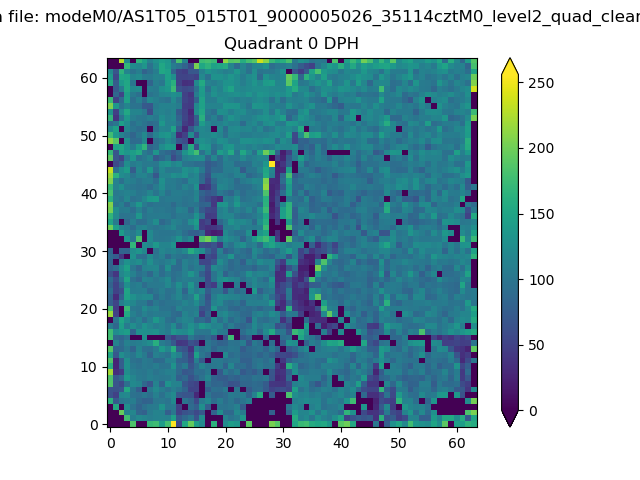 |
 |
Quadrant B |
|---|---|---|---|
| Quadrant D | 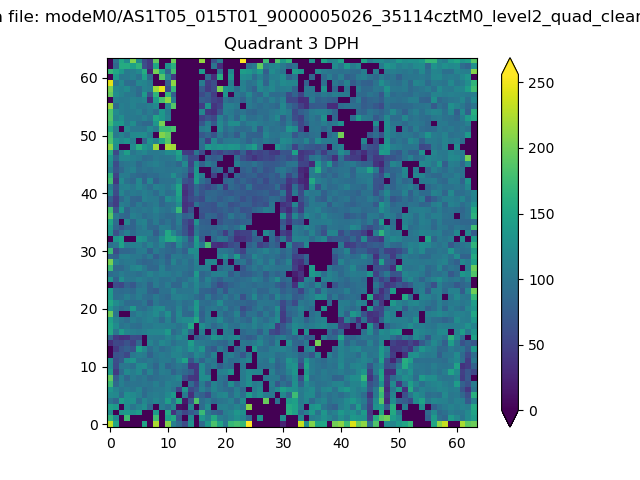 |
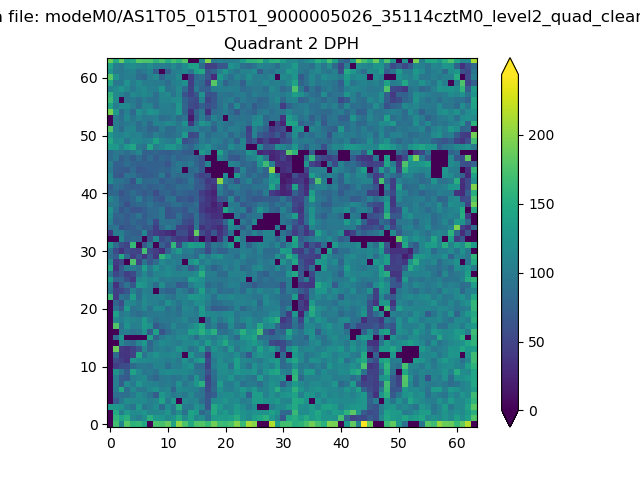 |
Quadrant C |
| Plot type | Count rate plots | Images |
|---|---|---|
| Comparison with Poisson distribution Blue bars denote a histogram of data divided into 1 sec bins. Red curve is a Poisson curve with rate = median count rate of data. |
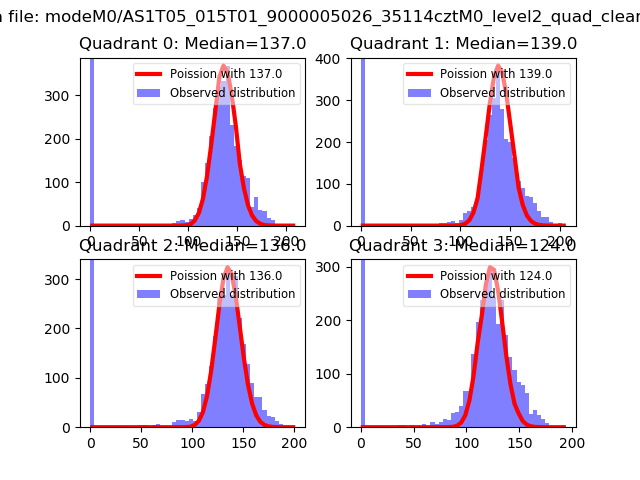 |
 |
| Quadrant-wise count rates Data is divided into 100 sec bins |
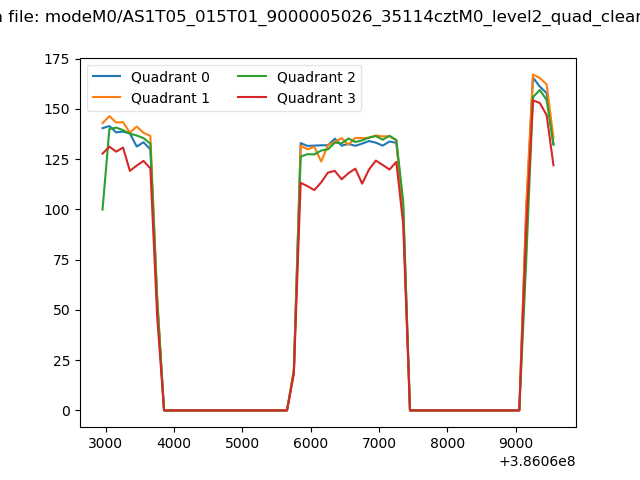 |
|
| Module-wise count rates for Quadrant A Data is divided into 100 sec bins |
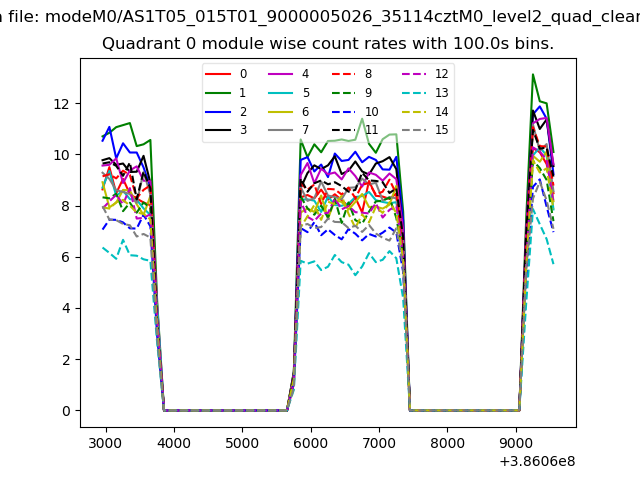 |
 |
| Module-wise count rates for Quadrant B Data is divided into 100 sec bins |
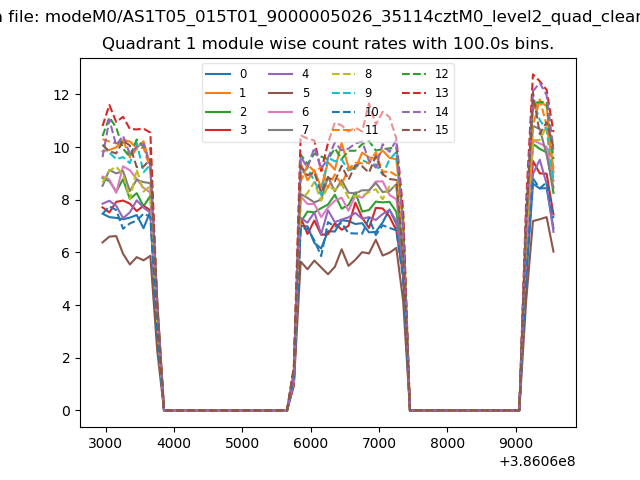 |
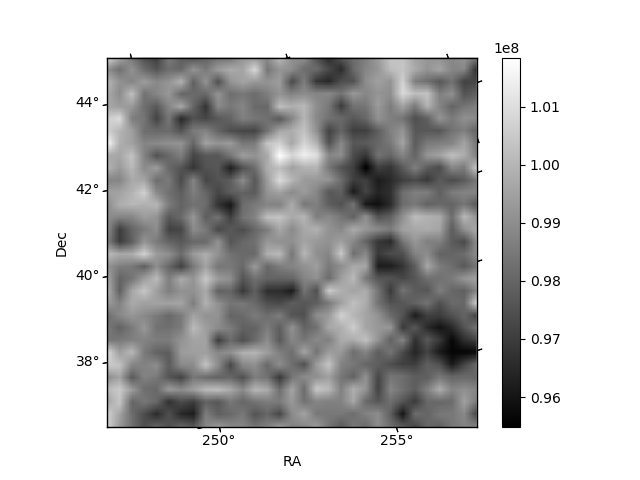 |
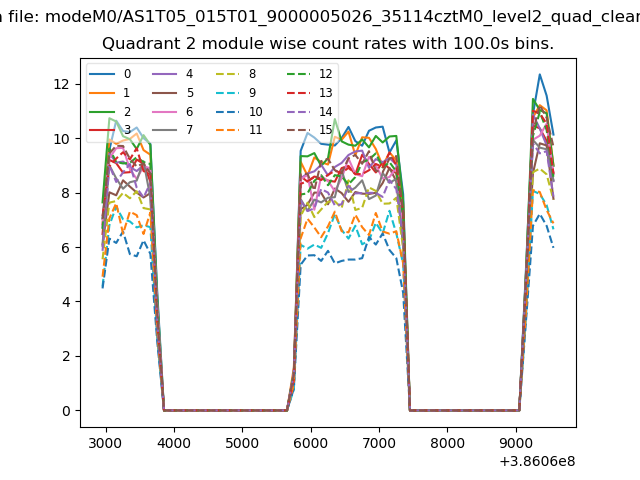
| Module-wise count rates for Quadrant C Data is divided into 100 sec bins |
 |
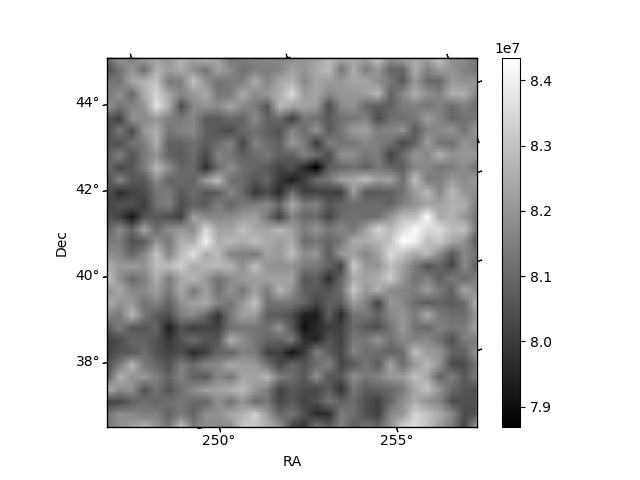 |
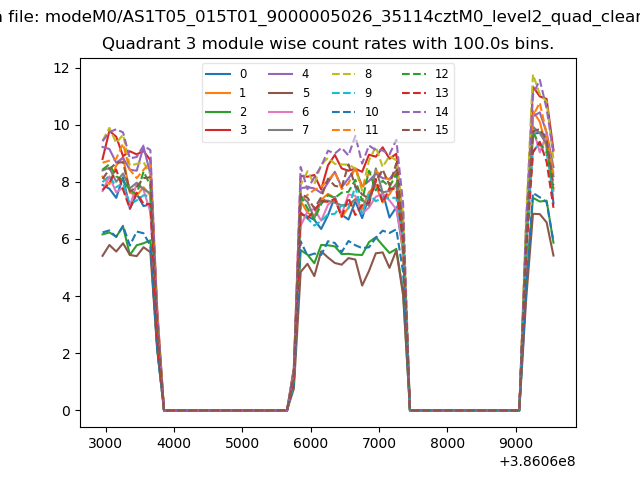
| Module-wise count rates for Quadrant D Data is divided into 100 sec bins |
 |
 |
| Parameter | Plot |
|---|---|
| CZT HV Monitor | 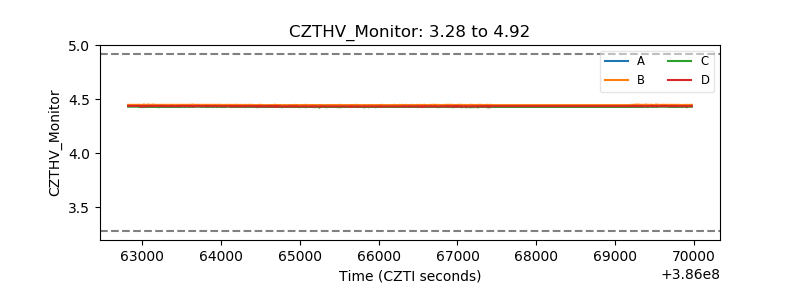 |
| D_VDD | 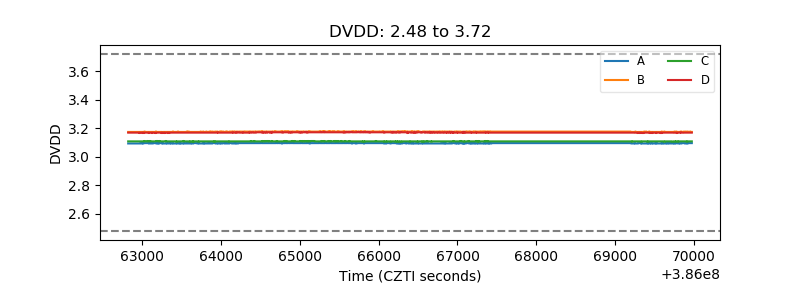 |
| Temperature 1 | 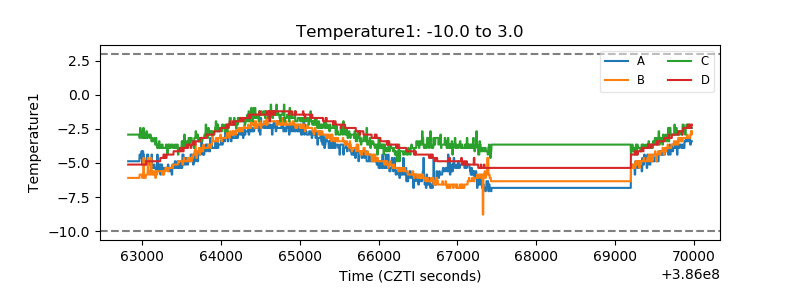 |
| Veto HV Monitor | 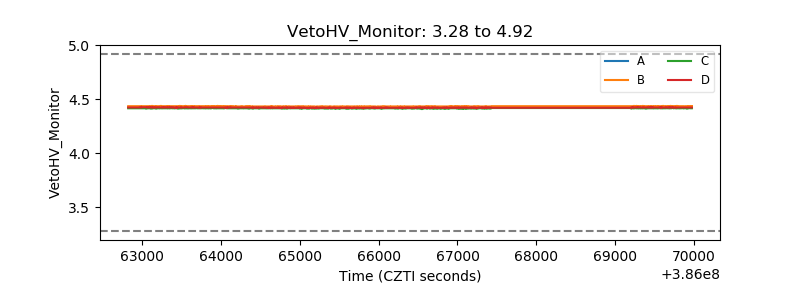 |
| Veto LLD | 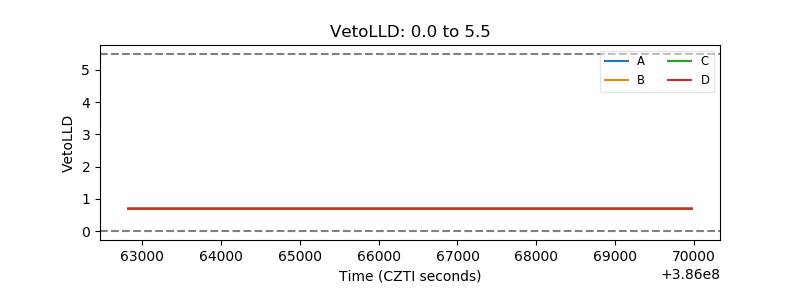 |
| Alpha Counter | 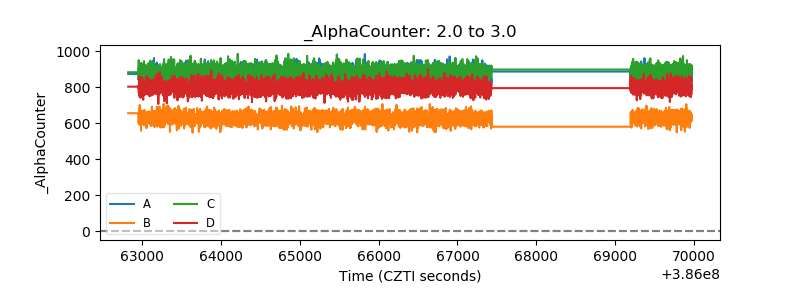 |
| _CPM_Rate | 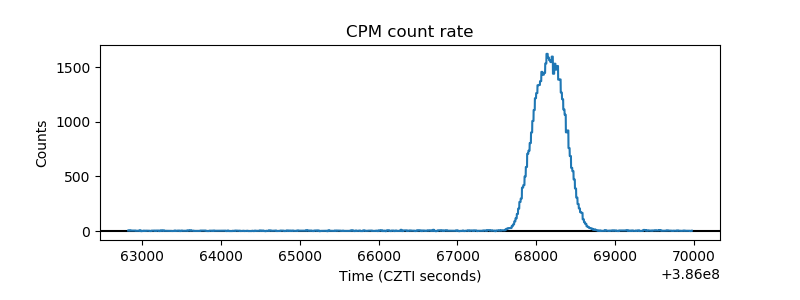 |
| CZT Counter | 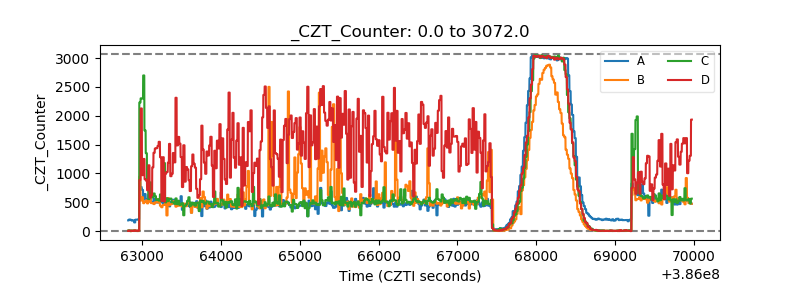 |
| +2.5 Volts monitor | 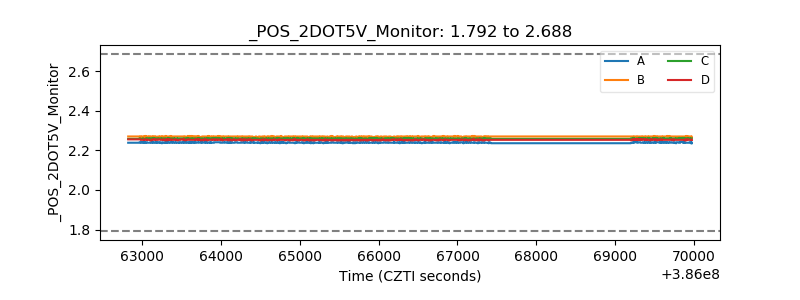 |
| +5 Volts monitor | 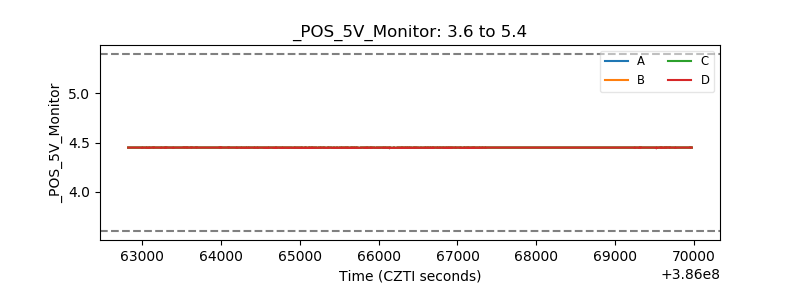 |
| _ROLL_ROT | 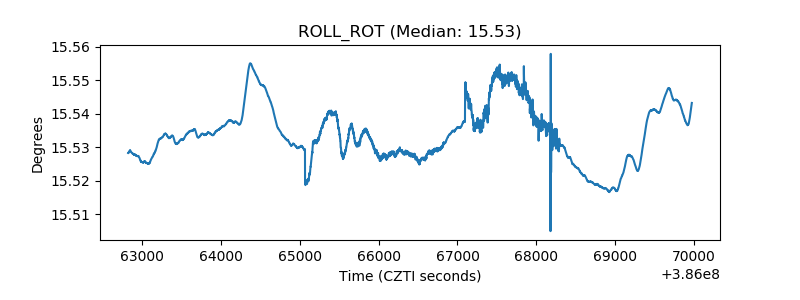 |
| _Roll_DEC | 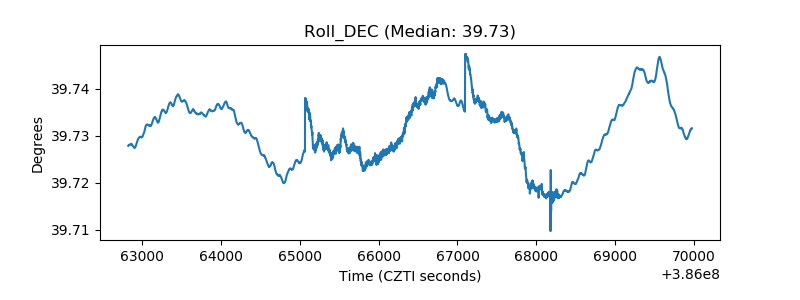 |
| _Roll_RA | 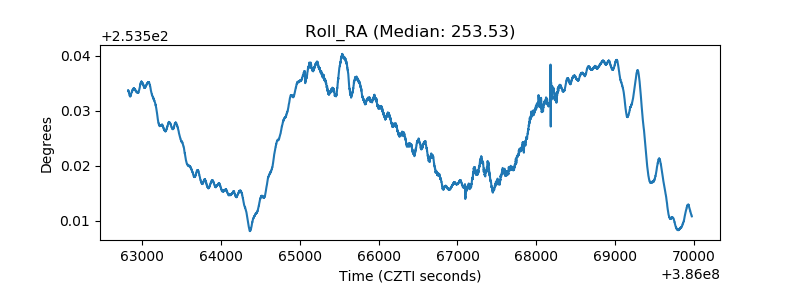 |
| Veto Counter | 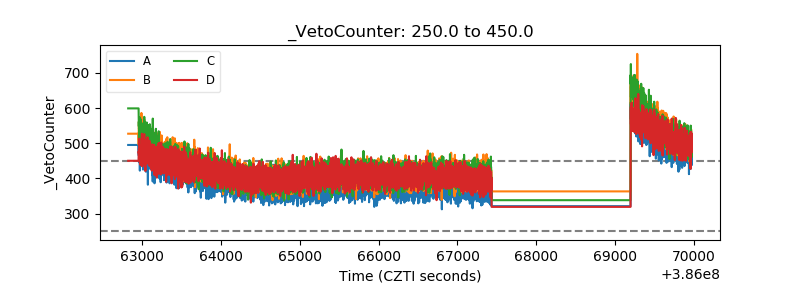 |