| Param | Original file | Final file |
|---|---|---|
| Filename | modeM0/AS1T05_015T01_9000005026_35108cztM0_level2.evt | modeM0/AS1T05_015T01_9000005026_35108cztM0_level2_quad_clean.evt |
| Size (bytes) | 668,160,000 | 75,568,320 |
| Size | 637.2 MB | 72.1 MB |
| Events in quadrant A | 5,060,136 | 467,976 |
| Events in quadrant B | 4,009,626 | 480,343 |
| Events in quadrant C | 3,303,464 | 481,264 |
| Events in quadrant D | 7,459,296 | 441,413 |
| Mode SS | |||
|---|---|---|---|
| Quadrant | BADHDUFLAG | Total packets | Discarded packets |
| A | 0 | 124 | 0 |
| B | 0 | 124 | 0 |
| C | 0 | 124 | 0 |
| D | 0 | 124 | 0 |
| Mode M9 | |||
|---|---|---|---|
| Quadrant | BADHDUFLAG | Total packets | Discarded packets |
| A | 0 | 27 | 0 |
| B | 0 | 27 | 0 |
| C | 0 | 27 | 0 |
| D | 0 | 27 | 0 |
| Mode M0 | |||
|---|---|---|---|
| Quadrant | BADHDUFLAG | Total packets | Discarded packets |
| A | 0 | 19170 | 3 |
| B | 0 | 15897 | 2 |
| C | 0 | 13542 | 2 |
| D | 0 | 26375 | 2 |
| Quadrant | Total seconds | Saturated seconds | Saturation percentage |
|---|---|---|---|
| A | 5970 | 421 | 7.051926% |
| B | 5970 | 364 | 6.097152% |
| C | 5970 | 110 | 1.842546% |
| D | 5970 | 665 | 11.139028% |
Noise dominated data is calculated using 1-second bins in cleaned event files. If a bin has >2000 counts, and if more than 50% of those come from <1% of pixels, then it is considered to be noise-dominated and hence unusable.
| Quadrant | # 1 sec bins | Bins with >0 counts | Bins with >2000 counts | High rate bins dominated by noise | Noise dominated (total time) | Noise dominated (detector-on time) | Marked lightcurve |
|---|---|---|---|---|---|---|---|
| A | 8656 | 5972 | 232 | 232 | 2.68% | 3.88% | 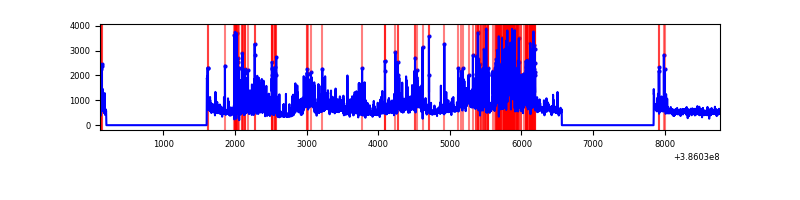 |
| B | 8656 | 5972 | 194 | 194 | 2.24% | 3.25% | 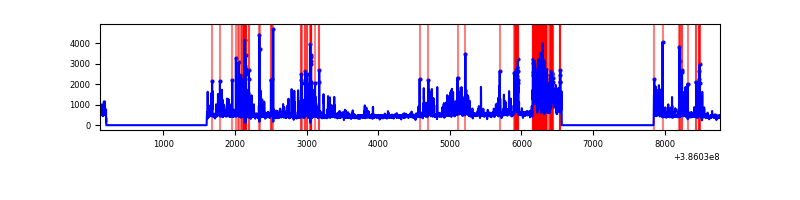 |
| C | 8656 | 5971 | 77 | 77 | 0.89% | 1.29% | 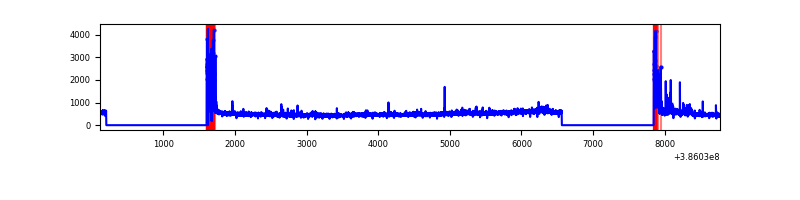 |
| D | 8656 | 5972 | 450 | 450 | 5.20% | 7.54% | 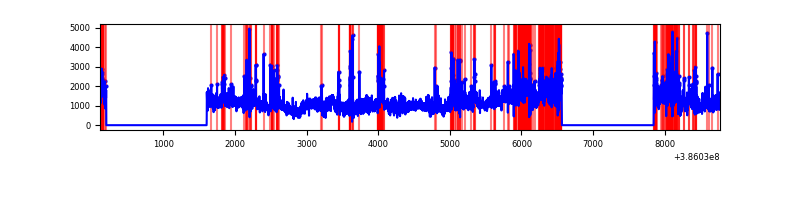 |
Top three noisy pixels from each quadrant. If the there are fewer than three noisy pixels in the level2.evt file, extra rows are filled as -1
| Pixel properties | Quadrant properties | ||||||
|---|---|---|---|---|---|---|---|
| Quadrant | DetID | PixID | Counts | Sigma | Mean | Median | Sigma |
| A | 15 | 169 | 2370872 | 17650.65 | 668 | 657 | 134.3 |
| A | 10 | 83 | 83180 | 614.54 | 668 | 657 | 134.3 |
| A | 13 | 6 | 15313 | 109.14 | 668 | 657 | 134.3 |
| B | 5 | 172 | 1175340 | 9209.91 | 668 | 651 | 127.5 |
| B | 0 | 189 | 52834 | 409.13 | 668 | 651 | 127.5 |
| B | 5 | 255 | 43881 | 338.94 | 668 | 651 | 127.5 |
| C | 0 | 10 | 324592 | 2099.53 | 668 | 673 | 154.3 |
| C | 15 | 214 | 248748 | 1607.94 | 668 | 673 | 154.3 |
| C | 5 | 4 | 63115 | 404.73 | 668 | 673 | 154.3 |
| D | 8 | 195 | 3846748 | 24408.08 | 642 | 624 | 157.6 |
| D | 7 | 80 | 250714 | 1587.11 | 642 | 624 | 157.6 |
| D | 13 | 249 | 222663 | 1409.09 | 642 | 624 | 157.6 |
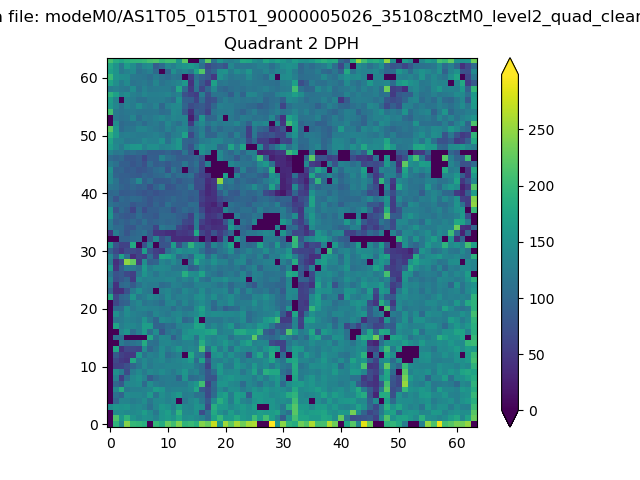
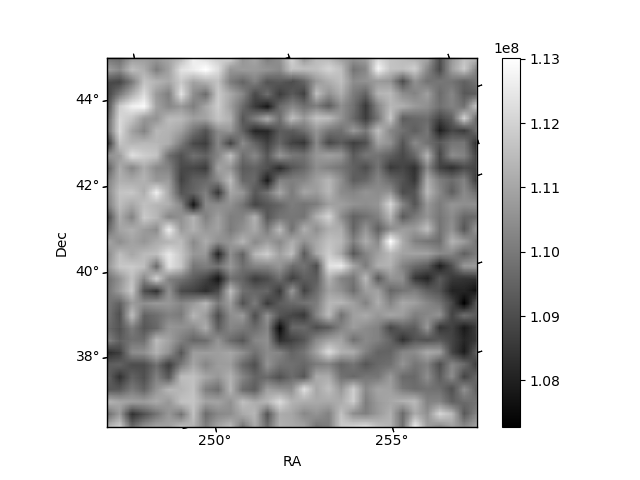
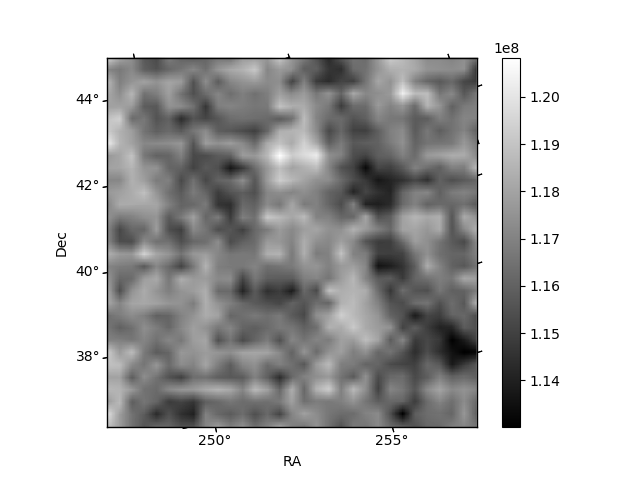
Histogram calculated using DETX and DETY for each event in the final _common_clean file
| Quadrant A | 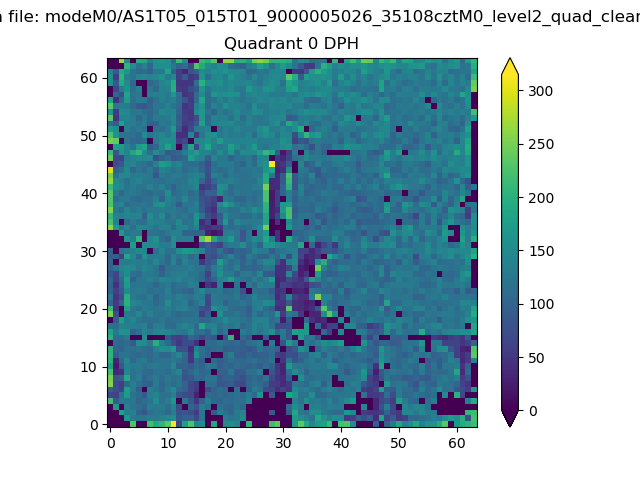 |
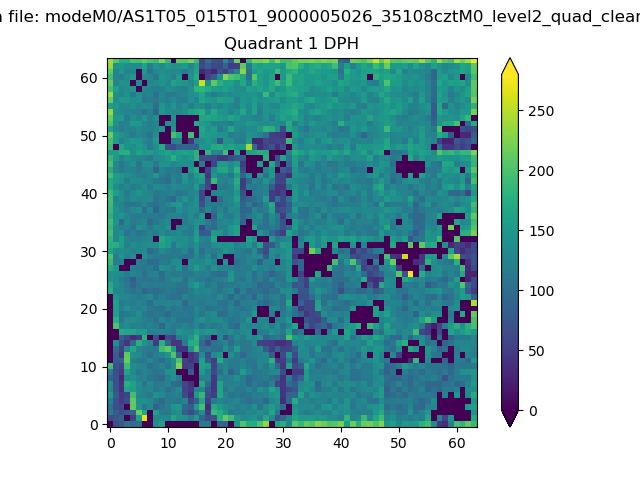 |
Quadrant B |
|---|---|---|---|
| Quadrant D | 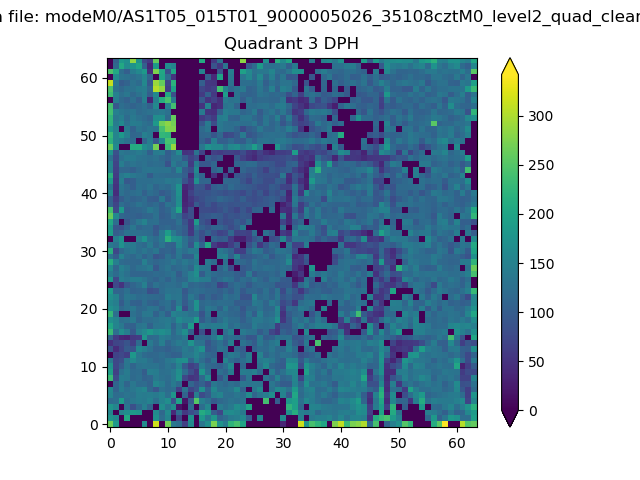 |
 |
Quadrant C |
| Plot type | Count rate plots | Images |
|---|---|---|
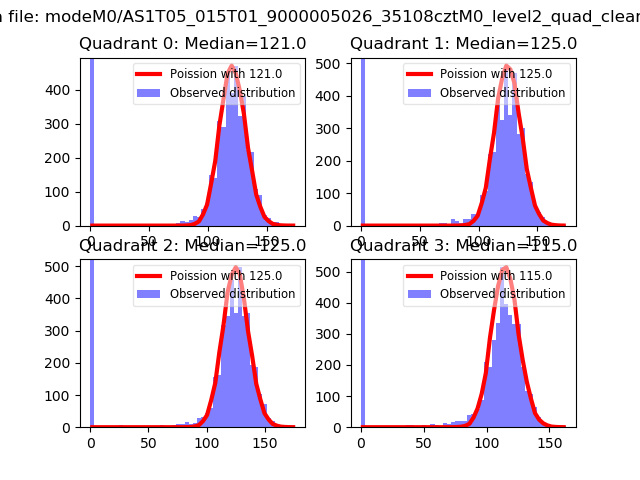
| Comparison with Poisson distribution Blue bars denote a histogram of data divided into 1 sec bins. Red curve is a Poisson curve with rate = median count rate of data. |
 |
 |
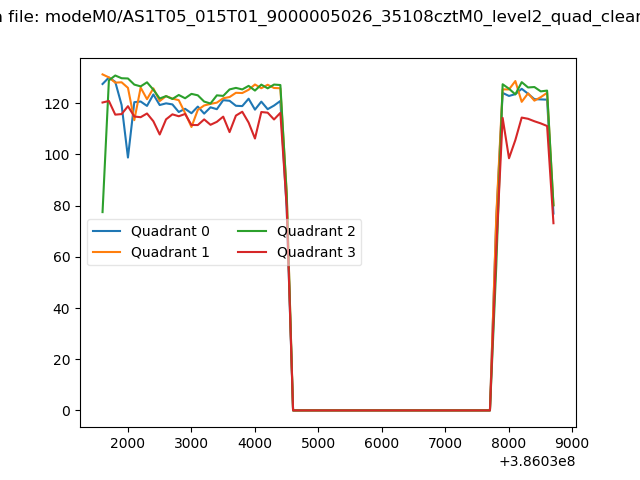
| Quadrant-wise count rates Data is divided into 100 sec bins |
 |
|
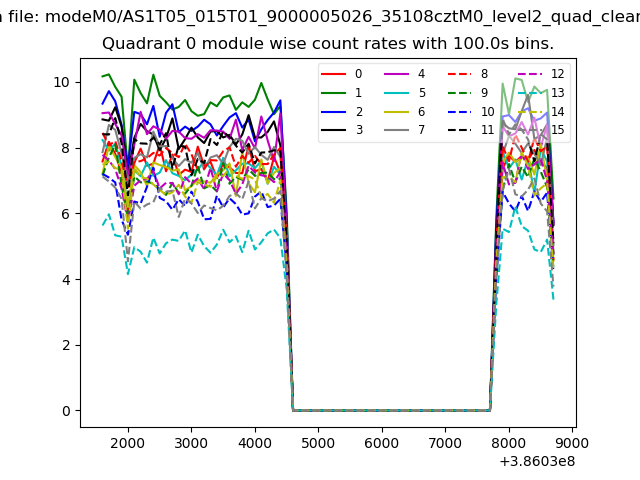
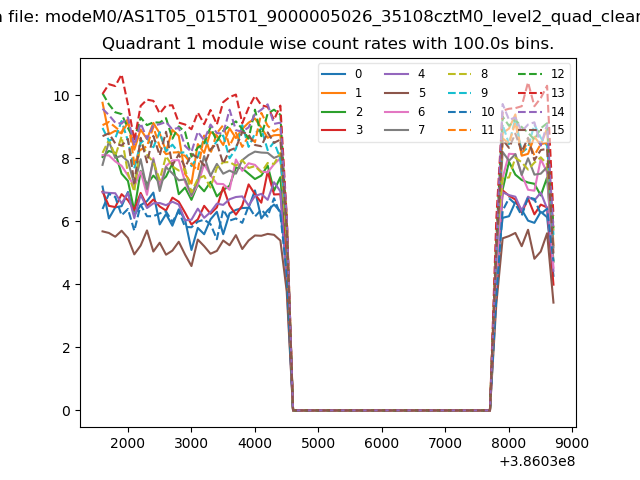
| Module-wise count rates for Quadrant A Data is divided into 100 sec bins |
 |
 |
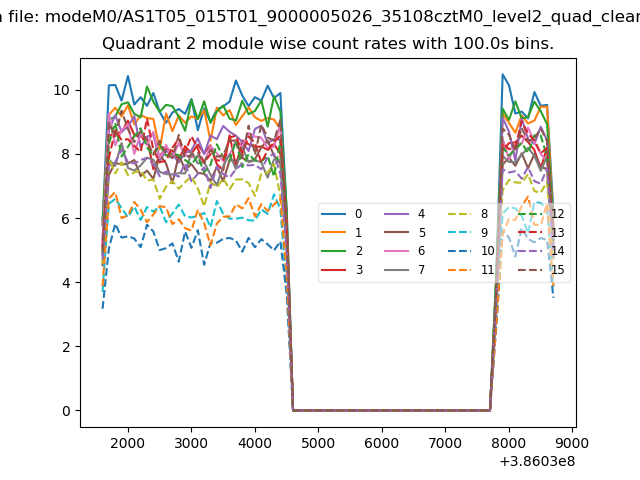
| Module-wise count rates for Quadrant B Data is divided into 100 sec bins |
 |
 |
| Module-wise count rates for Quadrant C Data is divided into 100 sec bins |
 |
 |
| Module-wise count rates for Quadrant D Data is divided into 100 sec bins |
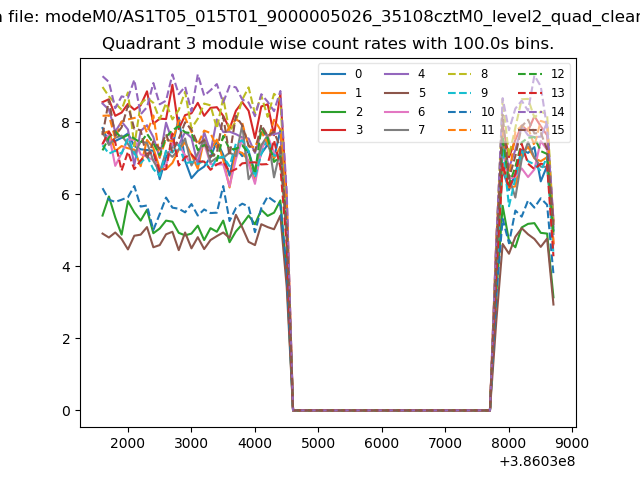 |
 |
| Parameter | Plot |
|---|---|
| CZT HV Monitor | 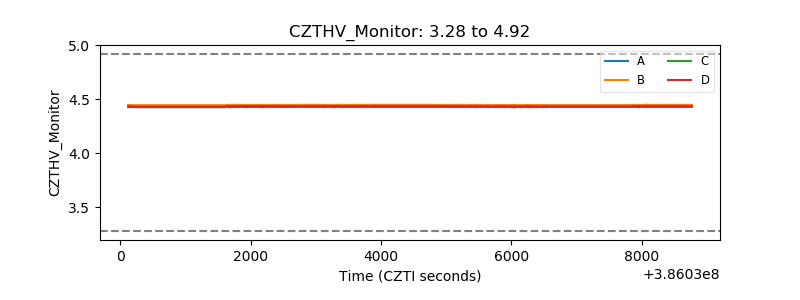 |
| D_VDD | 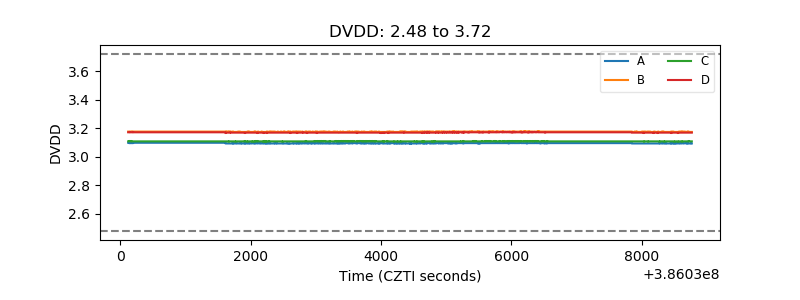 |
| Temperature 1 | 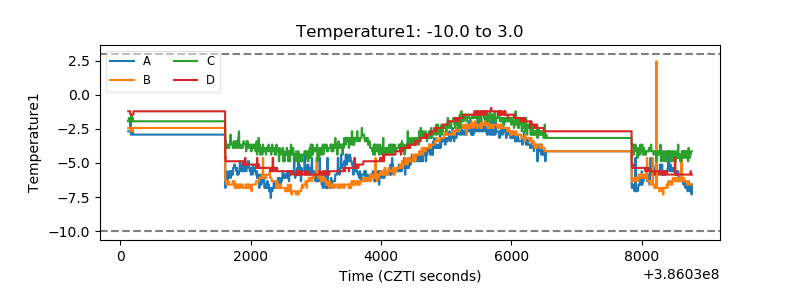 |
| Veto HV Monitor | 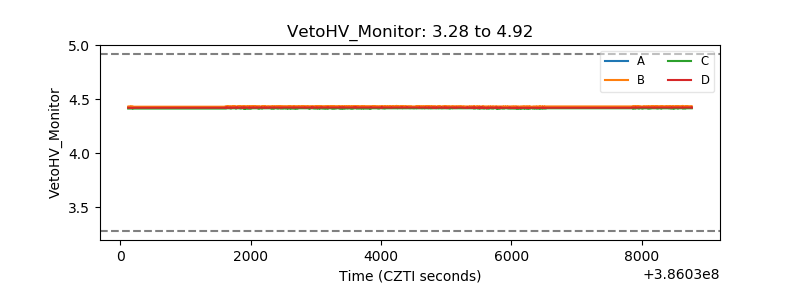 |
| Veto LLD | 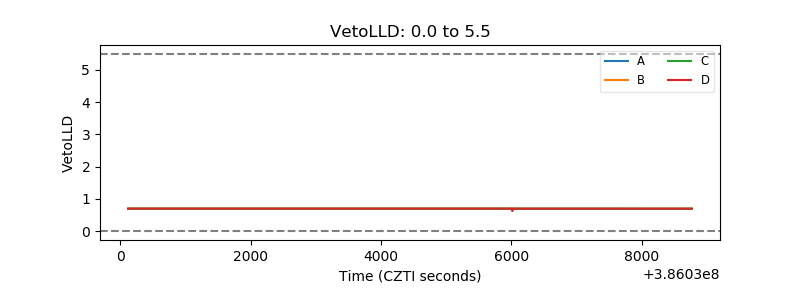 |
| Alpha Counter |  |
| _CPM_Rate | 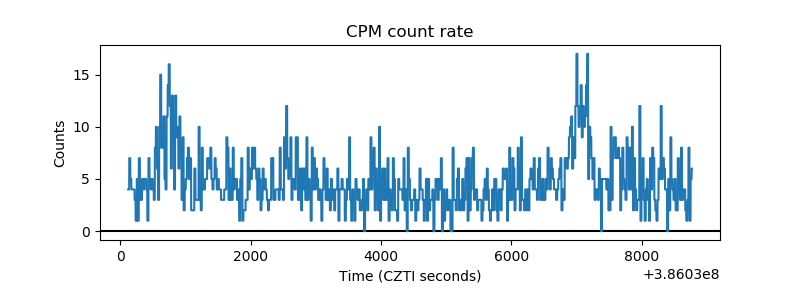 |
| CZT Counter | 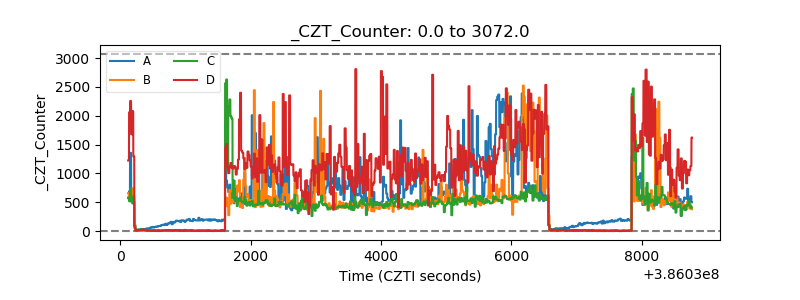 |
| +2.5 Volts monitor | 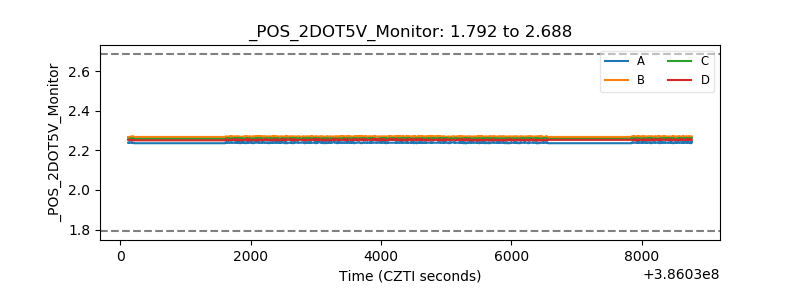 |
| +5 Volts monitor | 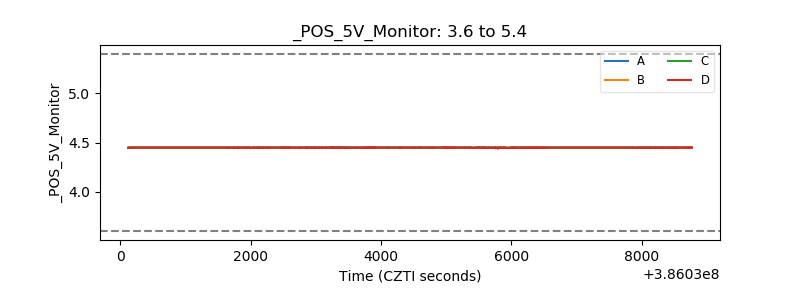 |
| _ROLL_ROT | 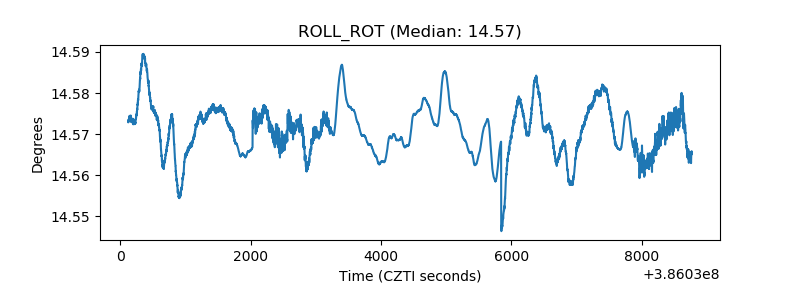 |
| _Roll_DEC | 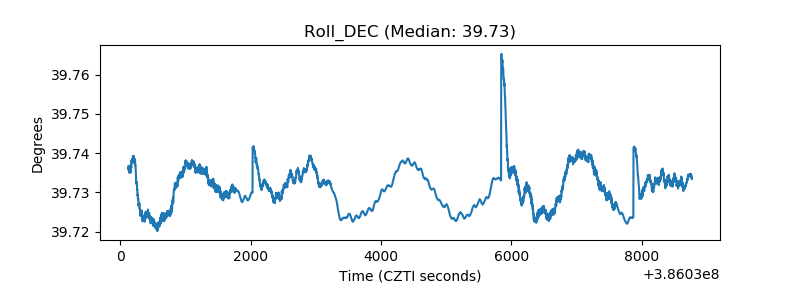 |
| _Roll_RA | 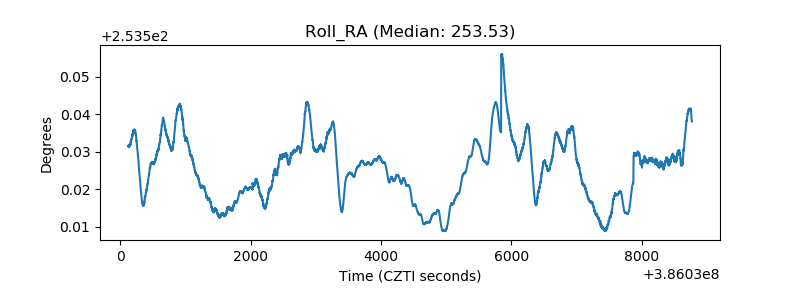 |
| Veto Counter | 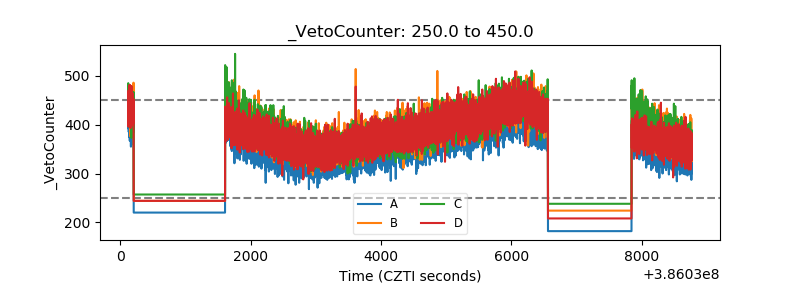 |