| Param | Original file | Final file |
|---|---|---|
| Filename | modeM0/AS1T05_015T01_9000005026_35107cztM0_level2.evt | modeM0/AS1T05_015T01_9000005026_35107cztM0_level2_quad_clean.evt |
| Size (bytes) | 560,908,800 | 80,798,400 |
| Size | 534.9 MB | 77.1 MB |
| Events in quadrant A | 4,449,522 | 497,228 |
| Events in quadrant B | 3,264,661 | 530,556 |
| Events in quadrant C | 3,166,977 | 526,037 |
| Events in quadrant D | 5,723,750 | 497,603 |
| Mode SS | |||
|---|---|---|---|
| Quadrant | BADHDUFLAG | Total packets | Discarded packets |
| A | 0 | 114 | 0 |
| B | 0 | 114 | 0 |
| C | 0 | 114 | 0 |
| D | 0 | 114 | 0 |
| Mode M9 | |||
|---|---|---|---|
| Quadrant | BADHDUFLAG | Total packets | Discarded packets |
| A | 0 | 25 | 0 |
| B | 0 | 25 | 0 |
| C | 0 | 25 | 0 |
| D | 0 | 26 | 0 |
| Mode M0 | |||
|---|---|---|---|
| Quadrant | BADHDUFLAG | Total packets | Discarded packets |
| A | 0 | 17147 | 3 |
| B | 0 | 13484 | 2 |
| C | 0 | 12793 | 2 |
| D | 0 | 21063 | 2 |
| Quadrant | Total seconds | Saturated seconds | Saturation percentage |
|---|---|---|---|
| A | 5652 | 603 | 10.668790% |
| B | 5652 | 127 | 2.246992% |
| C | 5652 | 150 | 2.653928% |
| D | 5652 | 162 | 2.866242% |
Noise dominated data is calculated using 1-second bins in cleaned event files. If a bin has >2000 counts, and if more than 50% of those come from <1% of pixels, then it is considered to be noise-dominated and hence unusable.
| Quadrant | # 1 sec bins | Bins with >0 counts | Bins with >2000 counts | High rate bins dominated by noise | Noise dominated (total time) | Noise dominated (detector-on time) | Marked lightcurve |
|---|---|---|---|---|---|---|---|
| A | 7055 | 5653 | 453 | 453 | 6.42% | 8.01% | 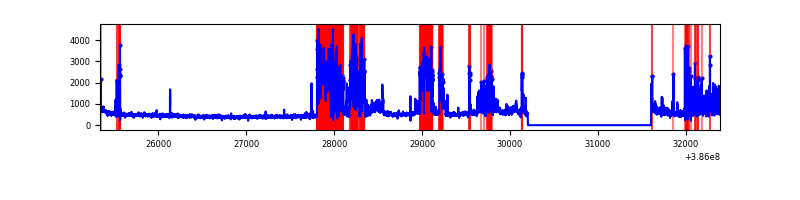 |
| B | 7055 | 5653 | 70 | 70 | 0.99% | 1.24% | 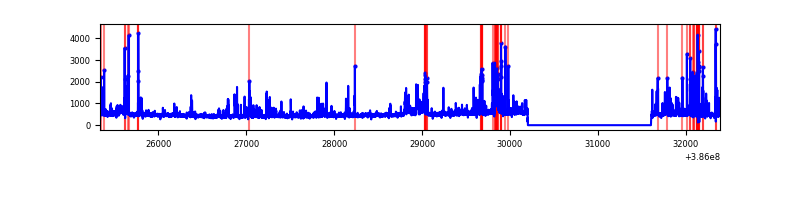 |
| C | 7055 | 5652 | 106 | 106 | 1.50% | 1.88% | 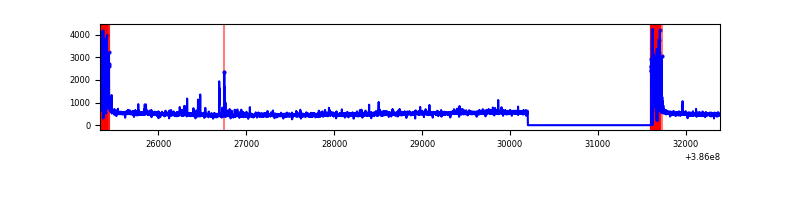 |
| D | 7055 | 5653 | 100 | 100 | 1.42% | 1.77% | 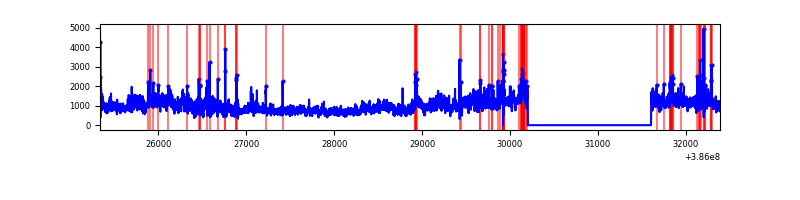 |
Top three noisy pixels from each quadrant. If the there are fewer than three noisy pixels in the level2.evt file, extra rows are filled as -1
| Pixel properties | Quadrant properties | ||||||
|---|---|---|---|---|---|---|---|
| Quadrant | DetID | PixID | Counts | Sigma | Mean | Median | Sigma |
| A | 15 | 169 | 1932925 | 15390.79 | 623 | 610 | 125.6 |
| A | 10 | 83 | 80898 | 639.49 | 623 | 610 | 125.6 |
| A | 13 | 6 | 16015 | 122.7 | 623 | 610 | 125.6 |
| B | 5 | 172 | 377027 | 3054.1 | 647 | 631 | 123.2 |
| B | 5 | 255 | 130443 | 1053.3 | 647 | 631 | 123.2 |
| B | 3 | 112 | 105349 | 849.69 | 647 | 631 | 123.2 |
| C | 0 | 10 | 378897 | 2576.32 | 634 | 638 | 146.8 |
| C | 15 | 214 | 236145 | 1604.04 | 634 | 638 | 146.8 |
| C | 12 | 250 | 43949 | 294.99 | 634 | 638 | 146.8 |
| D | 8 | 195 | 2737596 | 17985.48 | 630 | 613 | 152.2 |
| D | 2 | 250 | 142423 | 931.87 | 630 | 613 | 152.2 |
| D | 7 | 80 | 110911 | 724.8 | 630 | 613 | 152.2 |
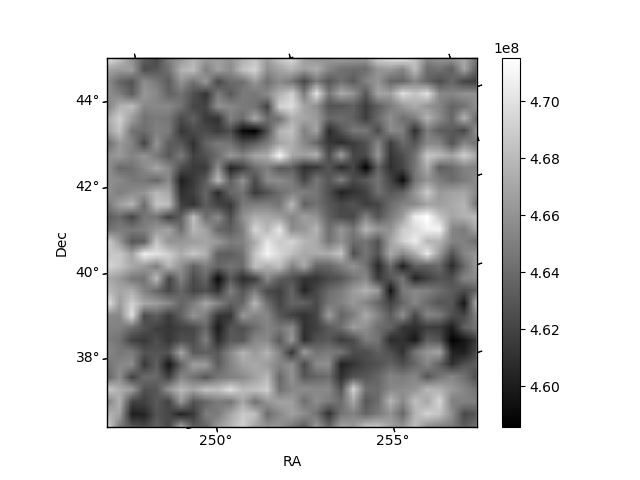
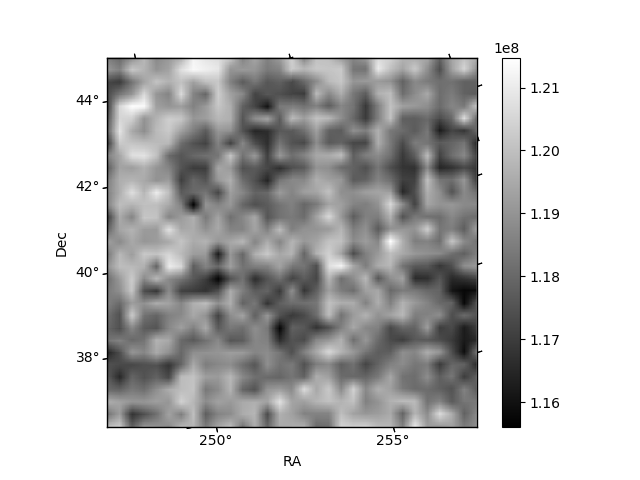
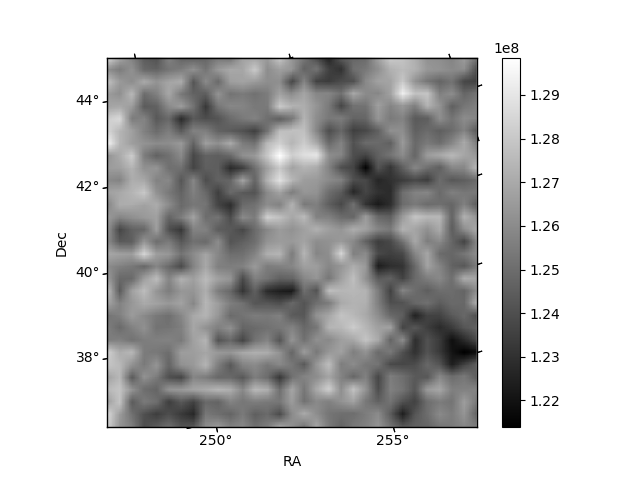
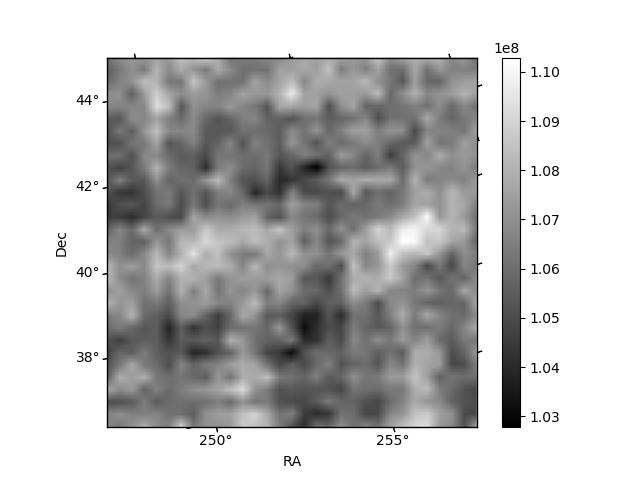
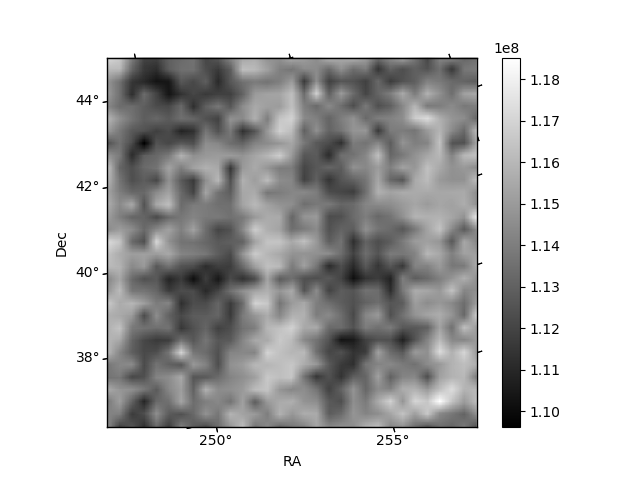
Histogram calculated using DETX and DETY for each event in the final _common_clean file
| Quadrant A | 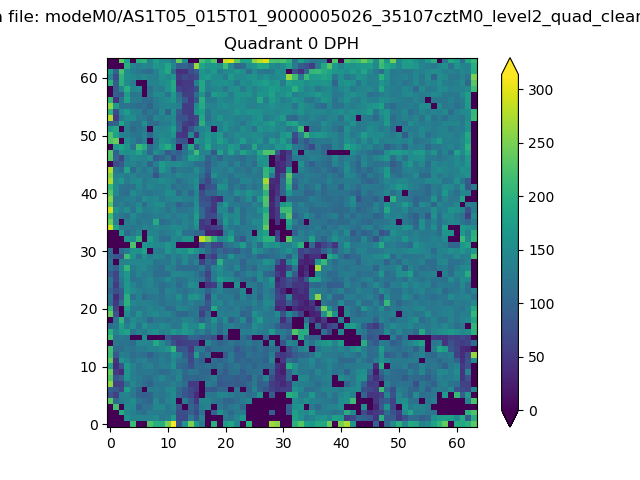 |
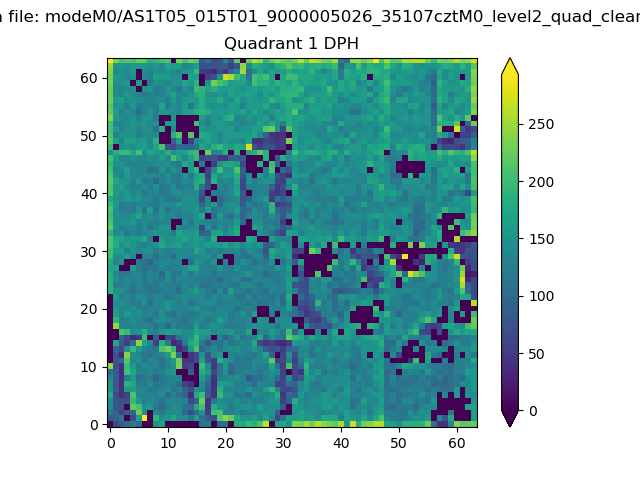 |
Quadrant B |
|---|---|---|---|
| Quadrant D | 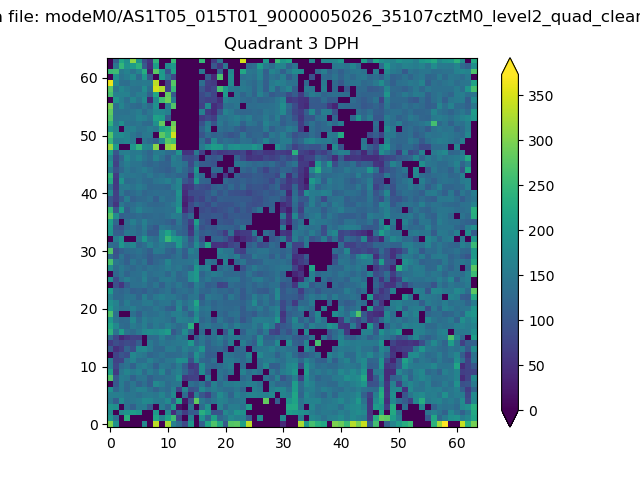 |
 |
Quadrant C |
| Plot type | Count rate plots | Images |
|---|---|---|
| Comparison with Poisson distribution Blue bars denote a histogram of data divided into 1 sec bins. Red curve is a Poisson curve with rate = median count rate of data. |
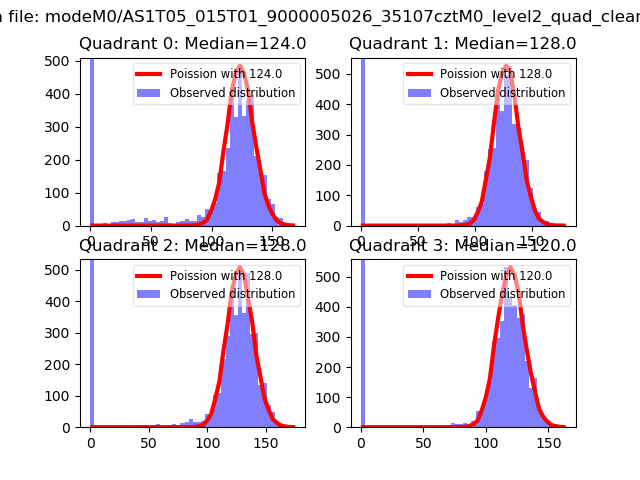 |
 |
| Quadrant-wise count rates Data is divided into 100 sec bins |
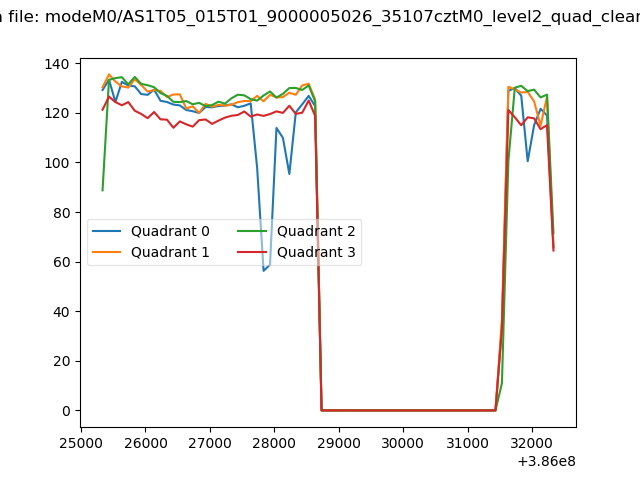 |
|
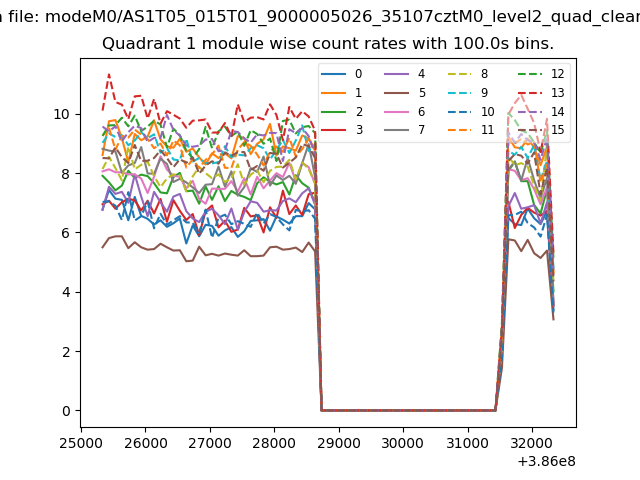
| Module-wise count rates for Quadrant A Data is divided into 100 sec bins |
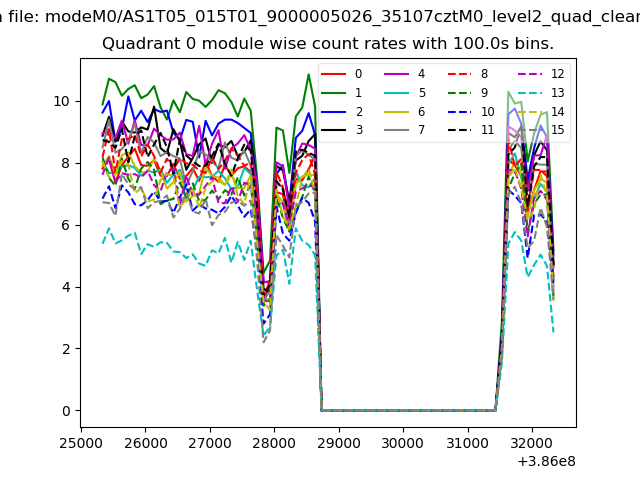 |
 |
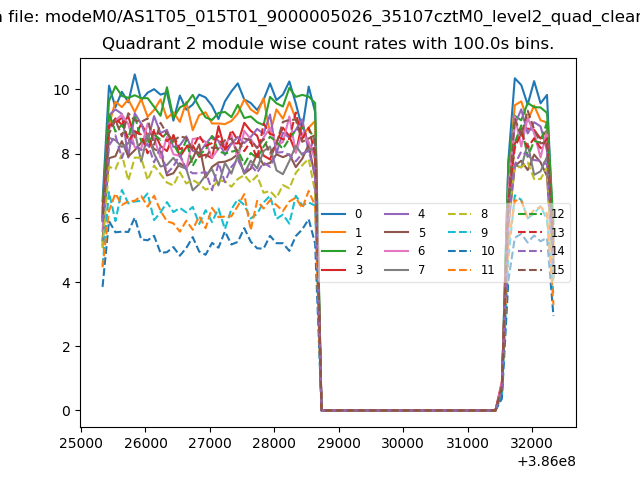
| Module-wise count rates for Quadrant B Data is divided into 100 sec bins |
 |
 |
| Module-wise count rates for Quadrant C Data is divided into 100 sec bins |
 |
 |
| Module-wise count rates for Quadrant D Data is divided into 100 sec bins |
 |
 |
| Parameter | Plot |
|---|---|
| CZT HV Monitor | 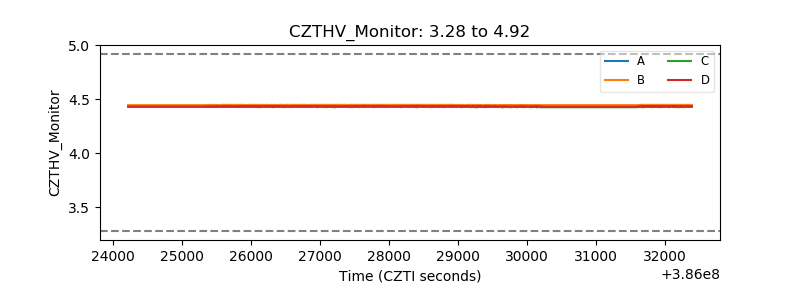 |
| D_VDD | 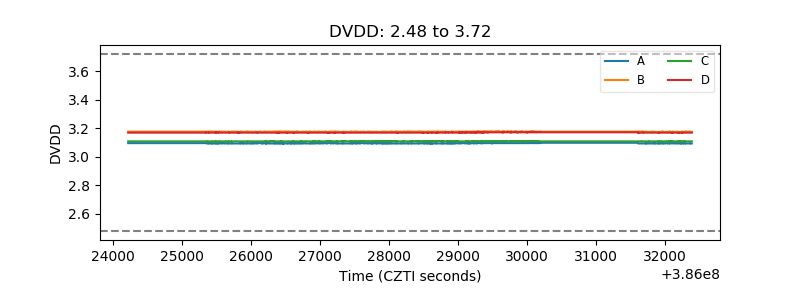 |
| Temperature 1 | 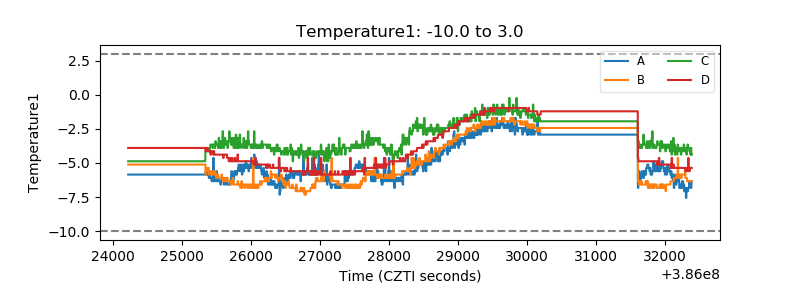 |
| Veto HV Monitor | 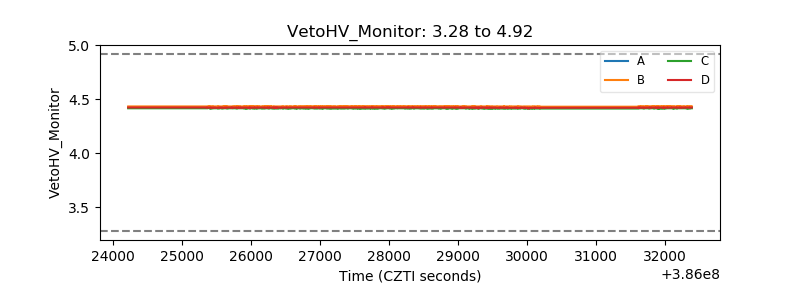 |
| Veto LLD |  |
| Alpha Counter | 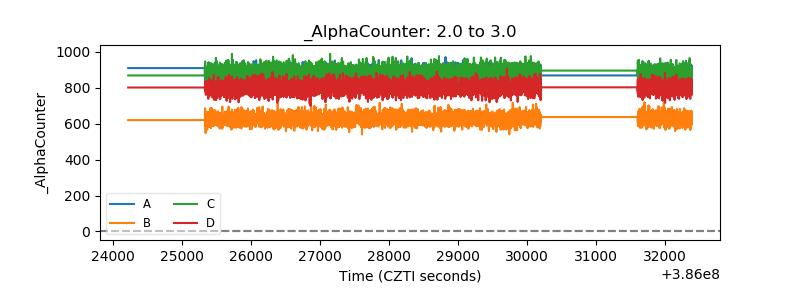 |
| _CPM_Rate | 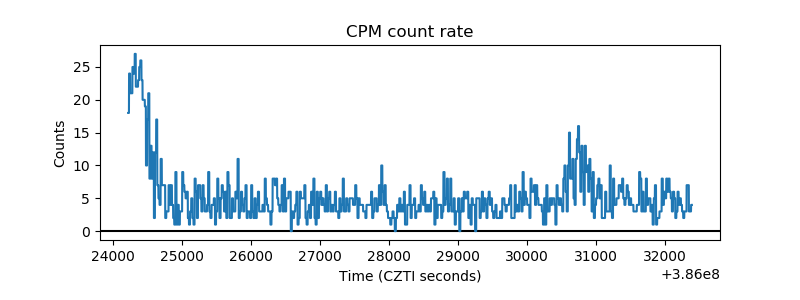 |
| CZT Counter | 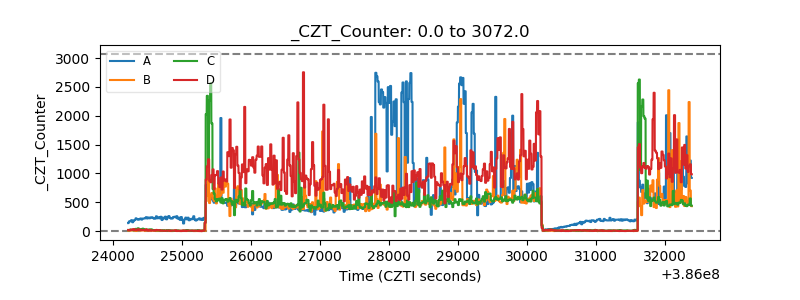 |
| +2.5 Volts monitor | 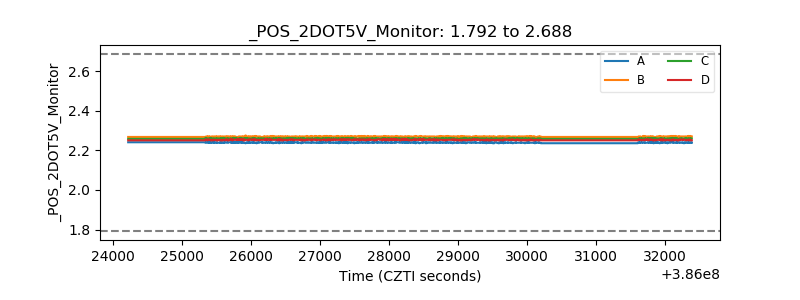 |
| +5 Volts monitor | 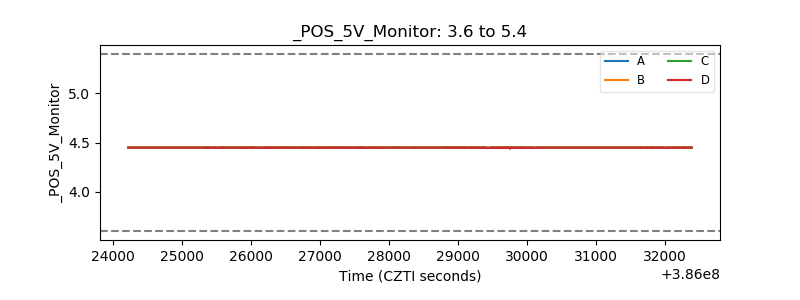 |
| _ROLL_ROT |  |
| _Roll_DEC | 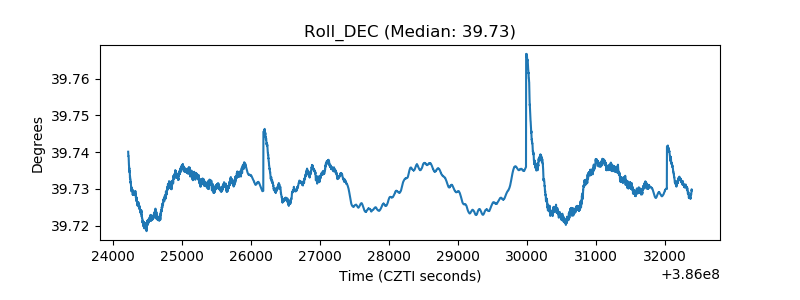 |
| _Roll_RA |  |
| Veto Counter | 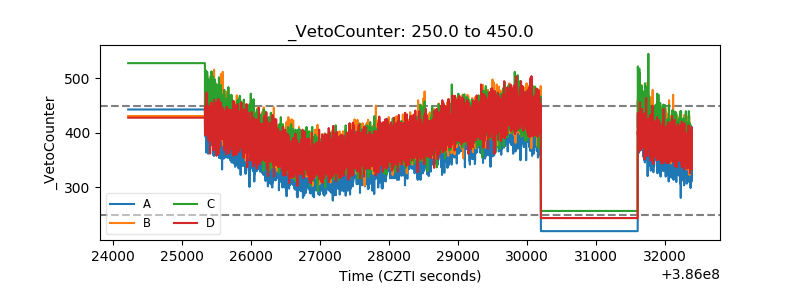 |