| Param | Original file | Final file |
|---|---|---|
| Filename | modeM0/AS1T05_015T01_9000005026_35105cztM0_level2.evt | modeM0/AS1T05_015T01_9000005026_35105cztM0_level2_quad_clean.evt |
| Size (bytes) | 482,163,840 | 91,414,080 |
| Size | 459.8 MB | 87.2 MB |
| Events in quadrant A | 3,210,576 | 590,725 |
| Events in quadrant B | 2,802,328 | 629,614 |
| Events in quadrant C | 2,937,542 | 625,167 |
| Events in quadrant D | 5,313,310 | 572,200 |
| Mode SS | |||
|---|---|---|---|
| Quadrant | BADHDUFLAG | Total packets | Discarded packets |
| A | 0 | 102 | 0 |
| B | 0 | 102 | 0 |
| C | 0 | 102 | 0 |
| D | 0 | 102 | 0 |
| Mode M9 | |||
|---|---|---|---|
| Quadrant | BADHDUFLAG | Total packets | Discarded packets |
| A | 0 | 35 | 0 |
| B | 0 | 35 | 0 |
| C | 0 | 35 | 0 |
| D | 0 | 36 | 0 |
| Mode M0 | |||
|---|---|---|---|
| Quadrant | BADHDUFLAG | Total packets | Discarded packets |
| A | 0 | 12824 | 3 |
| B | 0 | 11327 | 2 |
| C | 0 | 11667 | 2 |
| D | 0 | 19358 | 2 |
| Quadrant | Total seconds | Saturated seconds | Saturation percentage |
|---|---|---|---|
| A | 4999 | 362 | 7.241448% |
| B | 4999 | 71 | 1.420284% |
| C | 4999 | 92 | 1.840368% |
| D | 4999 | 169 | 3.380676% |
Noise dominated data is calculated using 1-second bins in cleaned event files. If a bin has >2000 counts, and if more than 50% of those come from <1% of pixels, then it is considered to be noise-dominated and hence unusable.
| Quadrant | # 1 sec bins | Bins with >0 counts | Bins with >2000 counts | High rate bins dominated by noise | Noise dominated (total time) | Noise dominated (detector-on time) | Marked lightcurve |
|---|---|---|---|---|---|---|---|
| A | 7002 | 5000 | 274 | 274 | 3.91% | 5.48% | 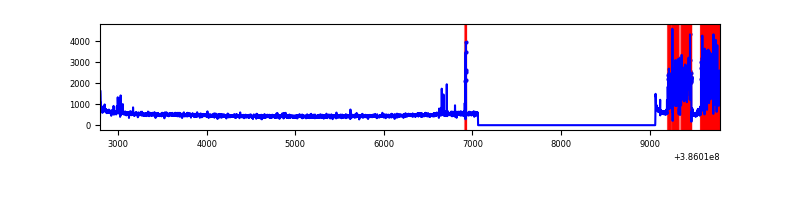 |
| B | 7002 | 5000 | 42 | 42 | 0.60% | 0.84% | 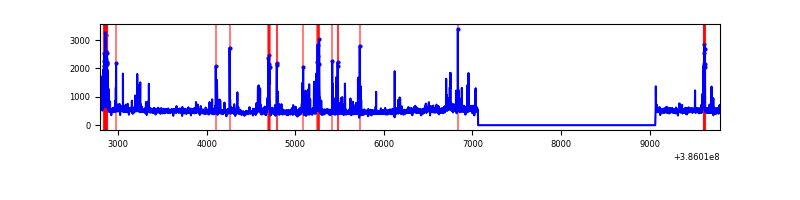 |
| C | 7002 | 5000 | 62 | 62 | 0.89% | 1.24% | 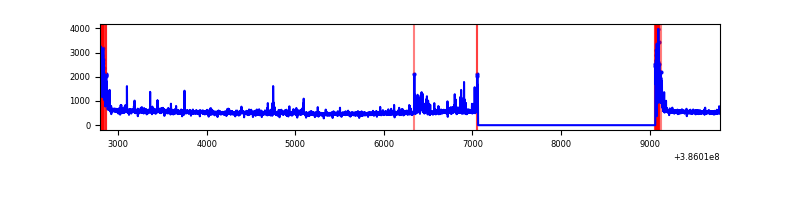 |
| D | 7002 | 5000 | 130 | 130 | 1.86% | 2.60% | 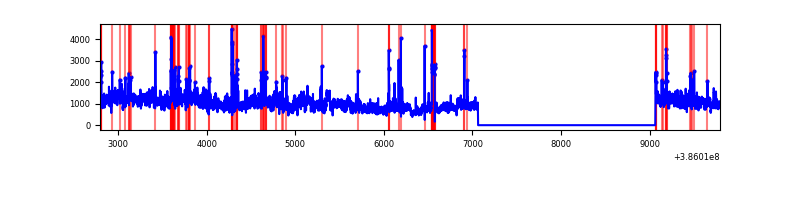 |
Top three noisy pixels from each quadrant. If the there are fewer than three noisy pixels in the level2.evt file, extra rows are filled as -1
| Pixel properties | Quadrant properties | ||||||
|---|---|---|---|---|---|---|---|
| Quadrant | DetID | PixID | Counts | Sigma | Mean | Median | Sigma |
| A | 15 | 169 | 853739 | 7215.41 | 584 | 572 | 118.2 |
| A | 10 | 83 | 78308 | 657.43 | 584 | 572 | 118.2 |
| A | 9 | 143 | 13197 | 106.77 | 584 | 572 | 118.2 |
| B | 5 | 172 | 265058 | 2310.74 | 603 | 589 | 114.5 |
| B | 5 | 255 | 68904 | 596.89 | 603 | 589 | 114.5 |
| B | 0 | 189 | 43354 | 373.65 | 603 | 589 | 114.5 |
| C | 0 | 10 | 254112 | 1841.22 | 594 | 598 | 137.7 |
| C | 15 | 214 | 209749 | 1519.02 | 594 | 598 | 137.7 |
| C | 4 | 254 | 75737 | 545.72 | 594 | 598 | 137.7 |
| D | 8 | 195 | 2539612 | 17673.38 | 583 | 567 | 143.7 |
| D | 13 | 249 | 197070 | 1367.79 | 583 | 567 | 143.7 |
| D | 12 | 6 | 84781 | 586.18 | 583 | 567 | 143.7 |
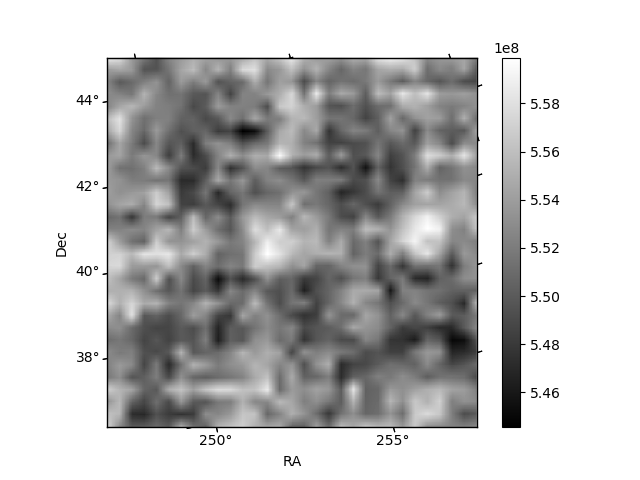
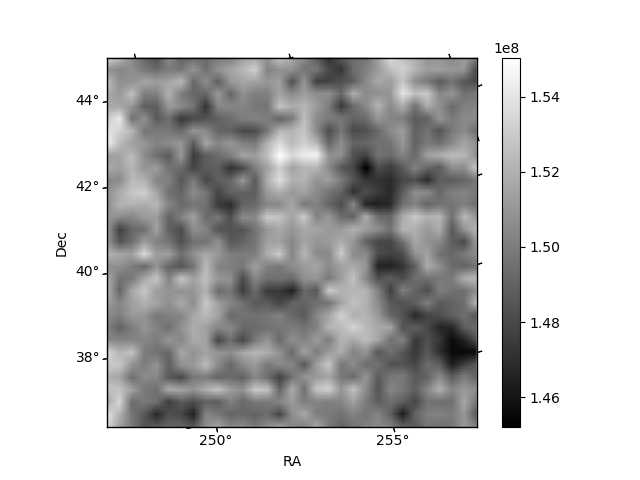
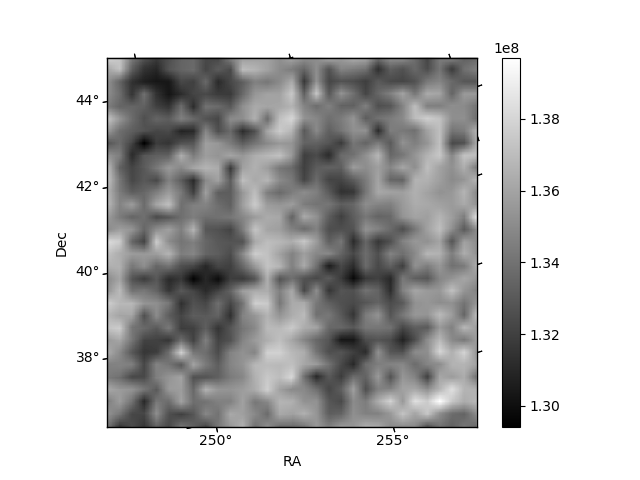
Histogram calculated using DETX and DETY for each event in the final _common_clean file
| Quadrant A | 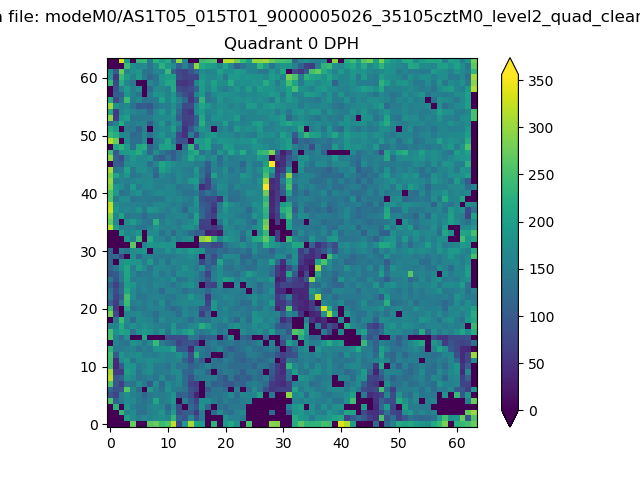 |
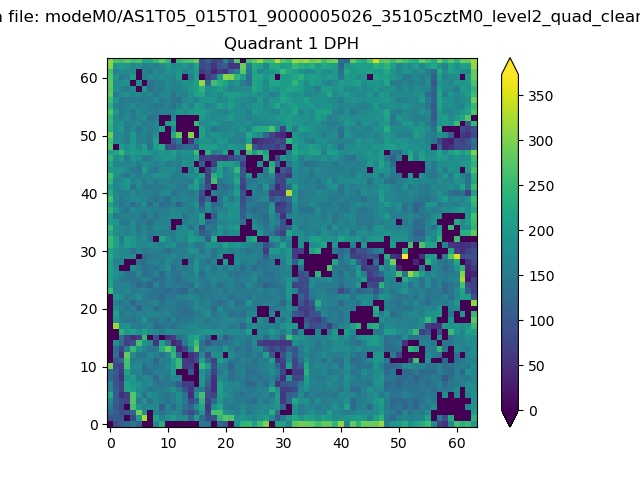 |
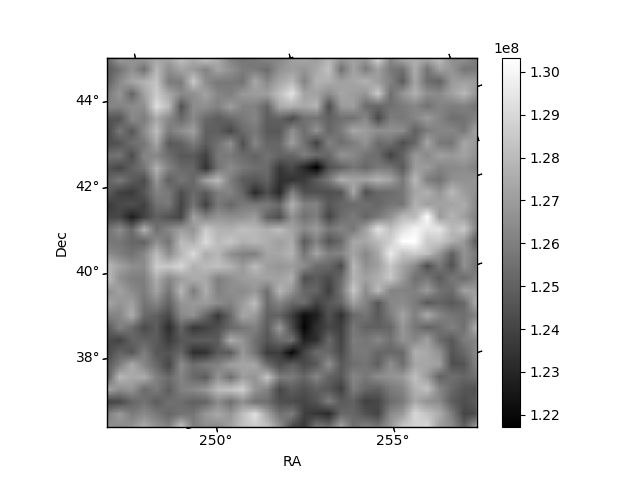
Quadrant B |
|---|---|---|---|
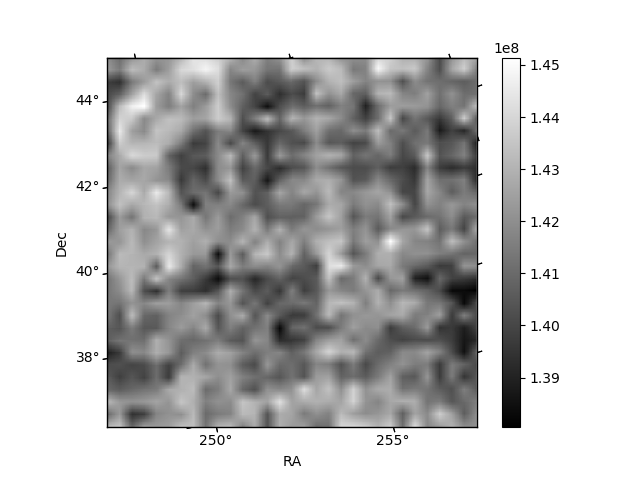
| Quadrant D |  |
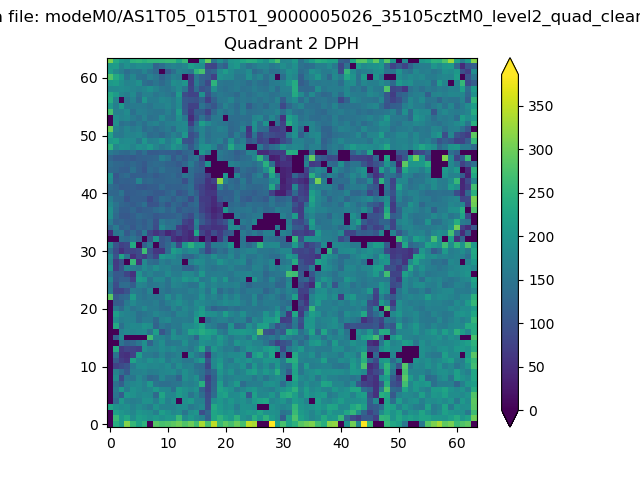 |
Quadrant C |
| Plot type | Count rate plots | Images |
|---|---|---|
| Comparison with Poisson distribution Blue bars denote a histogram of data divided into 1 sec bins. Red curve is a Poisson curve with rate = median count rate of data. |
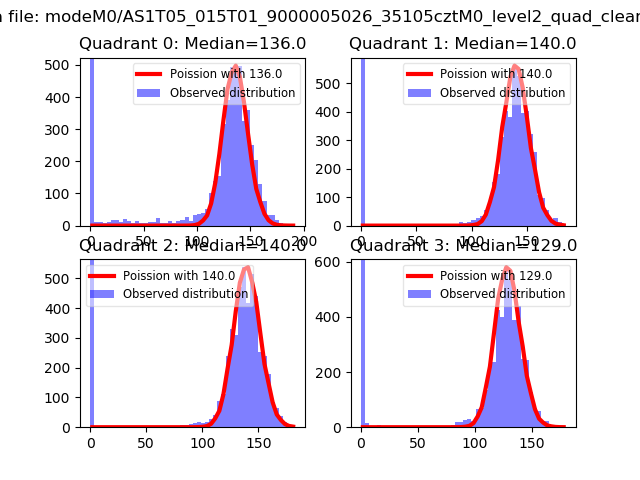 |
 |
| Quadrant-wise count rates Data is divided into 100 sec bins |
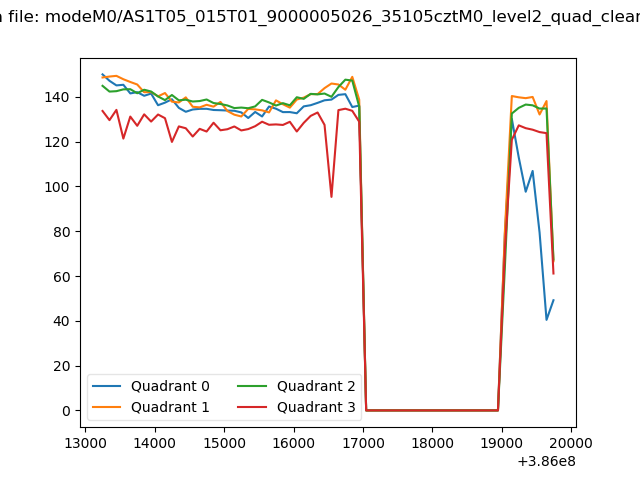 |
|
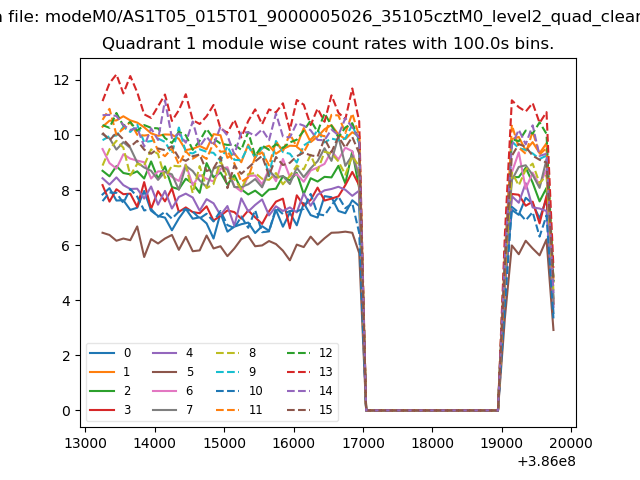
| Module-wise count rates for Quadrant A Data is divided into 100 sec bins |
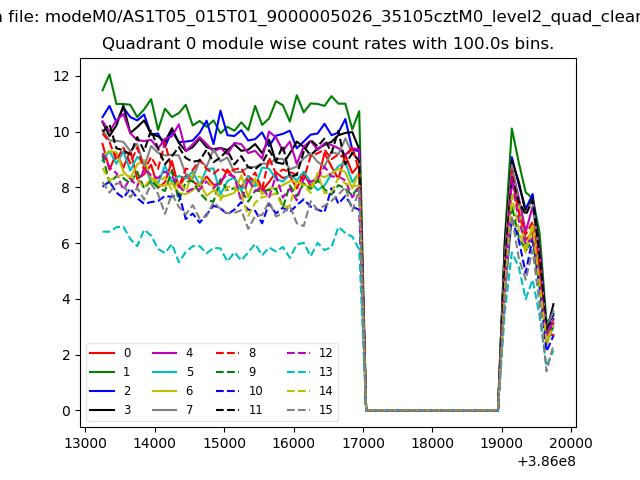 |
 |
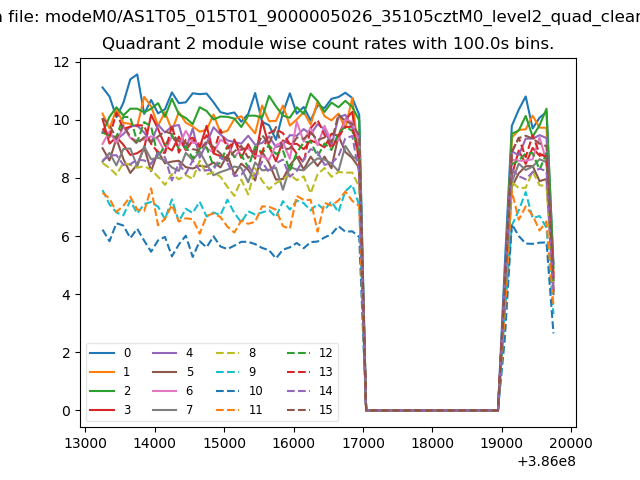
| Module-wise count rates for Quadrant B Data is divided into 100 sec bins |
 |
 |
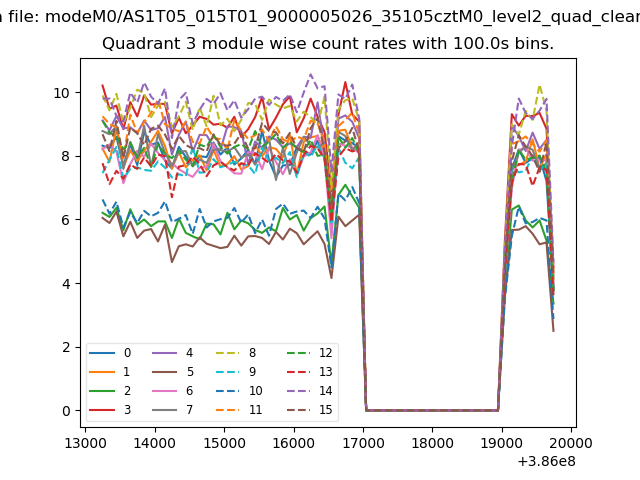
| Module-wise count rates for Quadrant C Data is divided into 100 sec bins |
 |
 |
| Module-wise count rates for Quadrant D Data is divided into 100 sec bins |
 |
 |
| Parameter | Plot |
|---|---|
| CZT HV Monitor | 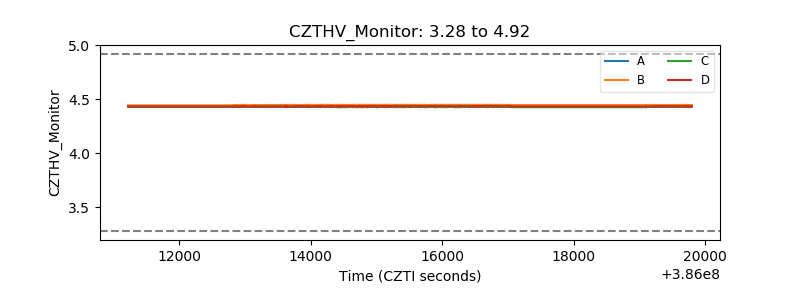 |
| D_VDD | 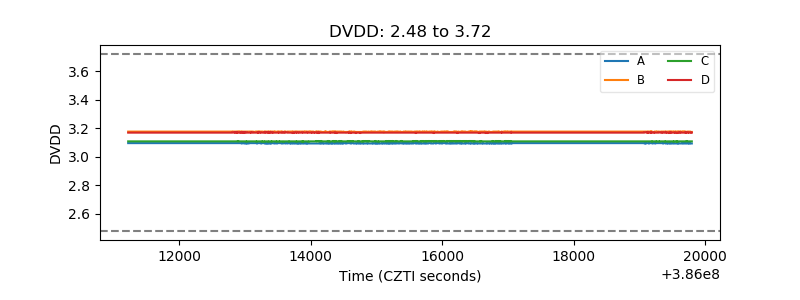 |
| Temperature 1 | 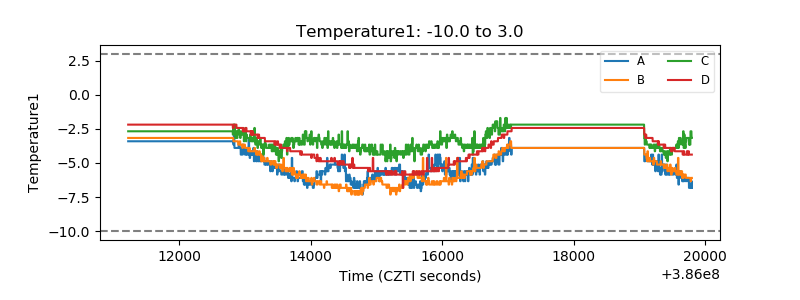 |
| Veto HV Monitor | 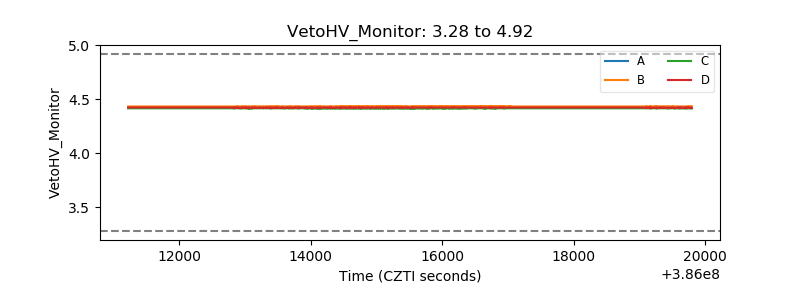 |
| Veto LLD | 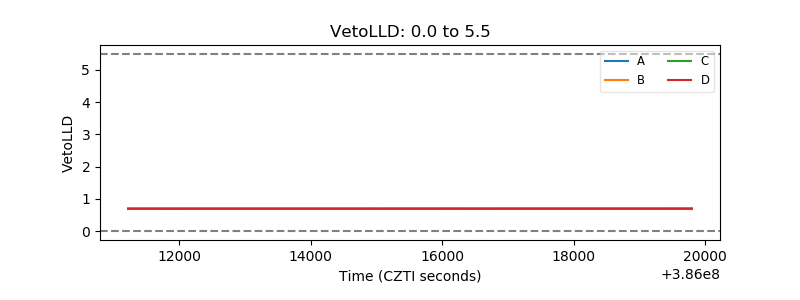 |
| Alpha Counter | 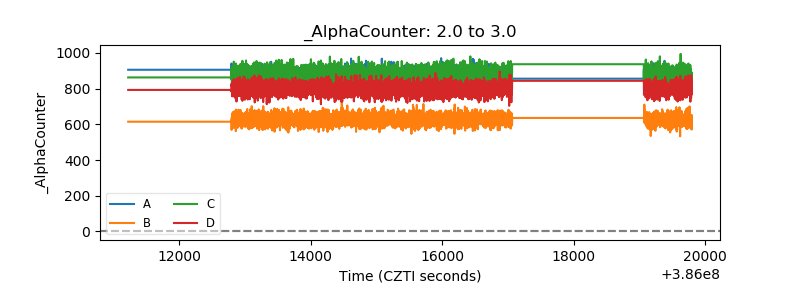 |
| _CPM_Rate | 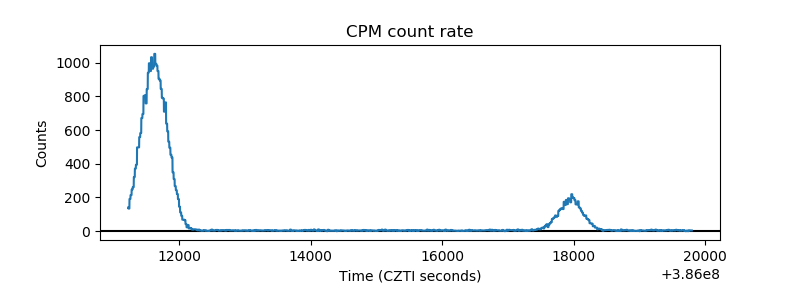 |
| CZT Counter | 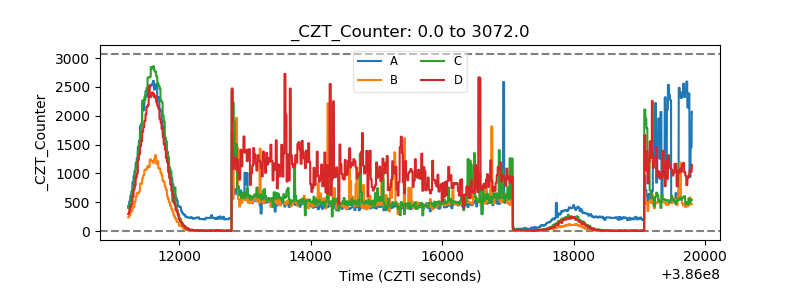 |
| +2.5 Volts monitor | 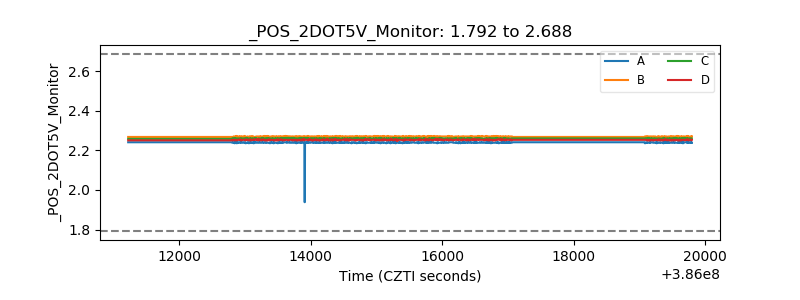 |
| +5 Volts monitor | 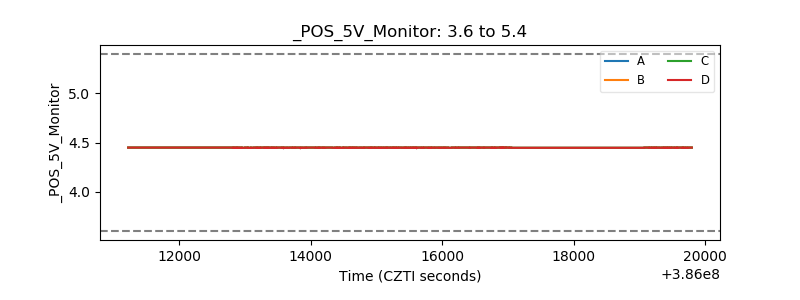 |
| _ROLL_ROT | 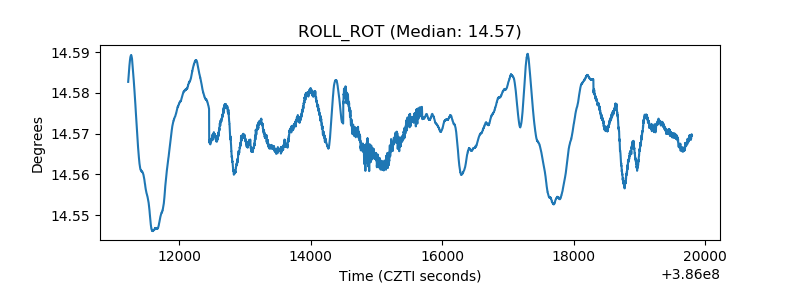 |
| _Roll_DEC | 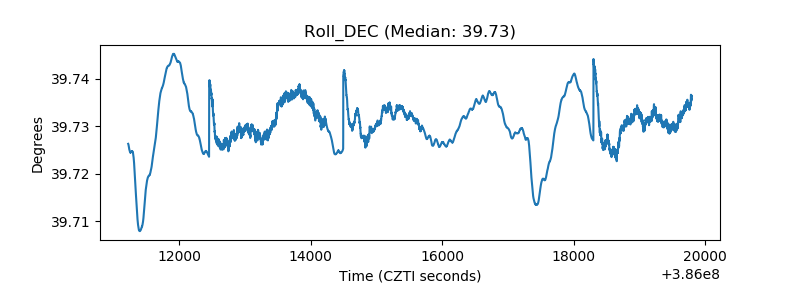 |
| _Roll_RA | 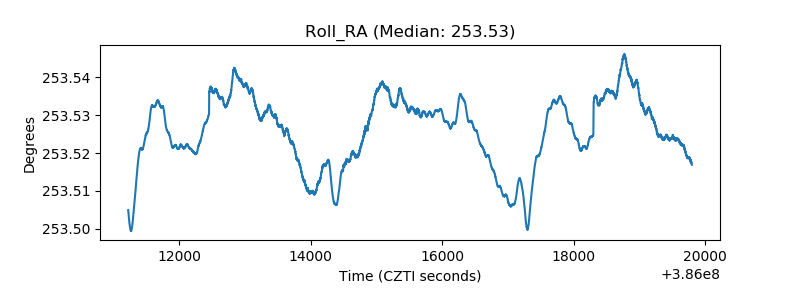 |
| Veto Counter | 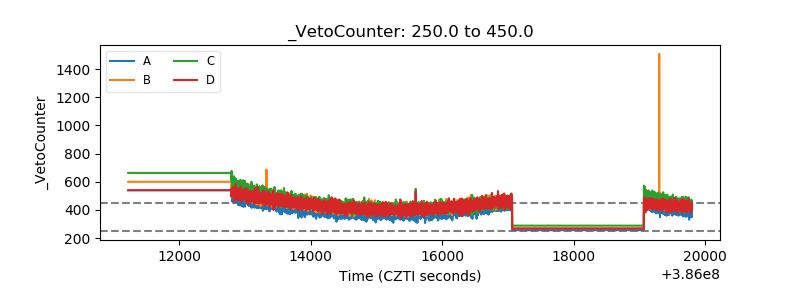 |