| Param | Original file | Final file |
|---|---|---|
| Filename | modeM0/AS1T05_015T01_9000005026_35102cztM0_level2.evt | modeM0/AS1T05_015T01_9000005026_35102cztM0_level2_quad_clean.evt |
| Size (bytes) | 556,165,440 | 59,901,120 |
| Size | 530.4 MB | 57.1 MB |
| Events in quadrant A | 3,055,829 | 369,449 |
| Events in quadrant B | 3,199,001 | 372,502 |
| Events in quadrant C | 3,295,411 | 368,903 |
| Events in quadrant D | 6,942,065 | 338,064 |
| Mode SS | |||
|---|---|---|---|
| Quadrant | BADHDUFLAG | Total packets | Discarded packets |
| A | 0 | 106 | 0 |
| B | 0 | 106 | 0 |
| C | 0 | 106 | 0 |
| D | 0 | 106 | 0 |
| Mode M9 | |||
|---|---|---|---|
| Quadrant | BADHDUFLAG | Total packets | Discarded packets |
| A | 0 | 28 | 0 |
| B | 0 | 28 | 0 |
| C | 0 | 28 | 0 |
| D | 0 | 29 | 0 |
| Mode M0 | |||
|---|---|---|---|
| Quadrant | BADHDUFLAG | Total packets | Discarded packets |
| A | 0 | 12413 | 3 |
| B | 0 | 12894 | 2 |
| C | 0 | 13139 | 2 |
| D | 0 | 24252 | 2 |
| Quadrant | Total seconds | Saturated seconds | Saturation percentage |
|---|---|---|---|
| A | 5204 | 37 | 0.710992% |
| B | 5204 | 48 | 0.922367% |
| C | 5204 | 125 | 2.401998% |
| D | 5204 | 357 | 6.860108% |
Noise dominated data is calculated using 1-second bins in cleaned event files. If a bin has >2000 counts, and if more than 50% of those come from <1% of pixels, then it is considered to be noise-dominated and hence unusable.
| Quadrant | # 1 sec bins | Bins with >0 counts | Bins with >2000 counts | High rate bins dominated by noise | Noise dominated (total time) | Noise dominated (detector-on time) | Marked lightcurve |
|---|---|---|---|---|---|---|---|
| A | 7266 | 5205 | 22 | 22 | 0.30% | 0.42% | 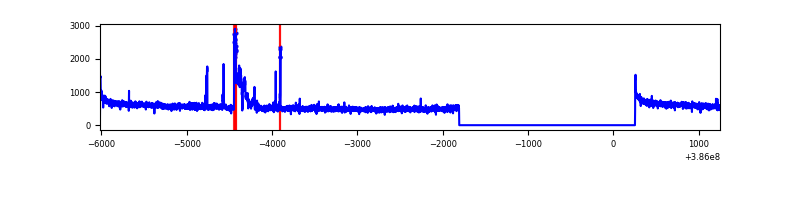 |
| B | 7266 | 5205 | 21 | 21 | 0.29% | 0.40% | 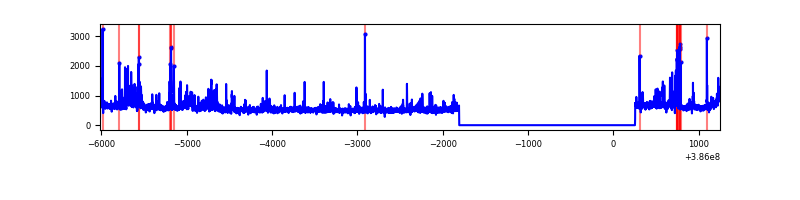 |
| C | 7266 | 5205 | 83 | 83 | 1.14% | 1.59% | 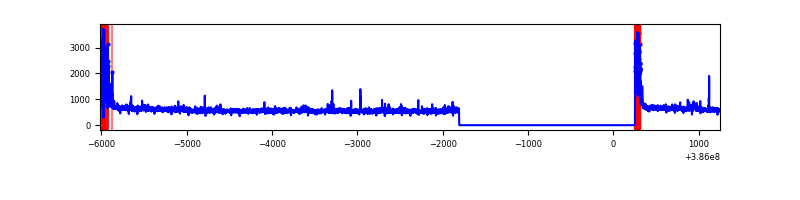 |
| D | 7266 | 5205 | 262 | 262 | 3.61% | 5.03% | 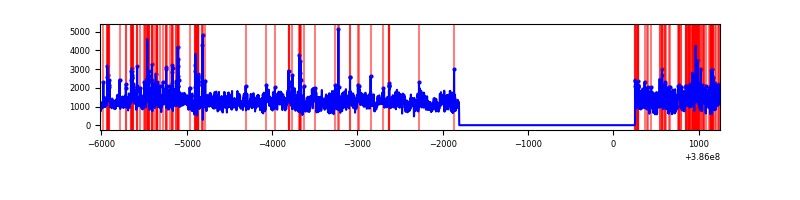 |
Top three noisy pixels from each quadrant. If the there are fewer than three noisy pixels in the level2.evt file, extra rows are filled as -1
| Pixel properties | Quadrant properties | ||||||
|---|---|---|---|---|---|---|---|
| Quadrant | DetID | PixID | Counts | Sigma | Mean | Median | Sigma |
| A | 15 | 174 | 202064 | 1435.04 | 714 | 704 | 140.3 |
| A | 10 | 83 | 81888 | 578.58 | 714 | 704 | 140.3 |
| A | 13 | 254 | 9465 | 62.44 | 714 | 704 | 140.3 |
| B | 5 | 172 | 204311 | 1542.46 | 705 | 692 | 132.0 |
| B | 5 | 255 | 86462 | 649.73 | 705 | 692 | 132.0 |
| B | 0 | 190 | 67716 | 507.72 | 705 | 692 | 132.0 |
| C | 0 | 10 | 307159 | 1962.63 | 687 | 695 | 156.1 |
| C | 15 | 214 | 215338 | 1374.59 | 687 | 695 | 156.1 |
| C | 14 | 67 | 38725 | 243.55 | 687 | 695 | 156.1 |
| D | 8 | 195 | 3664906 | 22306.7 | 683 | 666 | 164.3 |
| D | 13 | 249 | 186055 | 1128.59 | 683 | 666 | 164.3 |
| D | 7 | 80 | 128451 | 777.91 | 683 | 666 | 164.3 |
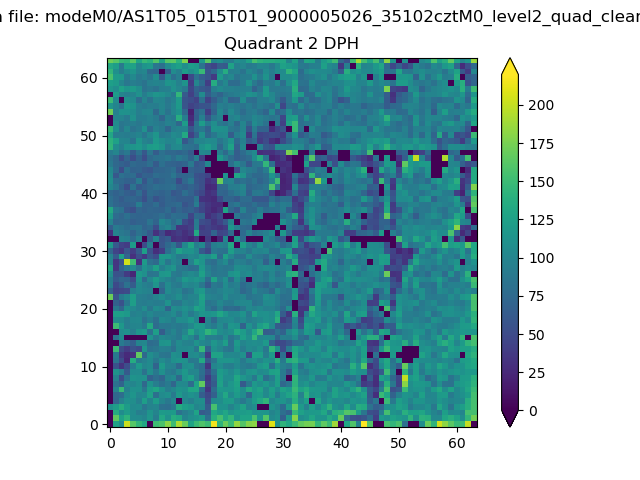
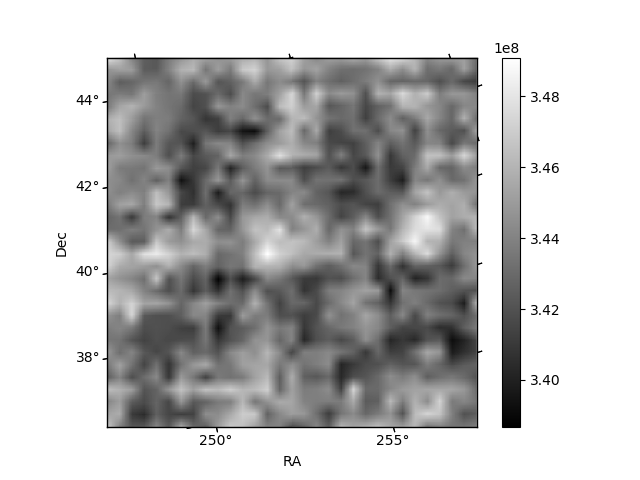
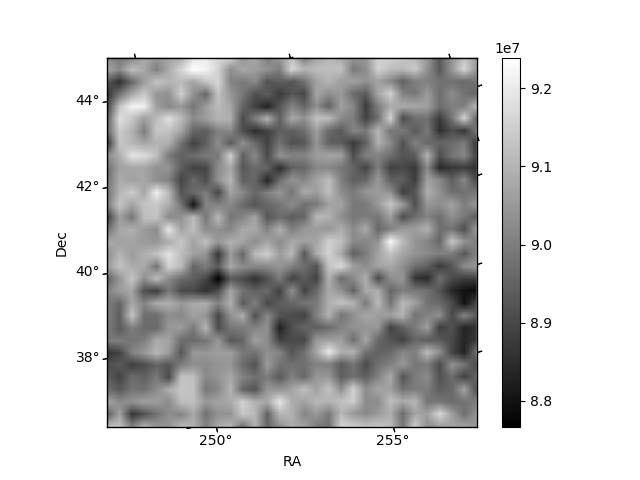
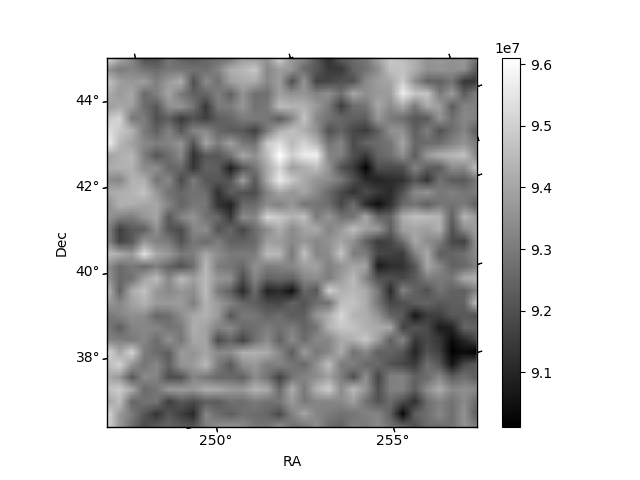
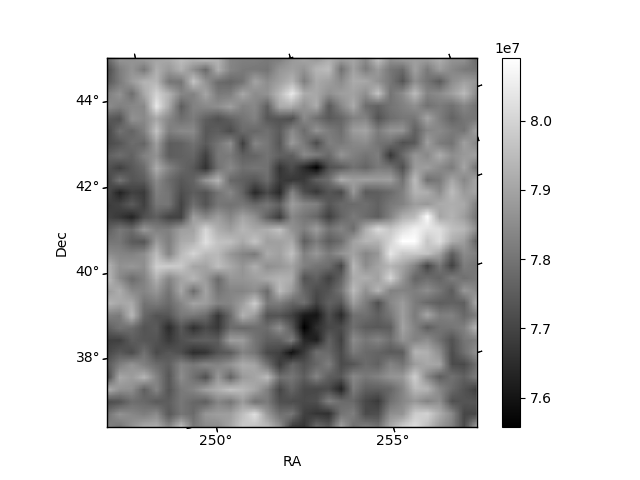
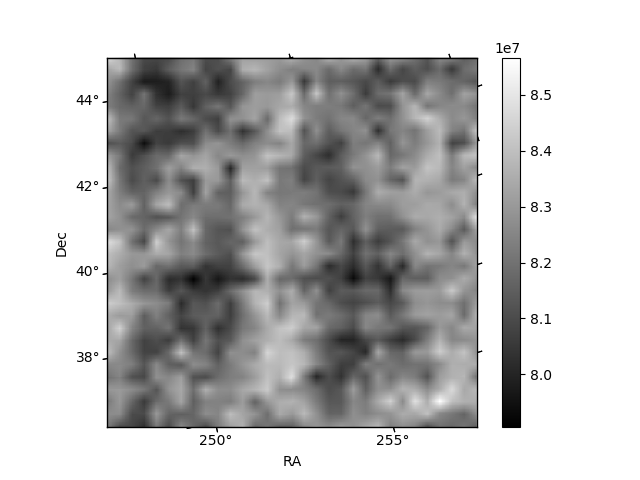
Histogram calculated using DETX and DETY for each event in the final _common_clean file
| Quadrant A | 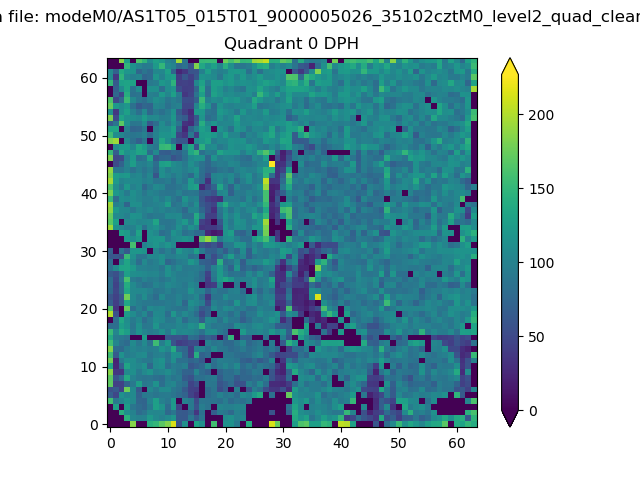 |
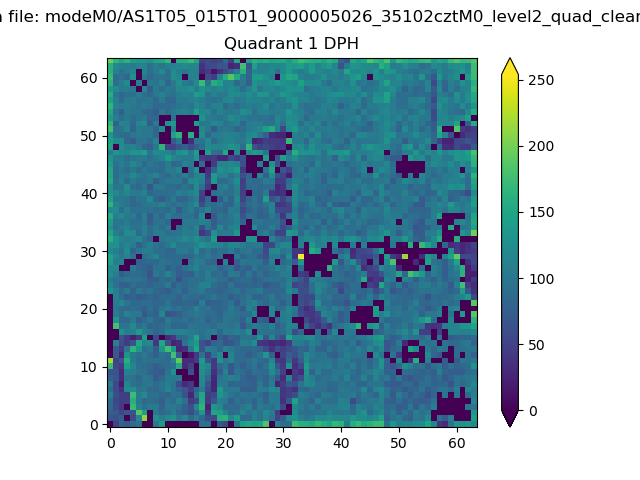 |
Quadrant B |
|---|---|---|---|
| Quadrant D | 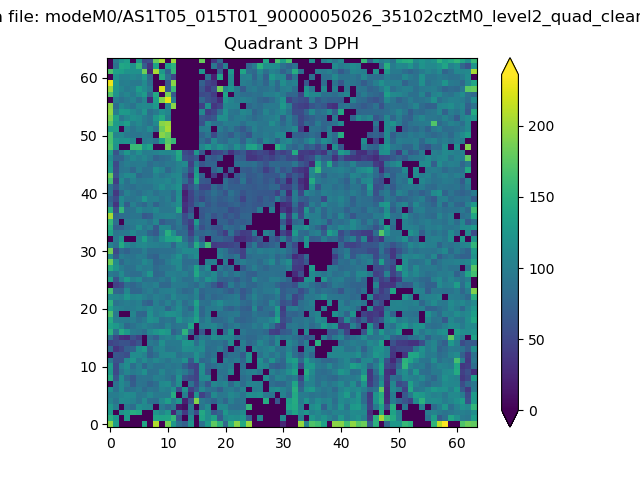 |
 |
Quadrant C |
| Plot type | Count rate plots | Images |
|---|---|---|
| Comparison with Poisson distribution Blue bars denote a histogram of data divided into 1 sec bins. Red curve is a Poisson curve with rate = median count rate of data. |
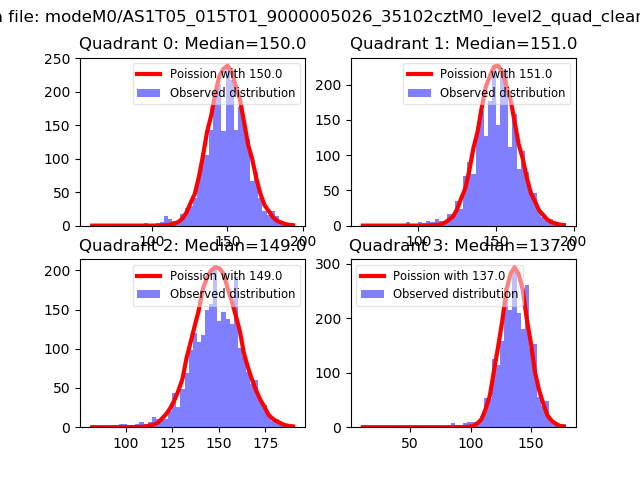 |
 |
| Quadrant-wise count rates Data is divided into 100 sec bins |
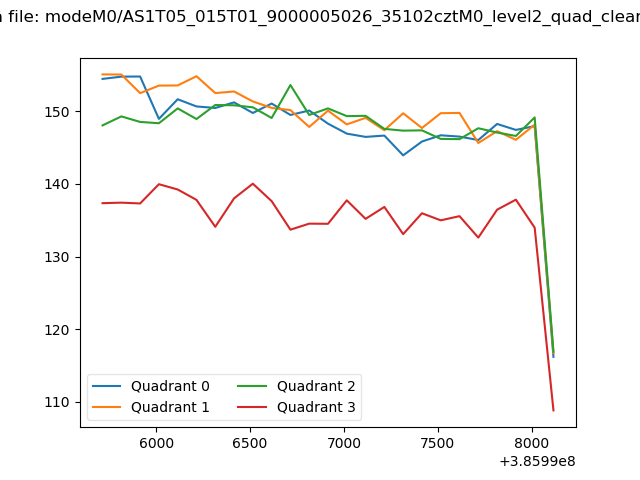 |
|
| Module-wise count rates for Quadrant A Data is divided into 100 sec bins |
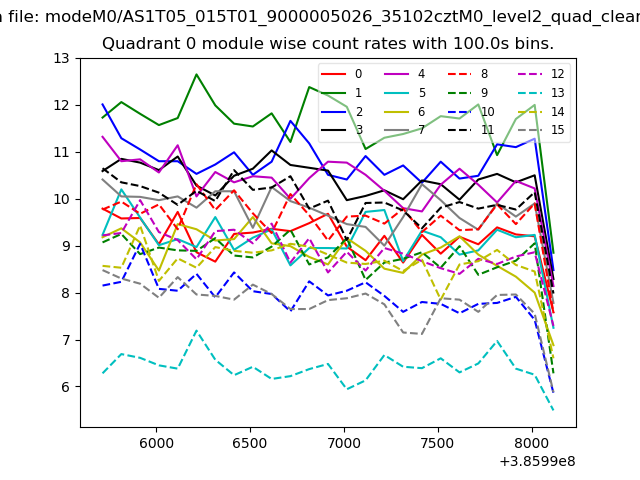 |
 |
| Module-wise count rates for Quadrant B Data is divided into 100 sec bins |
 |
 |
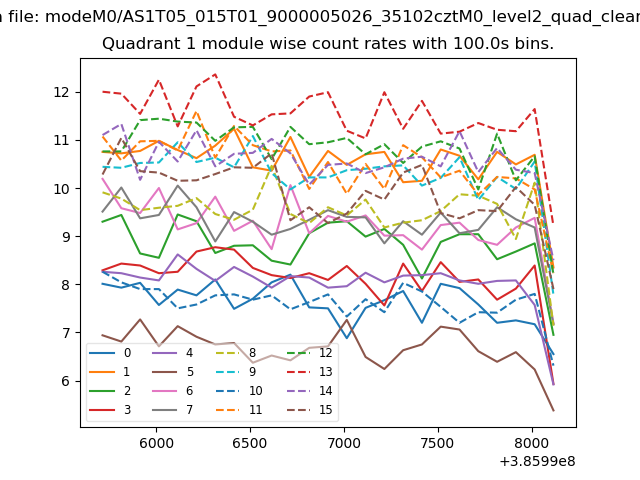
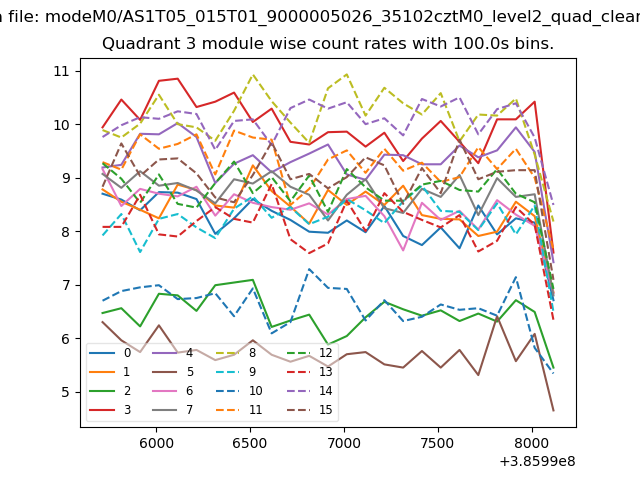
| Module-wise count rates for Quadrant C Data is divided into 100 sec bins |
 |
 |
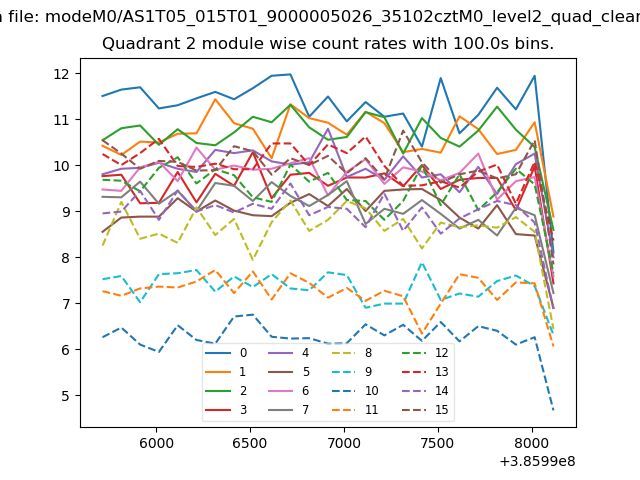
| Module-wise count rates for Quadrant D Data is divided into 100 sec bins |
 |
 |
| Parameter | Plot |
|---|---|
| CZT HV Monitor | 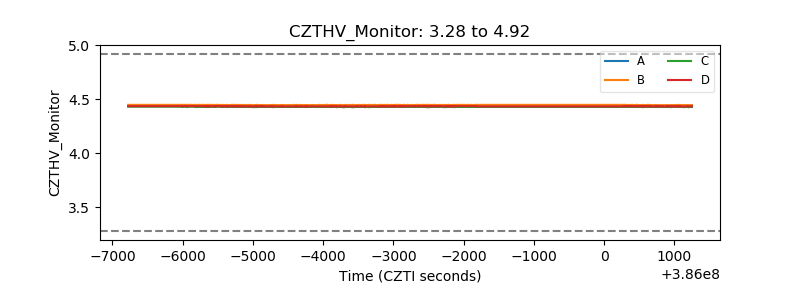 |
| D_VDD | 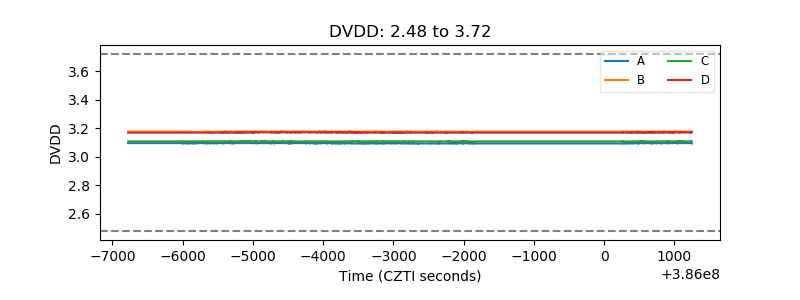 |
| Temperature 1 | 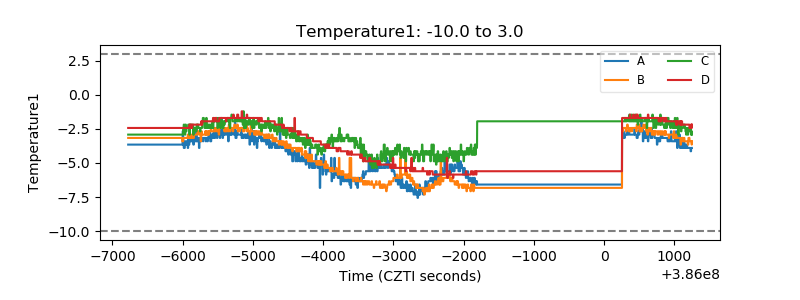 |
| Veto HV Monitor | 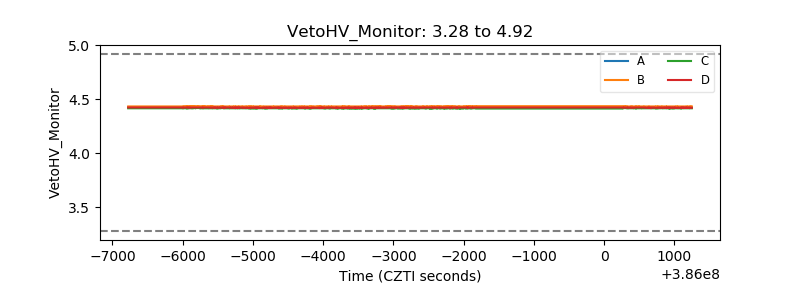 |
| Veto LLD | 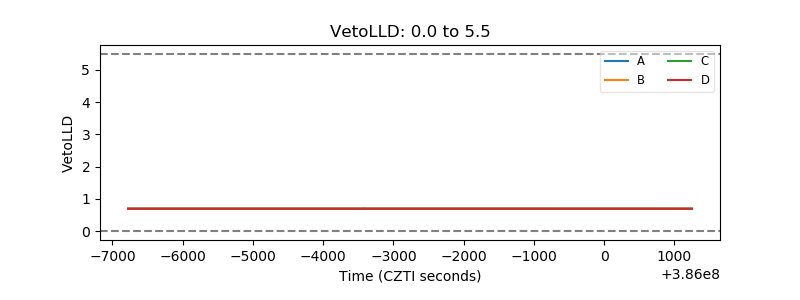 |
| Alpha Counter | 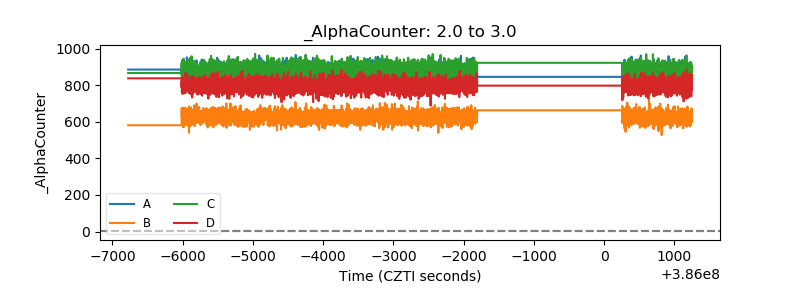 |
| _CPM_Rate | 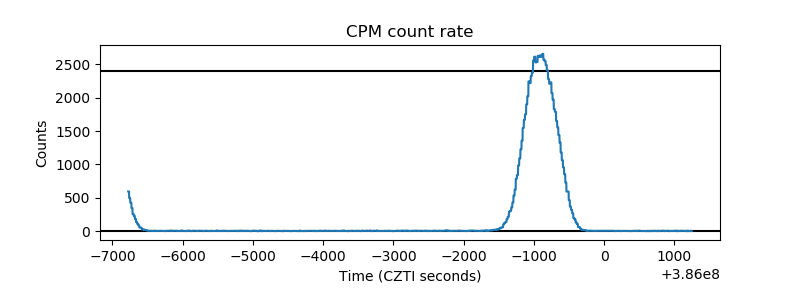 |
| CZT Counter | 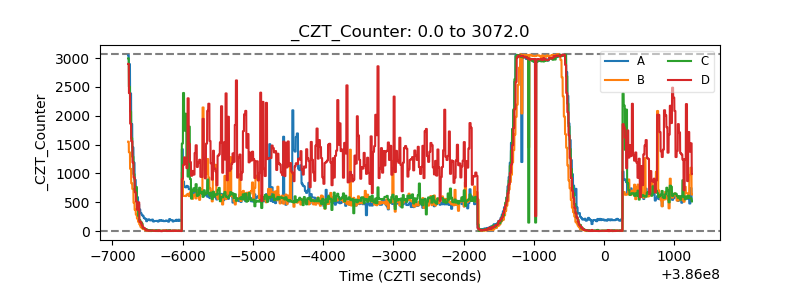 |
| +2.5 Volts monitor | 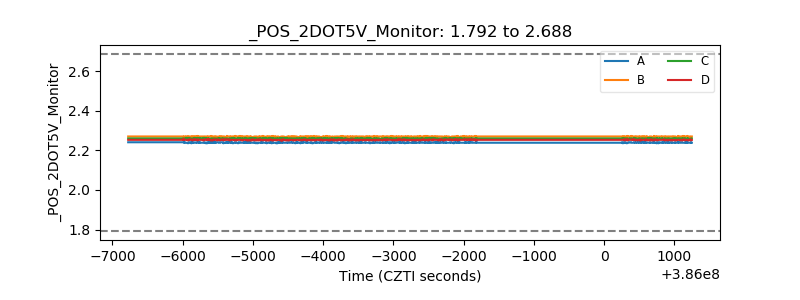 |
| +5 Volts monitor | 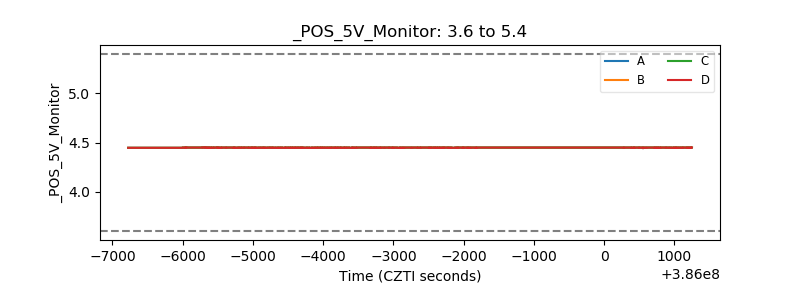 |
| _ROLL_ROT | 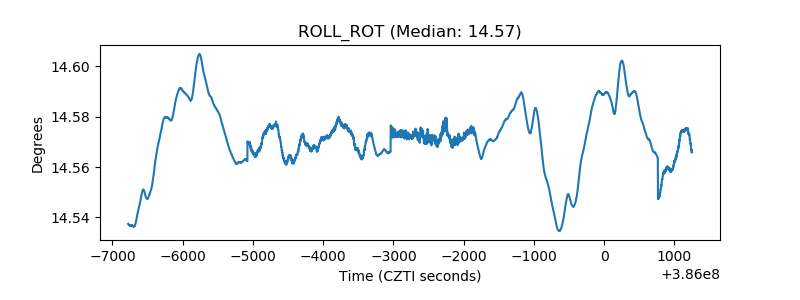 |
| _Roll_DEC | 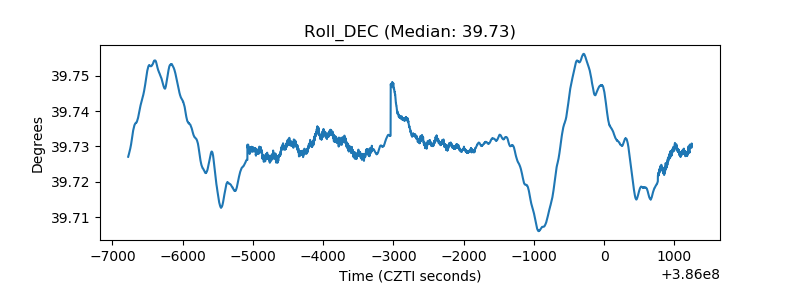 |
| _Roll_RA | 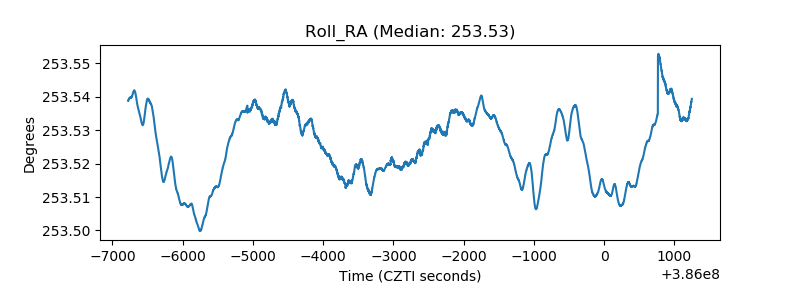 |
| Veto Counter | 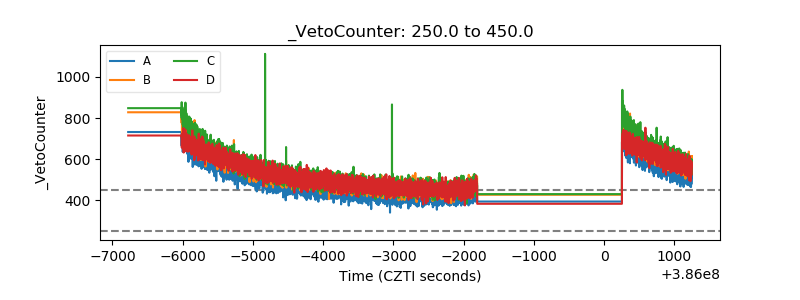 |