| Param | Original file | Final file |
|---|---|---|
| Filename | modeM0/AS1T05_015T01_9000005026_35100cztM0_level2.evt | modeM0/AS1T05_015T01_9000005026_35100cztM0_level2_quad_clean.evt |
| Size (bytes) | 612,241,920 | 56,695,680 |
| Size | 583.9 MB | 54.1 MB |
| Events in quadrant A | 2,821,751 | 347,241 |
| Events in quadrant B | 3,492,506 | 345,186 |
| Events in quadrant C | 3,296,330 | 332,054 |
| Events in quadrant D | 8,559,081 | 306,197 |
| Mode SS | |||
|---|---|---|---|
| Quadrant | BADHDUFLAG | Total packets | Discarded packets |
| A | 0 | 112 | 0 |
| B | 0 | 112 | 0 |
| C | 0 | 112 | 0 |
| D | 0 | 112 | 0 |
| Mode M9 | |||
|---|---|---|---|
| Quadrant | BADHDUFLAG | Total packets | Discarded packets |
| A | 0 | 18 | 0 |
| B | 0 | 18 | 0 |
| C | 0 | 18 | 0 |
| D | 0 | 19 | 0 |
| Mode M0 | |||
|---|---|---|---|
| Quadrant | BADHDUFLAG | Total packets | Discarded packets |
| A | 0 | 11674 | 3 |
| B | 0 | 13717 | 2 |
| C | 0 | 12867 | 2 |
| D | 0 | 29301 | 2 |
| Quadrant | Total seconds | Saturated seconds | Saturation percentage |
|---|---|---|---|
| A | 5510 | 12 | 0.217786% |
| B | 5510 | 168 | 3.049002% |
| C | 5510 | 165 | 2.994555% |
| D | 5510 | 1069 | 19.401089% |
Noise dominated data is calculated using 1-second bins in cleaned event files. If a bin has >2000 counts, and if more than 50% of those come from <1% of pixels, then it is considered to be noise-dominated and hence unusable.
| Quadrant | # 1 sec bins | Bins with >0 counts | Bins with >2000 counts | High rate bins dominated by noise | Noise dominated (total time) | Noise dominated (detector-on time) | Marked lightcurve |
|---|---|---|---|---|---|---|---|
| A | 7333 | 5511 | 1 | 1 | 0.01% | 0.02% | 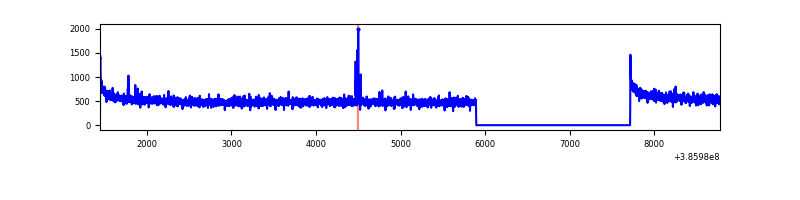 |
| B | 7333 | 5511 | 111 | 111 | 1.51% | 2.01% | 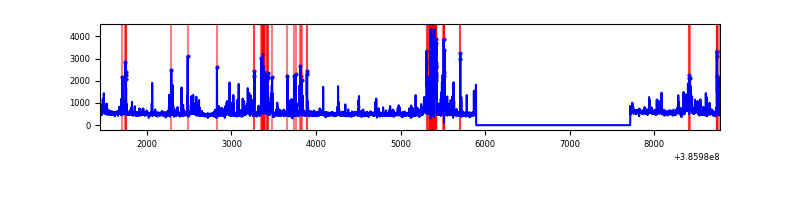 |
| C | 7333 | 5511 | 126 | 126 | 1.72% | 2.29% | 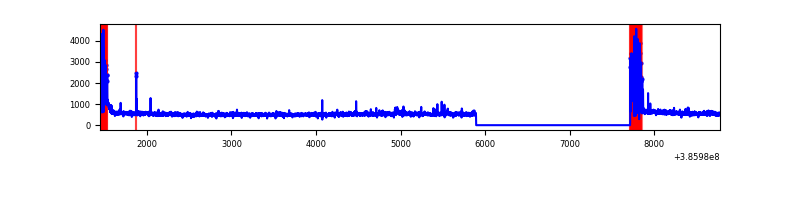 |
| D | 7333 | 5511 | 1039 | 1039 | 14.17% | 18.85% | 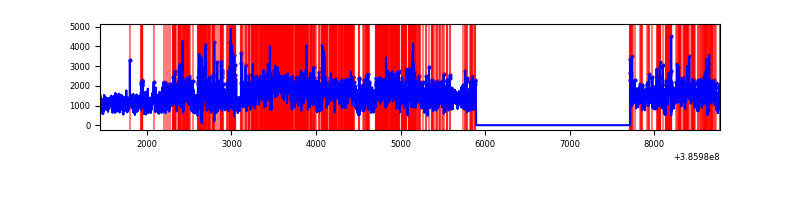 |
Top three noisy pixels from each quadrant. If the there are fewer than three noisy pixels in the level2.evt file, extra rows are filled as -1
| Pixel properties | Quadrant properties | ||||||
|---|---|---|---|---|---|---|---|
| Quadrant | DetID | PixID | Counts | Sigma | Mean | Median | Sigma |
| A | 10 | 83 | 83344 | 593.6 | 700 | 687 | 139.2 |
| A | 15 | 174 | 13603 | 92.76 | 700 | 687 | 139.2 |
| A | 13 | 254 | 9316 | 61.97 | 700 | 687 | 139.2 |
| B | 5 | 172 | 322093 | 2492.87 | 680 | 666 | 128.9 |
| B | 5 | 255 | 288576 | 2232.92 | 680 | 666 | 128.9 |
| B | 0 | 190 | 75390 | 579.53 | 680 | 666 | 128.9 |
| C | 0 | 10 | 423589 | 2794.64 | 659 | 664 | 151.3 |
| C | 15 | 214 | 229236 | 1510.38 | 659 | 664 | 151.3 |
| C | 14 | 67 | 32842 | 212.63 | 659 | 664 | 151.3 |
| D | 8 | 195 | 4801721 | 30390.9 | 645 | 626 | 158.0 |
| D | 7 | 80 | 682677 | 4317.38 | 645 | 626 | 158.0 |
| D | 2 | 250 | 197695 | 1247.45 | 645 | 626 | 158.0 |
Histogram calculated using DETX and DETY for each event in the final _common_clean file
| Quadrant A | 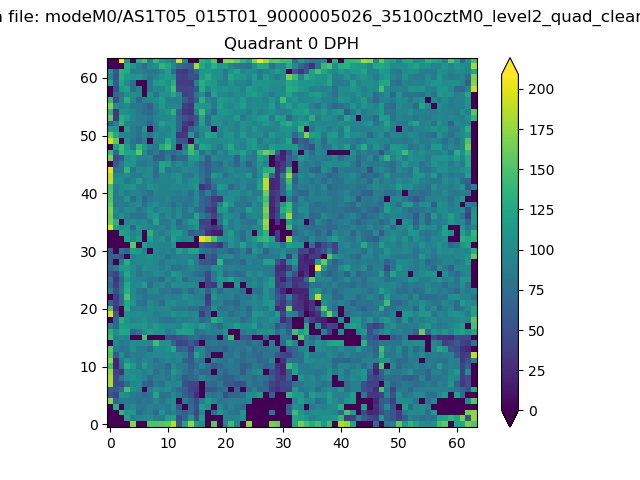 |
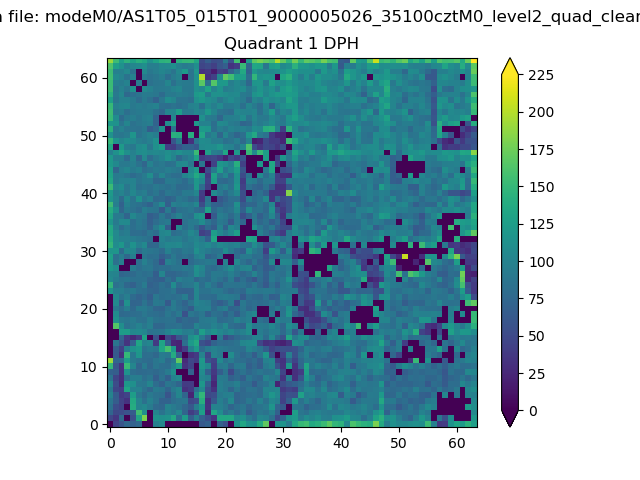 |
Quadrant B |
|---|---|---|---|
| Quadrant D | 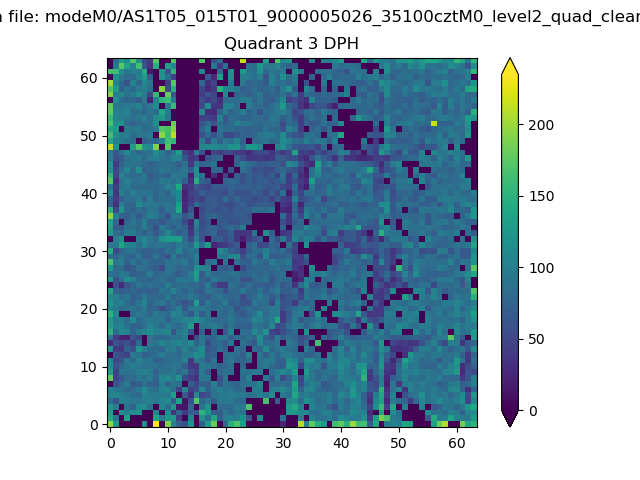 |
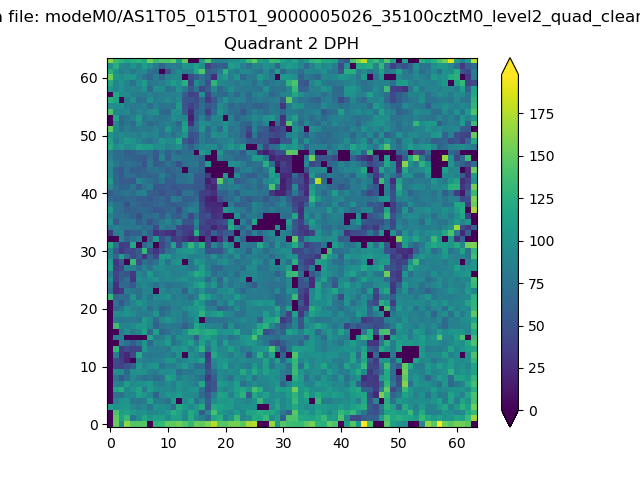 |
Quadrant C |
| Plot type | Count rate plots | Images |
|---|---|---|
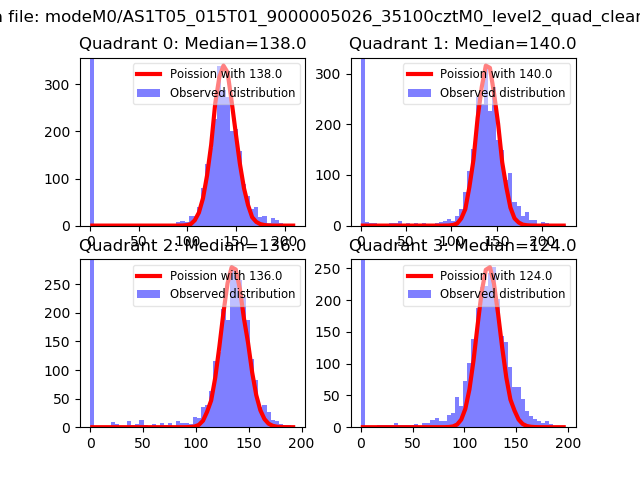
| Comparison with Poisson distribution Blue bars denote a histogram of data divided into 1 sec bins. Red curve is a Poisson curve with rate = median count rate of data. |
 |
 |
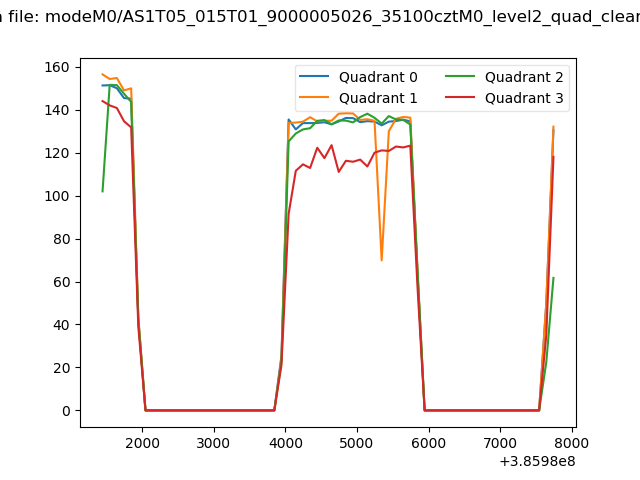
| Quadrant-wise count rates Data is divided into 100 sec bins |
 |
|
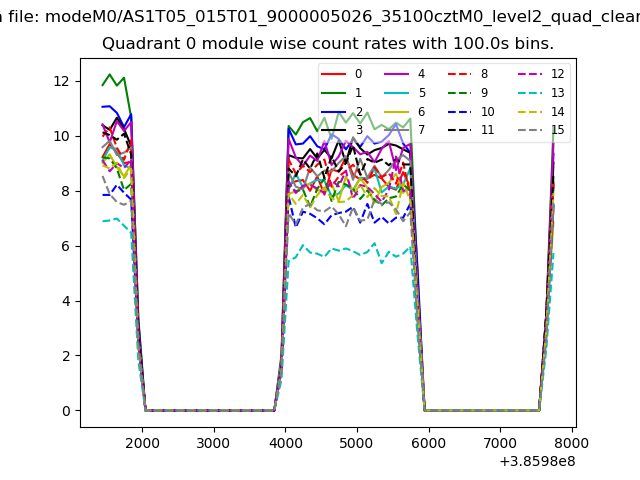
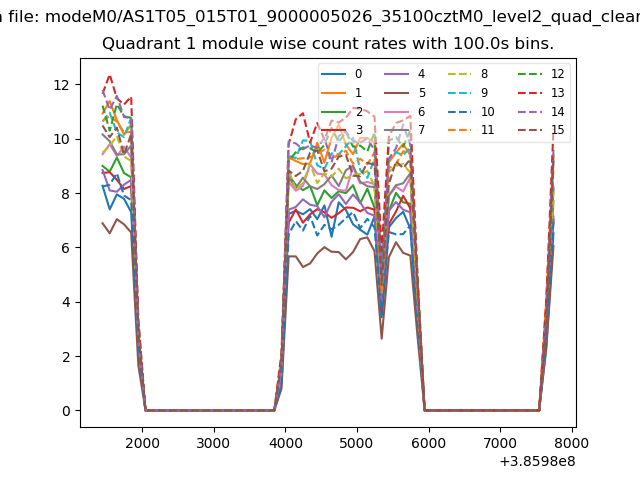
| Module-wise count rates for Quadrant A Data is divided into 100 sec bins |
 |
 |
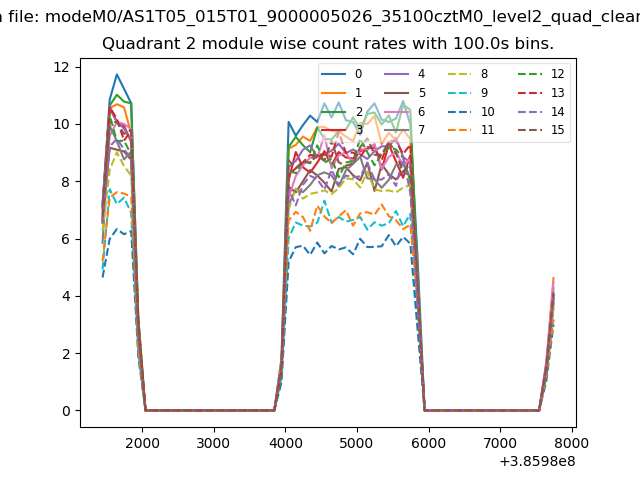
| Module-wise count rates for Quadrant B Data is divided into 100 sec bins |
 |
 |
| Module-wise count rates for Quadrant C Data is divided into 100 sec bins |
 |
 |
| Module-wise count rates for Quadrant D Data is divided into 100 sec bins |
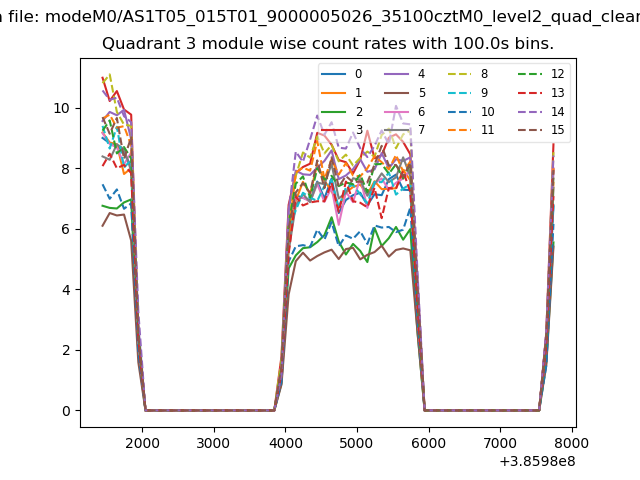 |
 |
| Parameter | Plot |
|---|---|
| CZT HV Monitor | 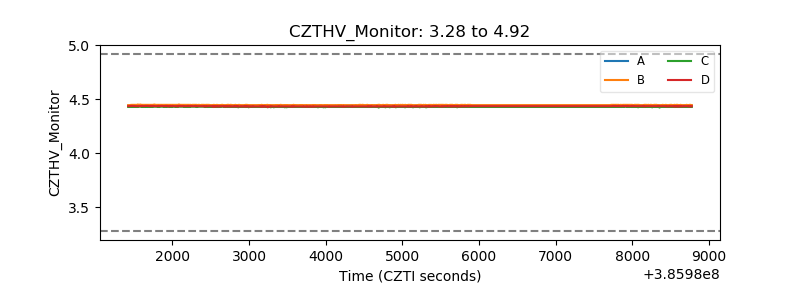 |
| D_VDD | 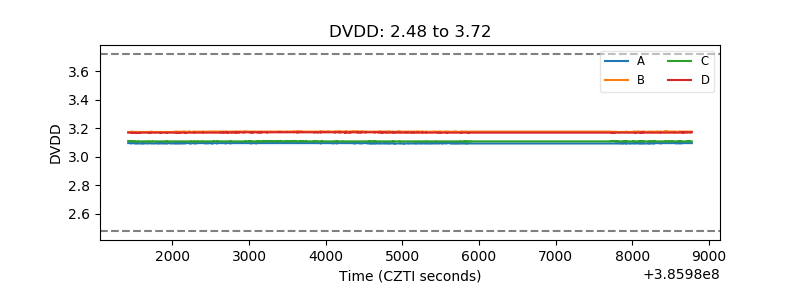 |
| Temperature 1 | 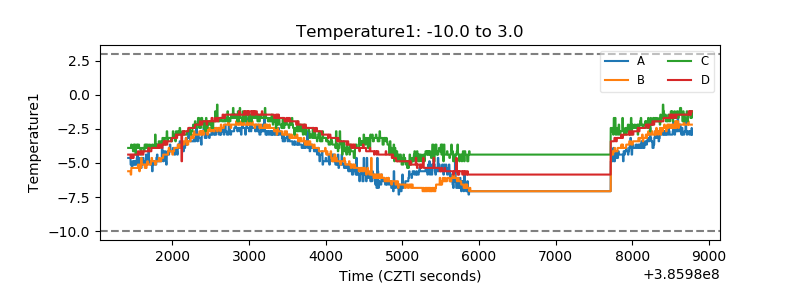 |
| Veto HV Monitor | 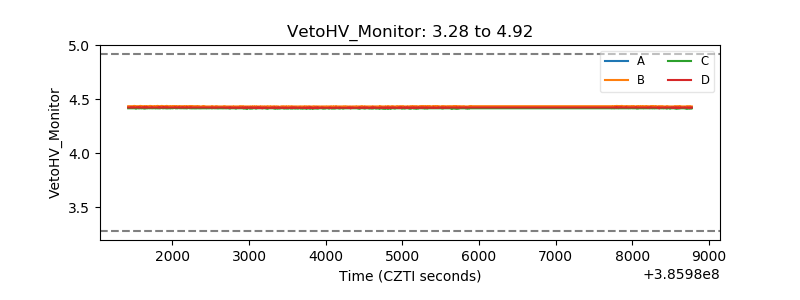 |
| Veto LLD | 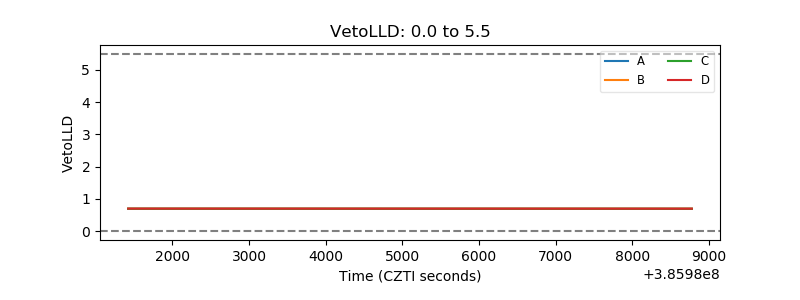 |
| Alpha Counter | 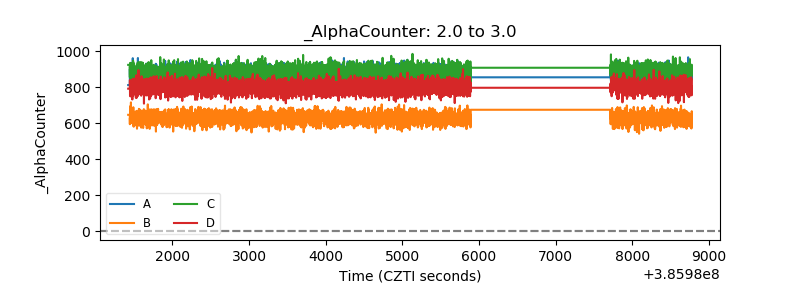 |
| _CPM_Rate | 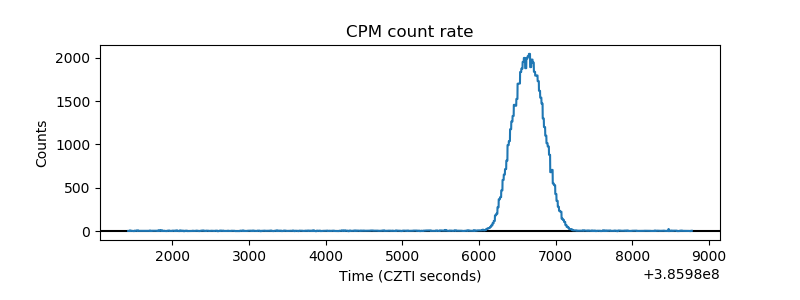 |
| CZT Counter | 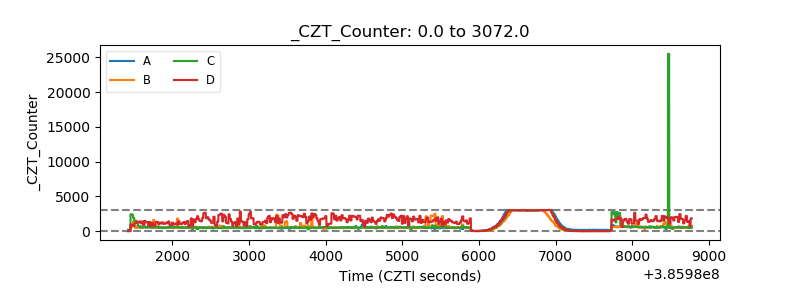 |
| +2.5 Volts monitor |  |
| +5 Volts monitor | 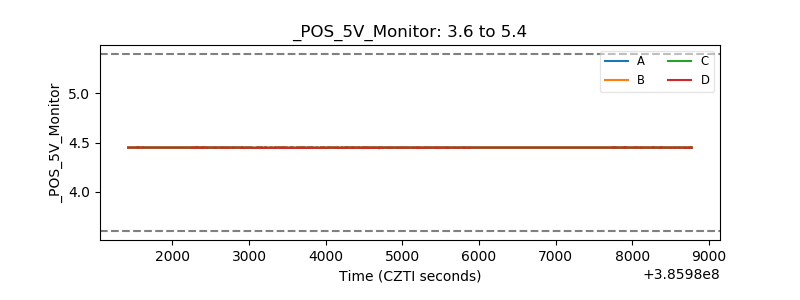 |
| _ROLL_ROT | 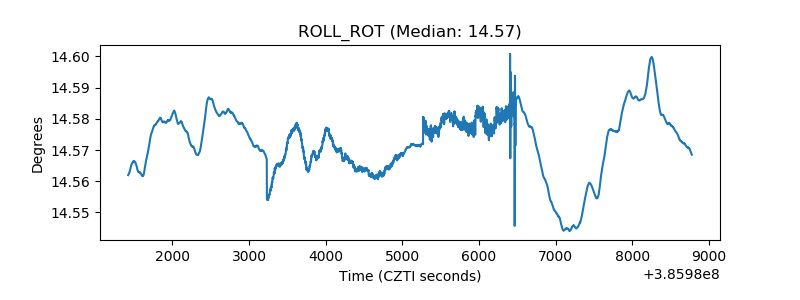 |
| _Roll_DEC | 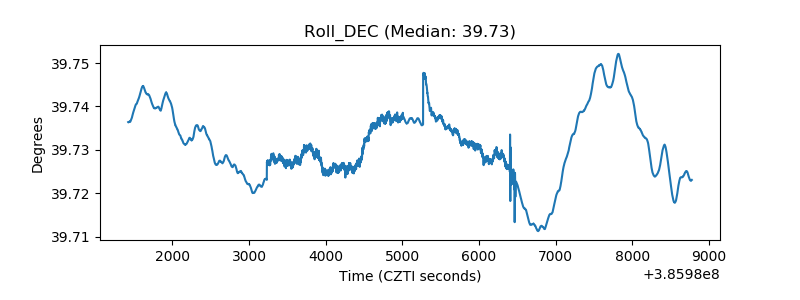 |
| _Roll_RA | 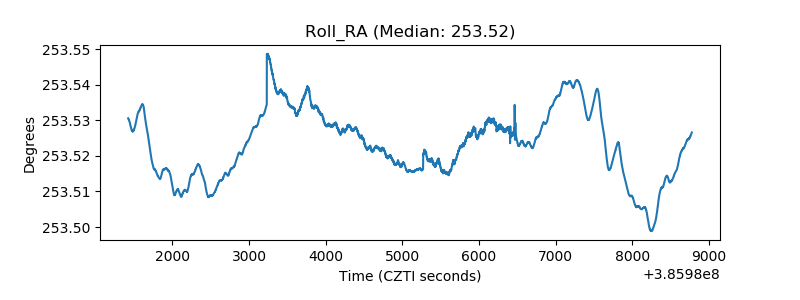 |
| Veto Counter | 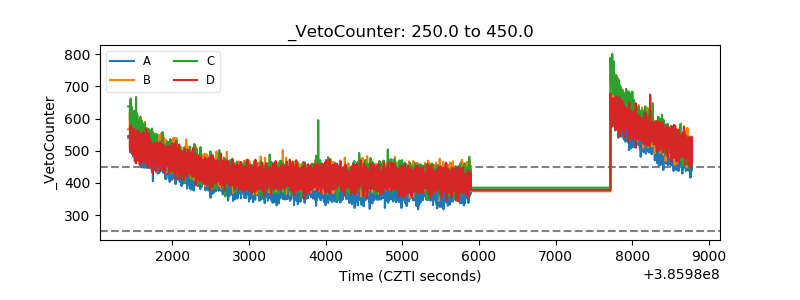 |