| Param | Original file | Final file |
|---|---|---|
| Filename | modeM0/AS1T05_015T01_9000005026_35098cztM0_level2.evt | modeM0/AS1T05_015T01_9000005026_35098cztM0_level2_quad_clean.evt |
| Size (bytes) | 554,546,880 | 64,920,960 |
| Size | 528.9 MB | 61.9 MB |
| Events in quadrant A | 2,592,937 | 407,719 |
| Events in quadrant B | 3,191,087 | 415,622 |
| Events in quadrant C | 3,085,387 | 402,564 |
| Events in quadrant D | 7,564,724 | 366,471 |
| Mode SS | |||
|---|---|---|---|
| Quadrant | BADHDUFLAG | Total packets | Discarded packets |
| A | 0 | 108 | 0 |
| B | 0 | 108 | 0 |
| C | 0 | 108 | 0 |
| D | 0 | 108 | 0 |
| Mode M9 | |||
|---|---|---|---|
| Quadrant | BADHDUFLAG | Total packets | Discarded packets |
| A | 0 | 20 | 0 |
| B | 0 | 20 | 0 |
| C | 0 | 20 | 0 |
| D | 0 | 21 | 0 |
| Mode M0 | |||
|---|---|---|---|
| Quadrant | BADHDUFLAG | Total packets | Discarded packets |
| A | 0 | 10981 | 3 |
| B | 0 | 12748 | 2 |
| C | 0 | 12155 | 2 |
| D | 0 | 26202 | 2 |
| Quadrant | Total seconds | Saturated seconds | Saturation percentage |
|---|---|---|---|
| A | 5332 | 6 | 0.112528% |
| B | 5332 | 148 | 2.775694% |
| C | 5332 | 116 | 2.175544% |
| D | 5332 | 759 | 14.234809% |
Noise dominated data is calculated using 1-second bins in cleaned event files. If a bin has >2000 counts, and if more than 50% of those come from <1% of pixels, then it is considered to be noise-dominated and hence unusable.
| Quadrant | # 1 sec bins | Bins with >0 counts | Bins with >2000 counts | High rate bins dominated by noise | Noise dominated (total time) | Noise dominated (detector-on time) | Marked lightcurve |
|---|---|---|---|---|---|---|---|
| A | 7036 | 5334 | 0 | 0 | 0.00% | 0.00% | 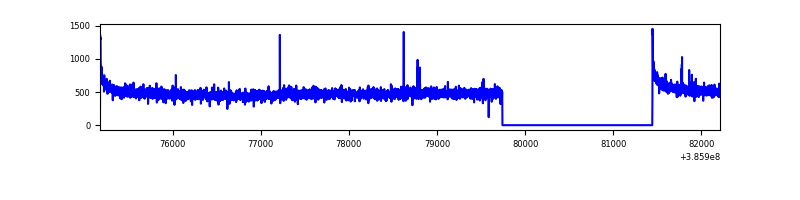 |
| B | 7036 | 5334 | 94 | 94 | 1.34% | 1.76% |  |
| C | 7036 | 5334 | 91 | 91 | 1.29% | 1.71% | 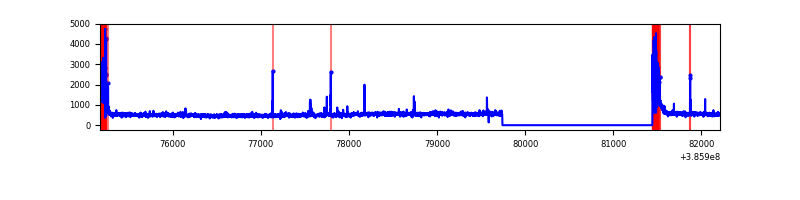 |
| D | 7036 | 5334 | 682 | 682 | 9.69% | 12.79% | 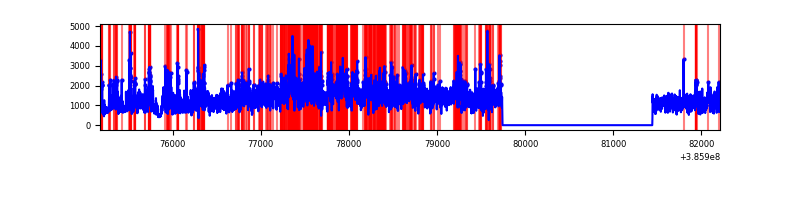 |
Top three noisy pixels from each quadrant. If the there are fewer than three noisy pixels in the level2.evt file, extra rows are filled as -1
| Pixel properties | Quadrant properties | ||||||
|---|---|---|---|---|---|---|---|
| Quadrant | DetID | PixID | Counts | Sigma | Mean | Median | Sigma |
| A | 10 | 83 | 83155 | 636.06 | 644 | 632 | 129.7 |
| A | 13 | 254 | 9183 | 65.91 | 644 | 632 | 129.7 |
| A | 13 | 6 | 7150 | 50.24 | 644 | 632 | 129.7 |
| B | 5 | 172 | 508545 | 4165.73 | 630 | 612 | 121.9 |
| B | 5 | 255 | 135535 | 1106.55 | 630 | 612 | 121.9 |
| B | 15 | 85 | 22312 | 177.97 | 630 | 612 | 121.9 |
| C | 0 | 10 | 326179 | 2281.42 | 614 | 617 | 142.7 |
| C | 15 | 214 | 223915 | 1564.79 | 614 | 617 | 142.7 |
| C | 10 | 49 | 51064 | 353.51 | 614 | 617 | 142.7 |
| D | 8 | 195 | 3391317 | 23156.92 | 597 | 581 | 146.4 |
| D | 7 | 80 | 1266961 | 8648.7 | 597 | 581 | 146.4 |
| D | 2 | 250 | 161330 | 1097.83 | 597 | 581 | 146.4 |
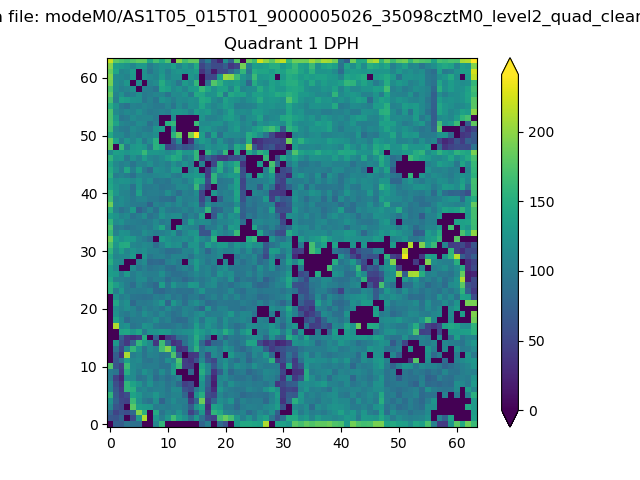
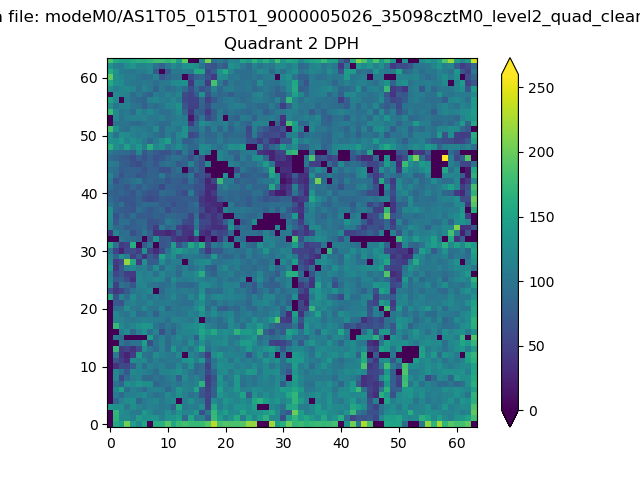
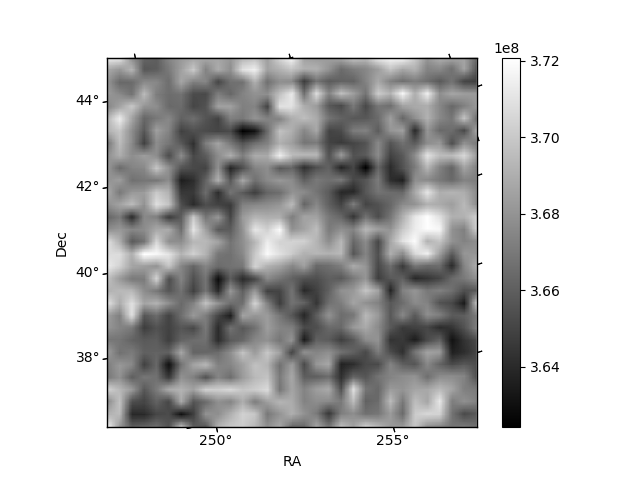
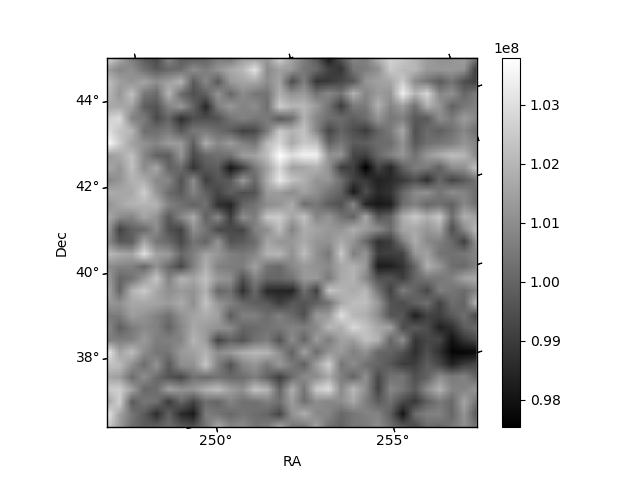
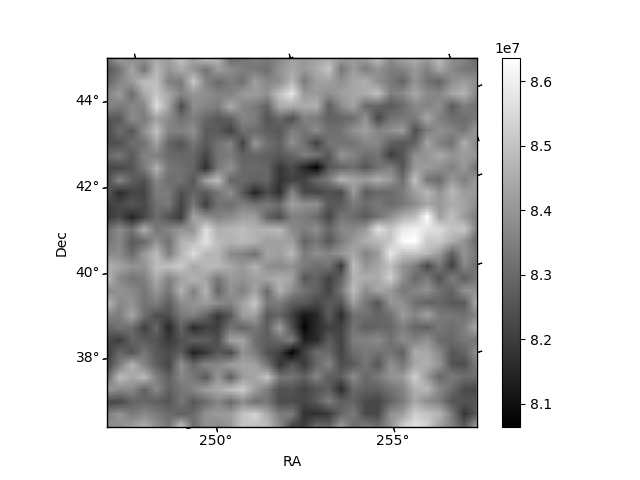
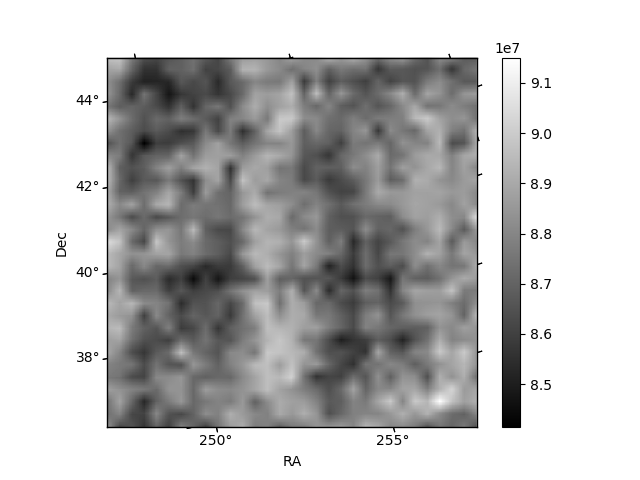
Histogram calculated using DETX and DETY for each event in the final _common_clean file
| Quadrant A | 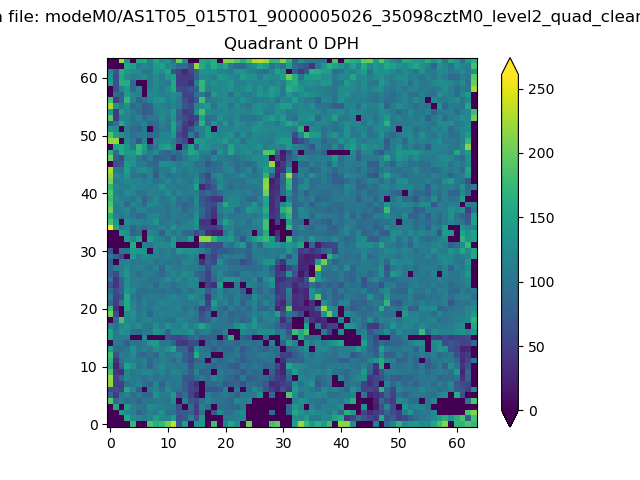 |
 |
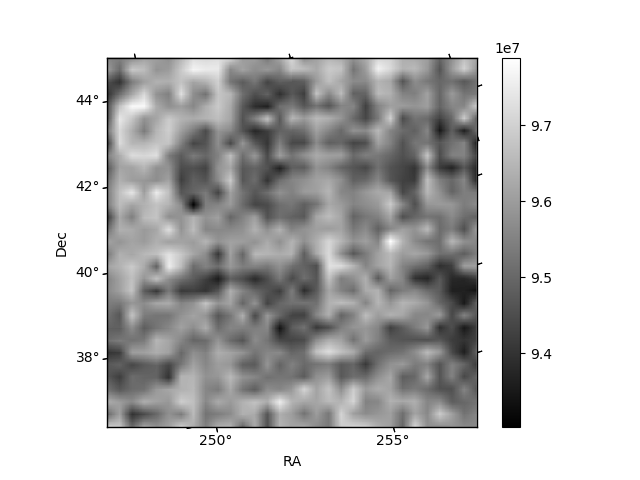
Quadrant B |
|---|---|---|---|
| Quadrant D | 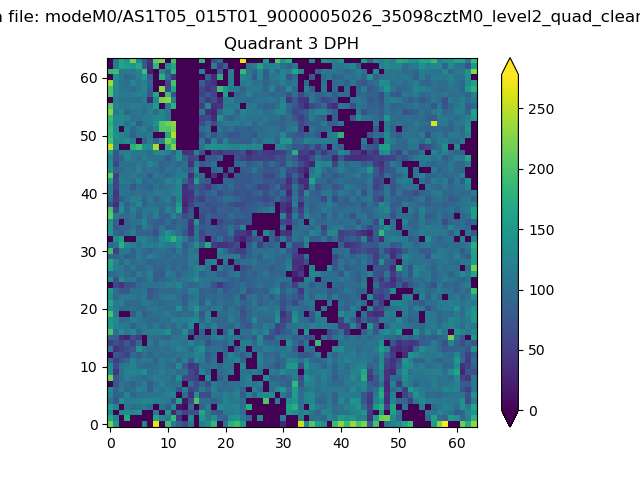 |
 |
Quadrant C |
| Plot type | Count rate plots | Images |
|---|---|---|
| Comparison with Poisson distribution Blue bars denote a histogram of data divided into 1 sec bins. Red curve is a Poisson curve with rate = median count rate of data. |
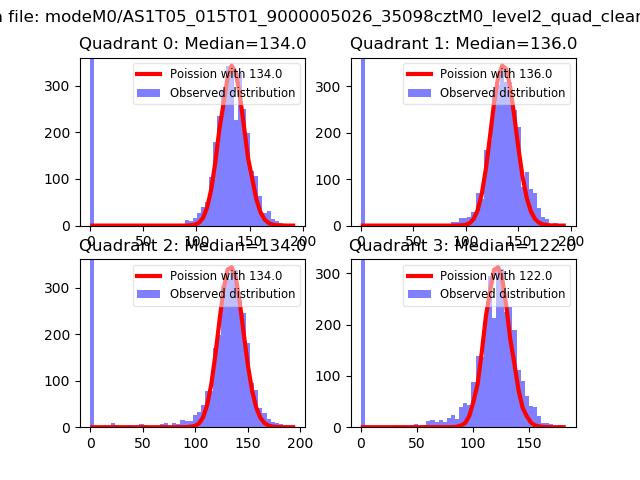 |
 |
| Quadrant-wise count rates Data is divided into 100 sec bins |
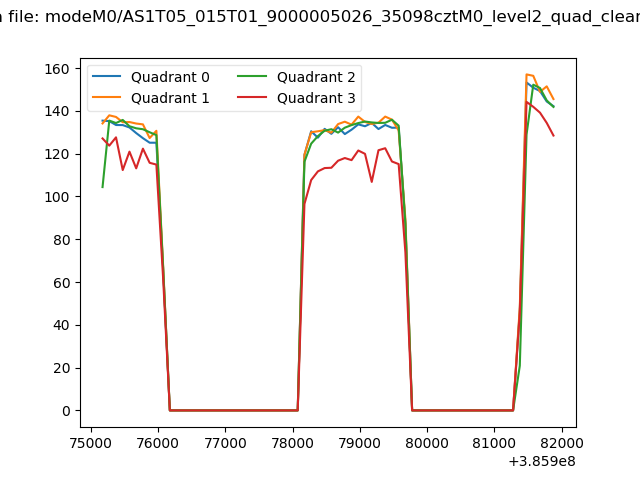 |
|
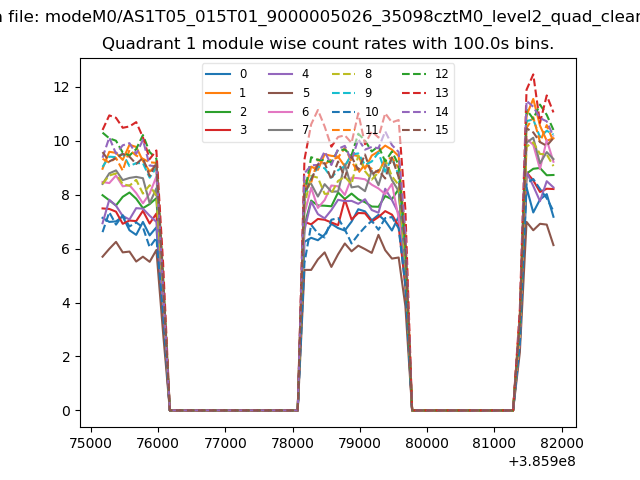
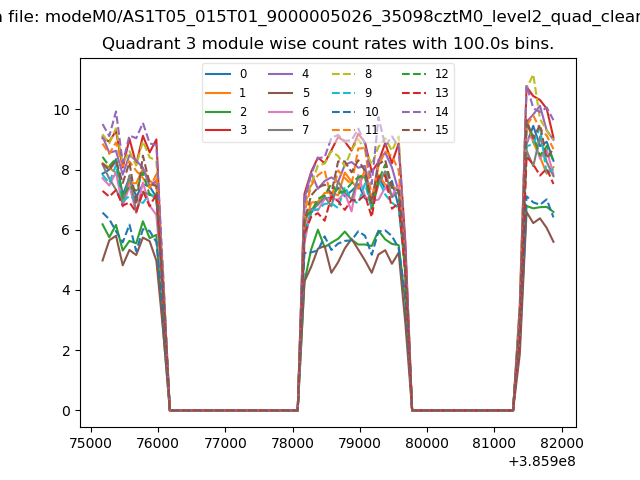
| Module-wise count rates for Quadrant A Data is divided into 100 sec bins |
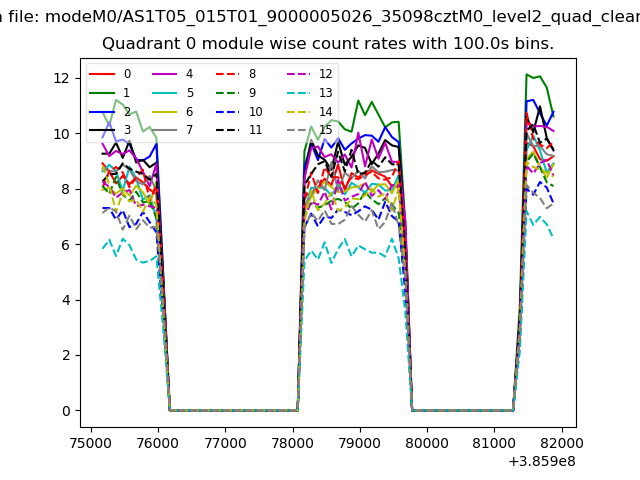 |
 |
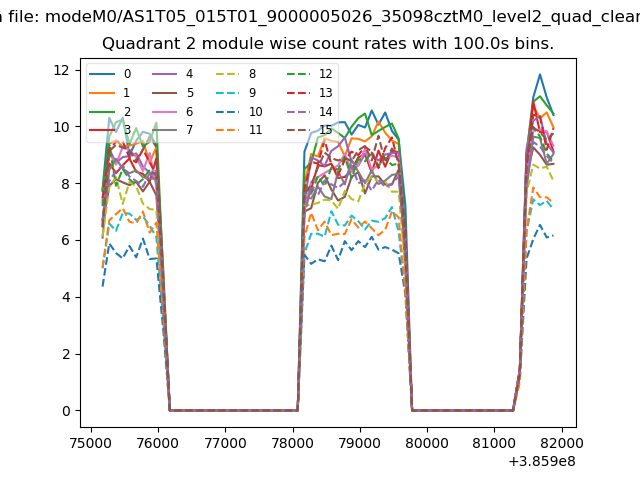
| Module-wise count rates for Quadrant B Data is divided into 100 sec bins |
 |
 |
| Module-wise count rates for Quadrant C Data is divided into 100 sec bins |
 |
 |
| Module-wise count rates for Quadrant D Data is divided into 100 sec bins |
 |
 |
| Parameter | Plot |
|---|---|
| CZT HV Monitor | 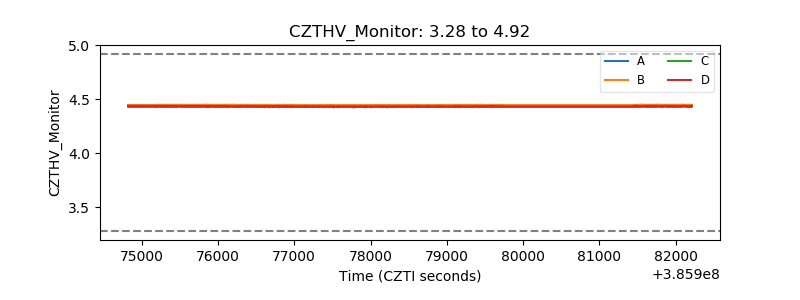 |
| D_VDD | 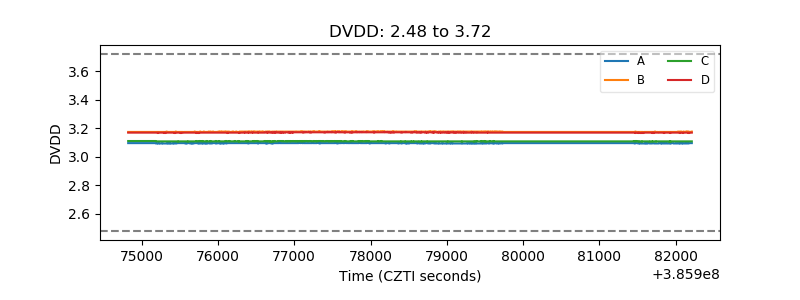 |
| Temperature 1 | 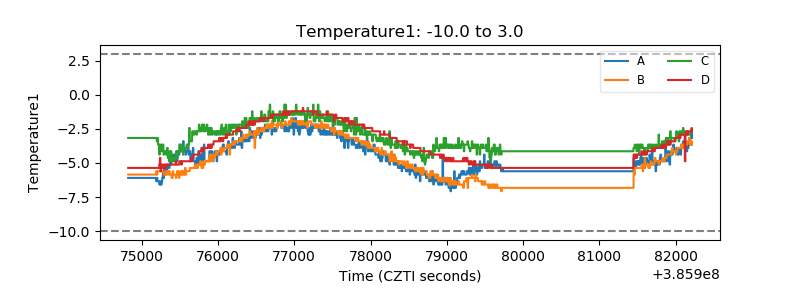 |
| Veto HV Monitor | 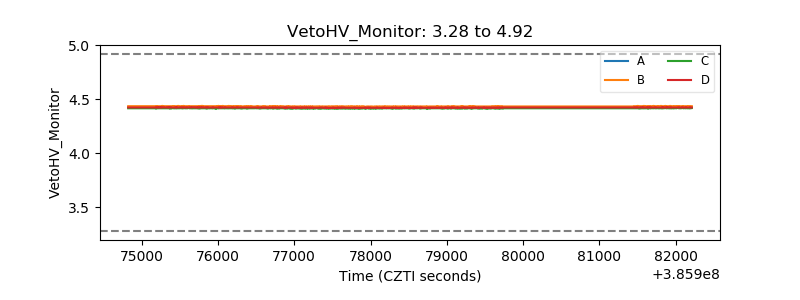 |
| Veto LLD | 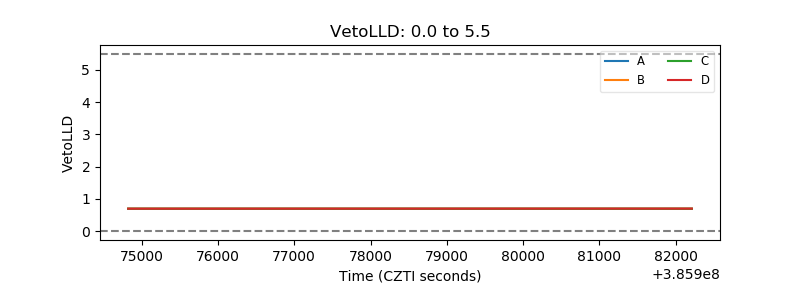 |
| Alpha Counter | 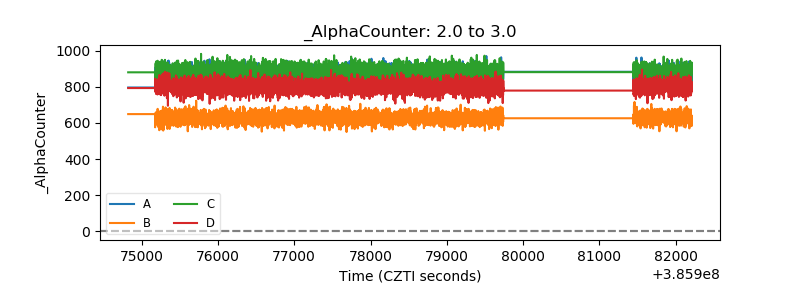 |
| _CPM_Rate | 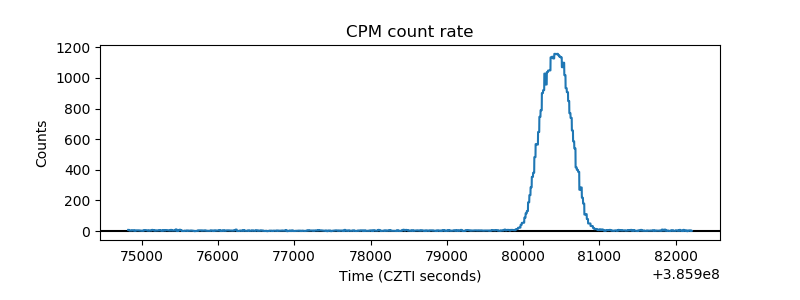 |
| CZT Counter | 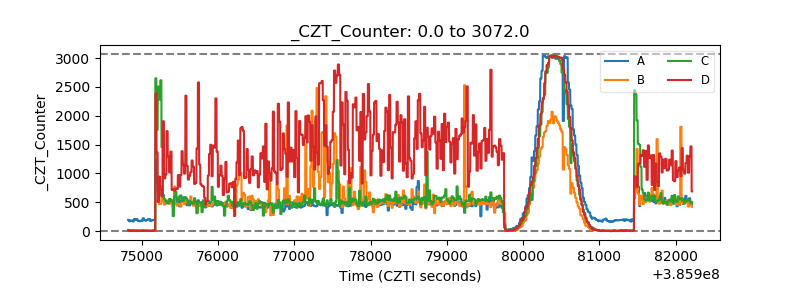 |
| +2.5 Volts monitor | 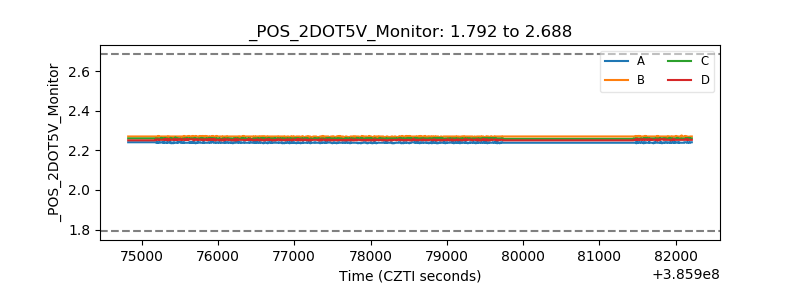 |
| +5 Volts monitor | 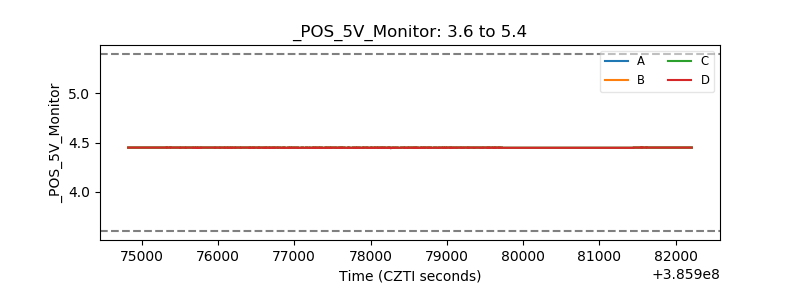 |
| _ROLL_ROT | 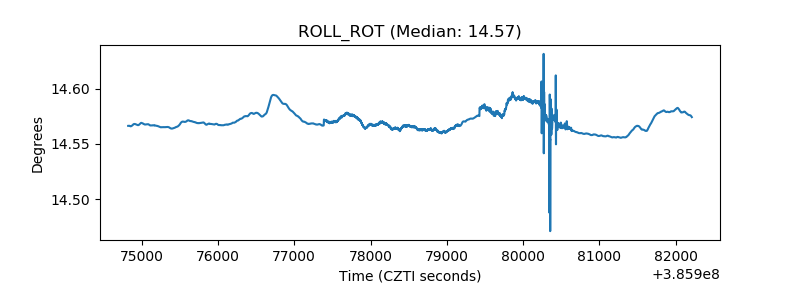 |
| _Roll_DEC | 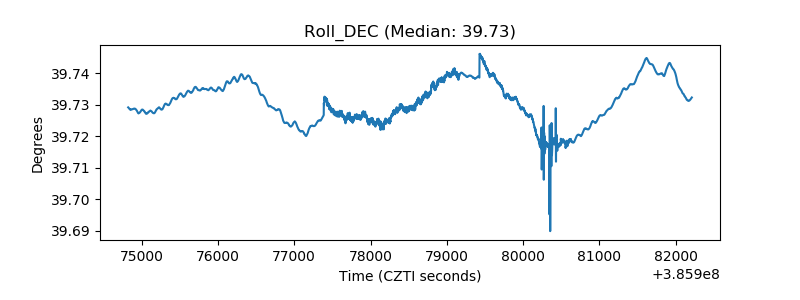 |
| _Roll_RA | 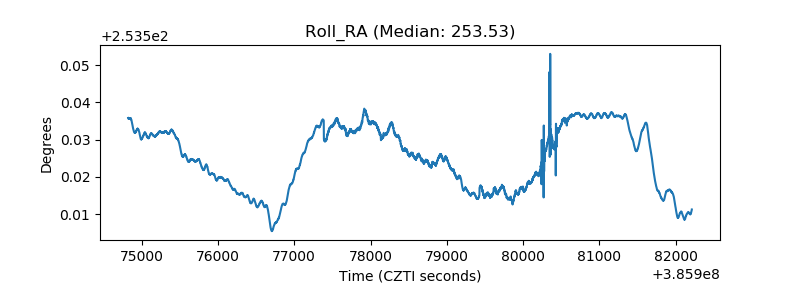 |
| Veto Counter | 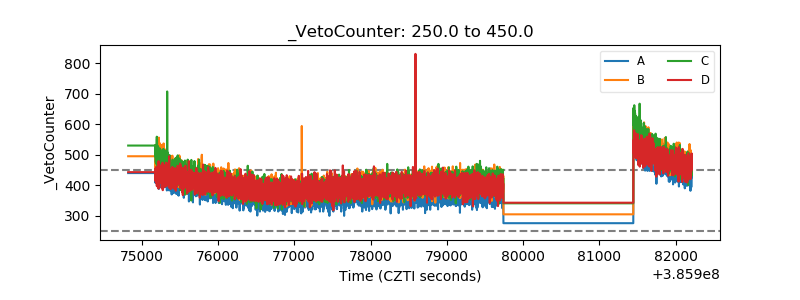 |