| Param | Original file | Final file |
|---|---|---|
| Filename | modeM0/AS1T05_015T01_9000005026_35097cztM0_level2.evt | modeM0/AS1T05_015T01_9000005026_35097cztM0_level2_quad_clean.evt |
| Size (bytes) | 571,248,000 | 68,310,720 |
| Size | 544.8 MB | 65.1 MB |
| Events in quadrant A | 2,567,049 | 433,493 |
| Events in quadrant B | 2,947,187 | 442,880 |
| Events in quadrant C | 3,166,591 | 433,799 |
| Events in quadrant D | 8,249,477 | 375,078 |
| Mode SS | |||
|---|---|---|---|
| Quadrant | BADHDUFLAG | Total packets | Discarded packets |
| A | 0 | 110 | 0 |
| B | 0 | 110 | 0 |
| C | 0 | 110 | 0 |
| D | 0 | 110 | 0 |
| Mode M9 | |||
|---|---|---|---|
| Quadrant | BADHDUFLAG | Total packets | Discarded packets |
| A | 0 | 15 | 0 |
| B | 0 | 15 | 0 |
| C | 0 | 15 | 0 |
| D | 0 | 15 | 0 |
| Mode M0 | |||
|---|---|---|---|
| Quadrant | BADHDUFLAG | Total packets | Discarded packets |
| A | 0 | 11099 | 2 |
| B | 0 | 12142 | 5 |
| C | 0 | 12608 | 1 |
| D | 0 | 28326 | 1 |
| Quadrant | Total seconds | Saturated seconds | Saturation percentage |
|---|---|---|---|
| A | 5468 | 8 | 0.146306% |
| B | 5466 | 36 | 0.658617% |
| C | 5468 | 83 | 1.517922% |
| D | 5468 | 1124 | 20.555962% |
Noise dominated data is calculated using 1-second bins in cleaned event files. If a bin has >2000 counts, and if more than 50% of those come from <1% of pixels, then it is considered to be noise-dominated and hence unusable.
| Quadrant | # 1 sec bins | Bins with >0 counts | Bins with >2000 counts | High rate bins dominated by noise | Noise dominated (total time) | Noise dominated (detector-on time) | Marked lightcurve |
|---|---|---|---|---|---|---|---|
| A | 7021 | 5469 | 1 | 1 | 0.01% | 0.02% | 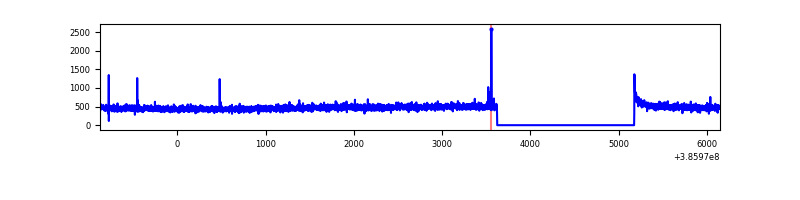 |
| B | 7021 | 5468 | 13 | 13 | 0.19% | 0.24% | 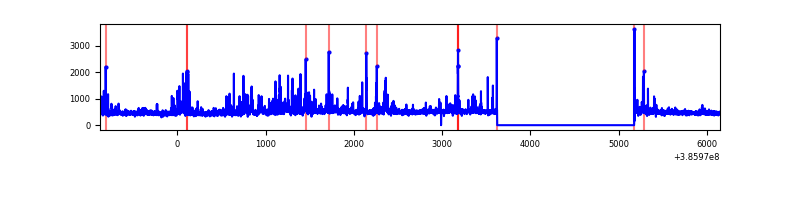 |
| C | 7021 | 5469 | 76 | 76 | 1.08% | 1.39% | 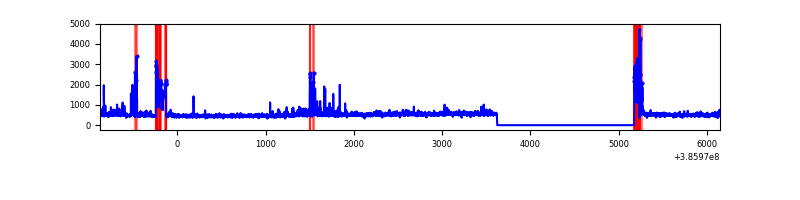 |
| D | 7021 | 5469 | 1014 | 1014 | 14.44% | 18.54% | 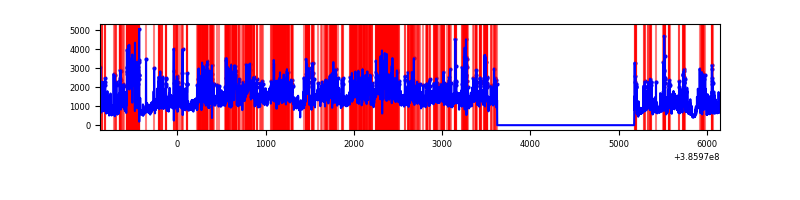 |
Top three noisy pixels from each quadrant. If the there are fewer than three noisy pixels in the level2.evt file, extra rows are filled as -1
| Pixel properties | Quadrant properties | ||||||
|---|---|---|---|---|---|---|---|
| Quadrant | DetID | PixID | Counts | Sigma | Mean | Median | Sigma |
| A | 10 | 83 | 59814 | 452.05 | 644 | 630 | 130.9 |
| A | 7 | 16 | 11529 | 83.24 | 644 | 630 | 130.9 |
| A | 13 | 254 | 9047 | 64.29 | 644 | 630 | 130.9 |
| B | 5 | 172 | 246056 | 1976.02 | 638 | 620 | 124.2 |
| B | 5 | 255 | 89160 | 712.84 | 638 | 620 | 124.2 |
| B | 0 | 245 | 73503 | 586.79 | 638 | 620 | 124.2 |
| C | 0 | 10 | 265178 | 1846.02 | 619 | 625 | 143.3 |
| C | 15 | 214 | 227272 | 1581.52 | 619 | 625 | 143.3 |
| C | 10 | 49 | 213580 | 1485.98 | 619 | 625 | 143.3 |
| D | 8 | 195 | 3188910 | 22176.03 | 582 | 564 | 143.8 |
| D | 7 | 80 | 1635282 | 11370.02 | 582 | 564 | 143.8 |
| D | 2 | 249 | 486651 | 3380.9 | 582 | 564 | 143.8 |
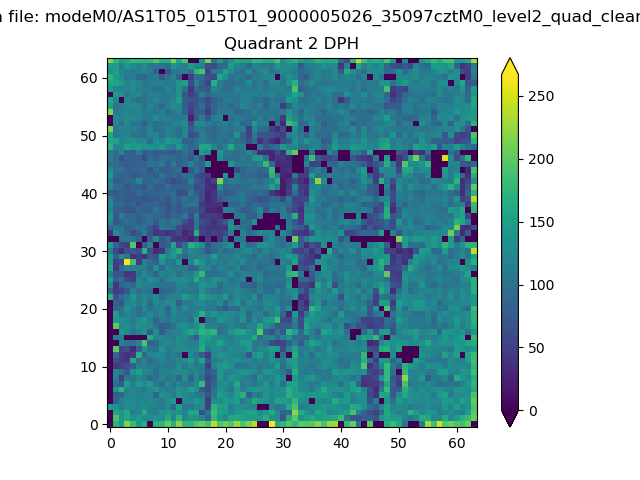
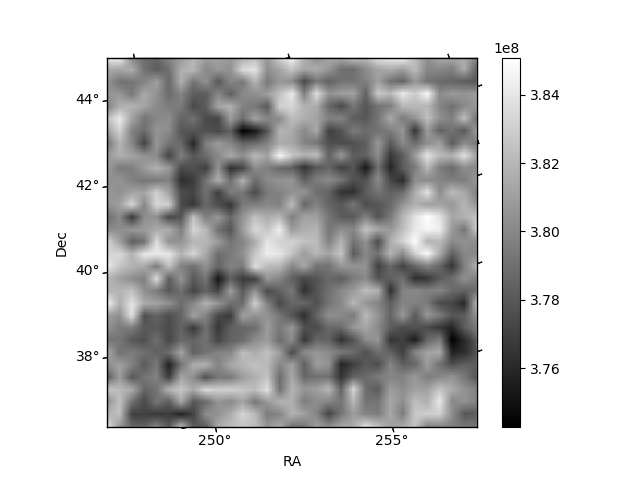
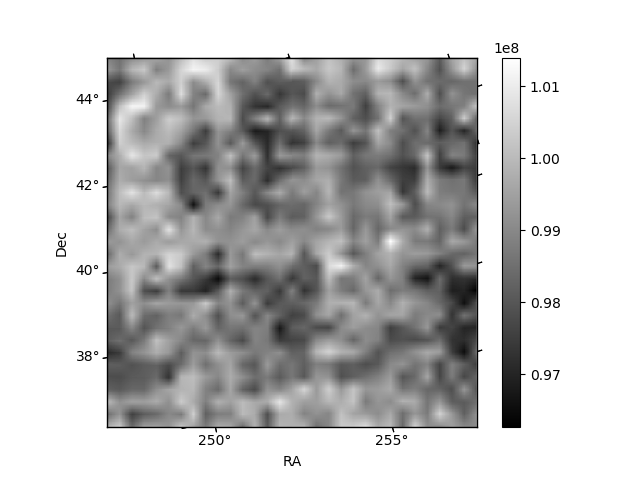
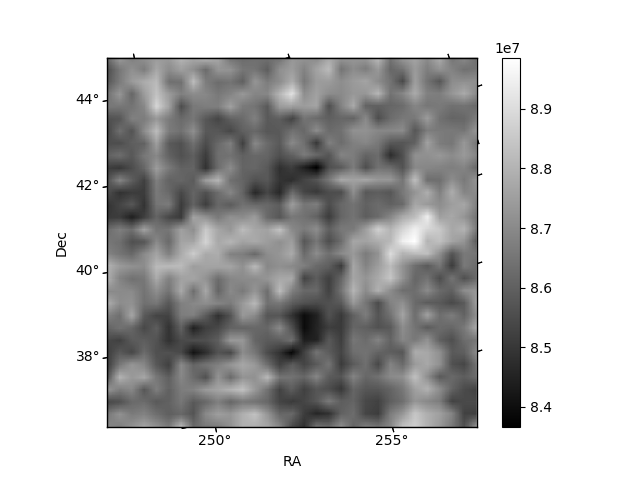
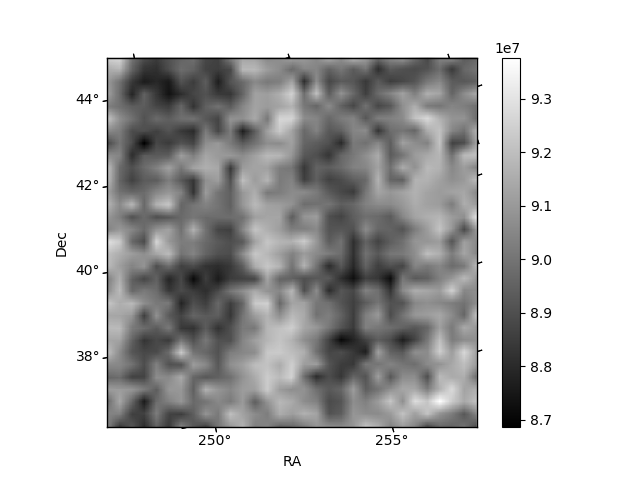
Histogram calculated using DETX and DETY for each event in the final _common_clean file
| Quadrant A | 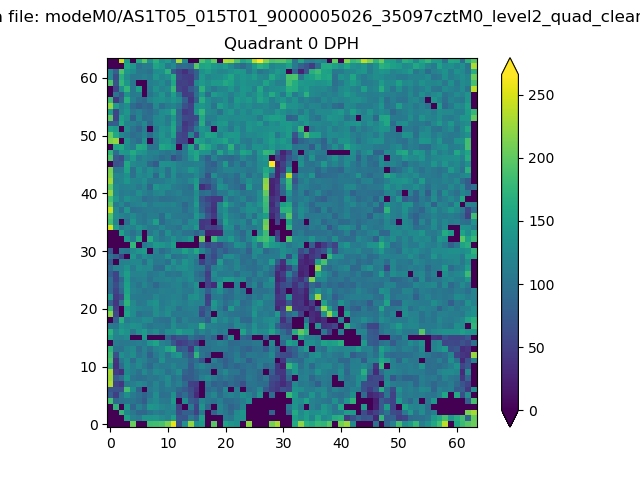 |
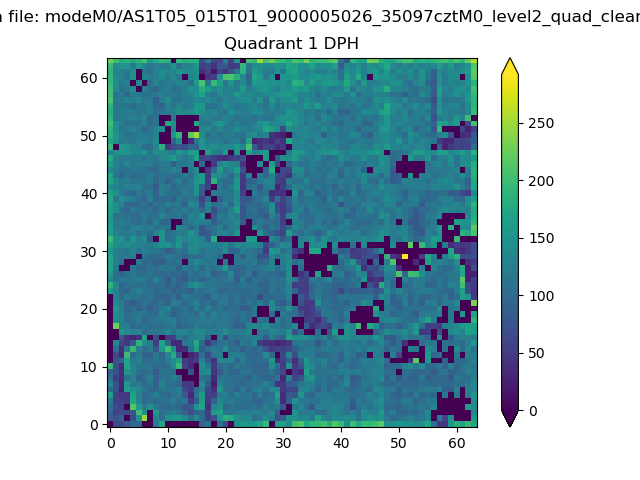 |
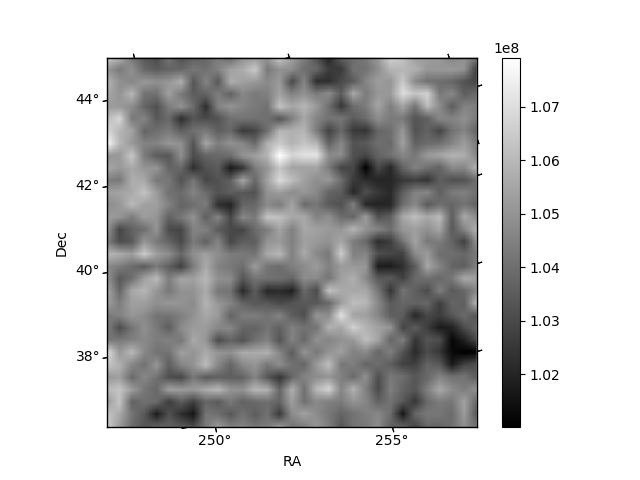
Quadrant B |
|---|---|---|---|
| Quadrant D | 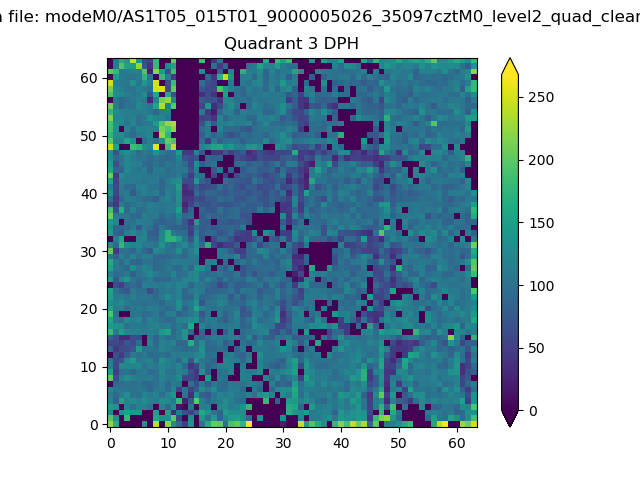 |
 |
Quadrant C |
| Plot type | Count rate plots | Images |
|---|---|---|
| Comparison with Poisson distribution Blue bars denote a histogram of data divided into 1 sec bins. Red curve is a Poisson curve with rate = median count rate of data. |
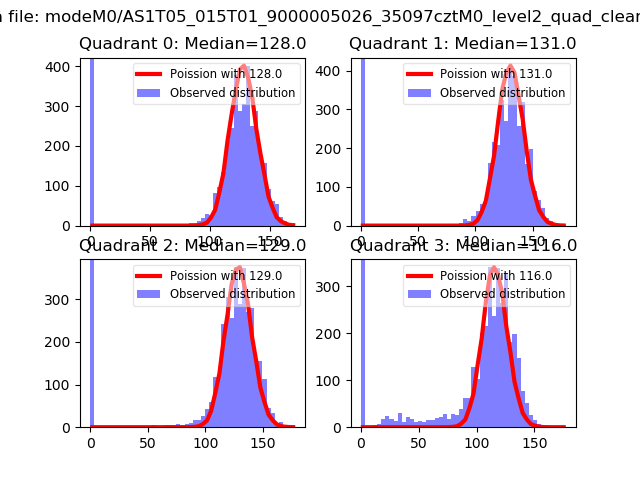 |
 |
| Quadrant-wise count rates Data is divided into 100 sec bins |
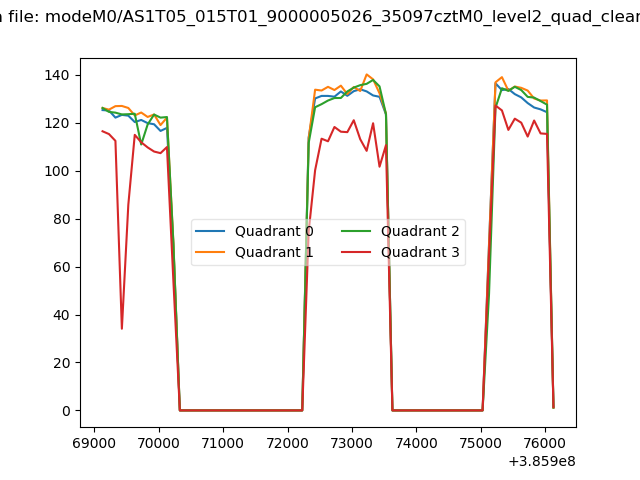 |
|
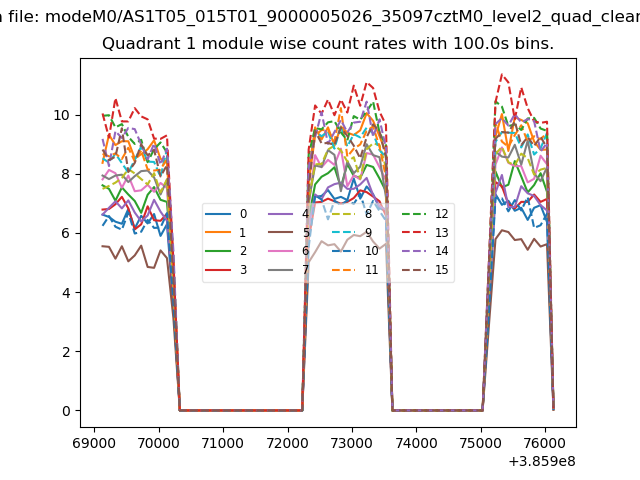
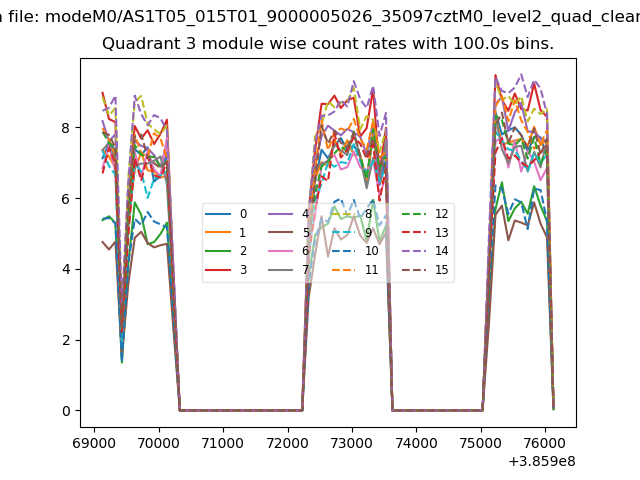
| Module-wise count rates for Quadrant A Data is divided into 100 sec bins |
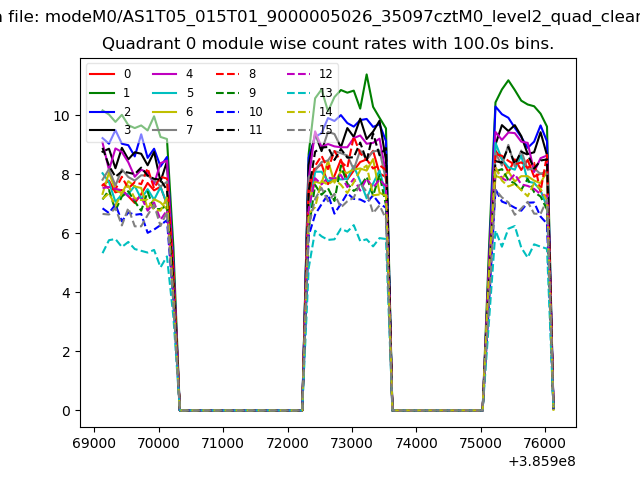 |
 |
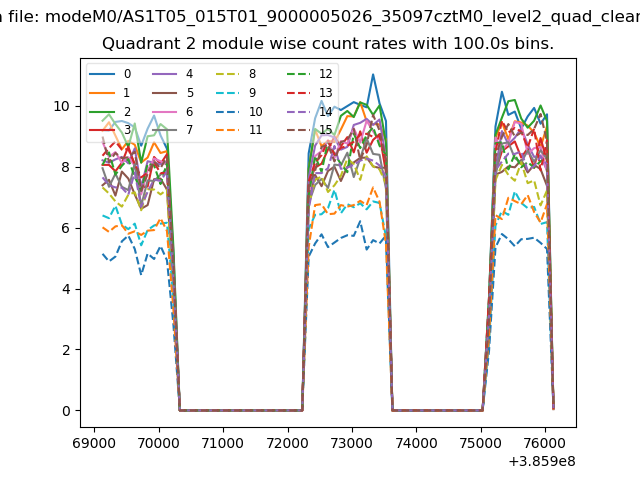
| Module-wise count rates for Quadrant B Data is divided into 100 sec bins |
 |
 |
| Module-wise count rates for Quadrant C Data is divided into 100 sec bins |
 |
 |
| Module-wise count rates for Quadrant D Data is divided into 100 sec bins |
 |
 |
| Parameter | Plot |
|---|---|
| CZT HV Monitor | 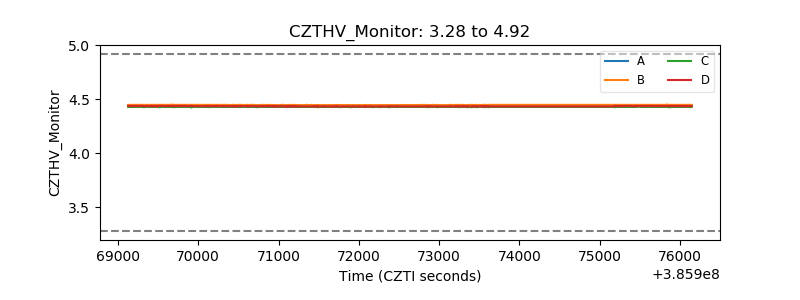 |
| D_VDD | 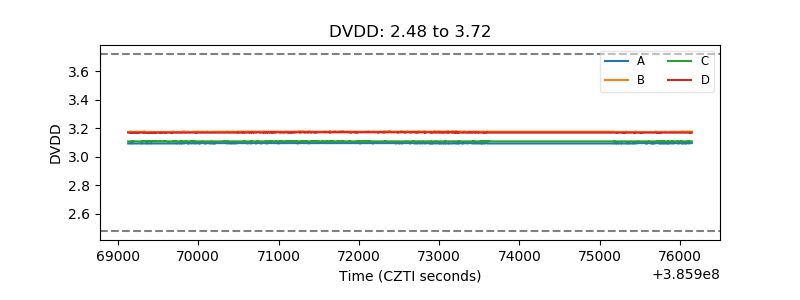 |
| Temperature 1 | 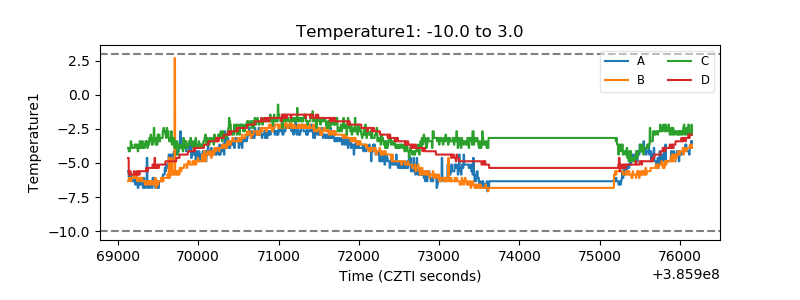 |
| Veto HV Monitor | 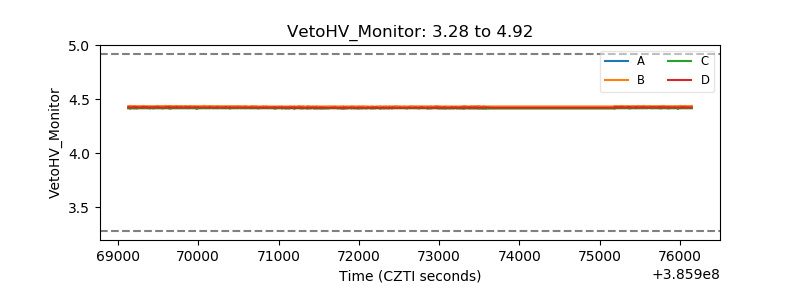 |
| Veto LLD | 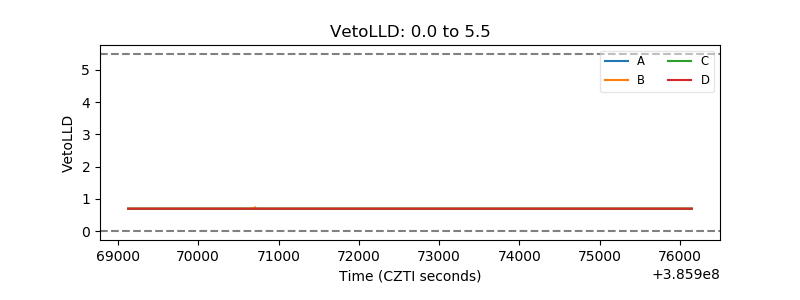 |
| Alpha Counter | 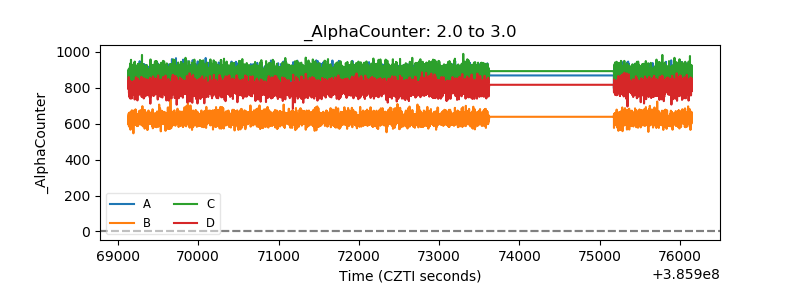 |
| _CPM_Rate | 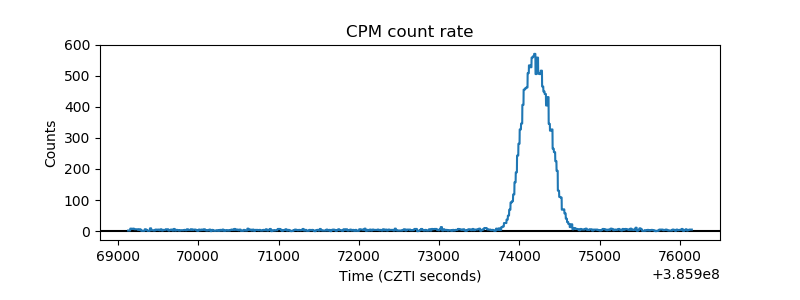 |
| CZT Counter | 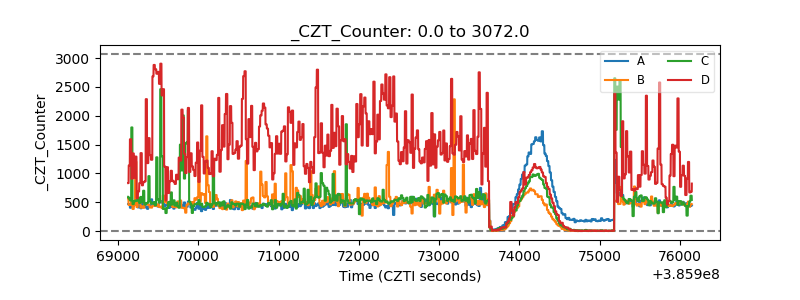 |
| +2.5 Volts monitor | 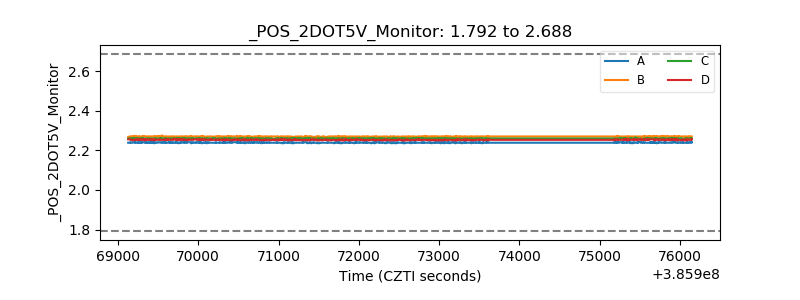 |
| +5 Volts monitor | 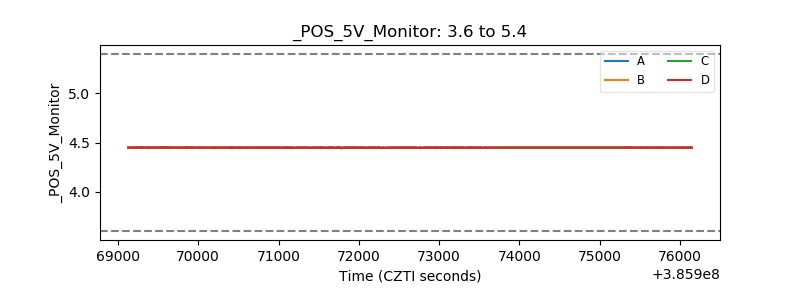 |
| _ROLL_ROT | 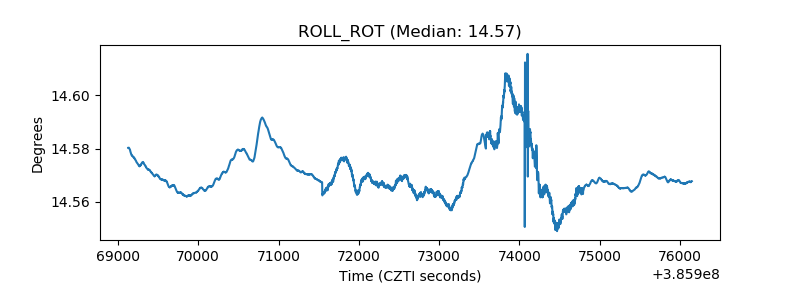 |
| _Roll_DEC | 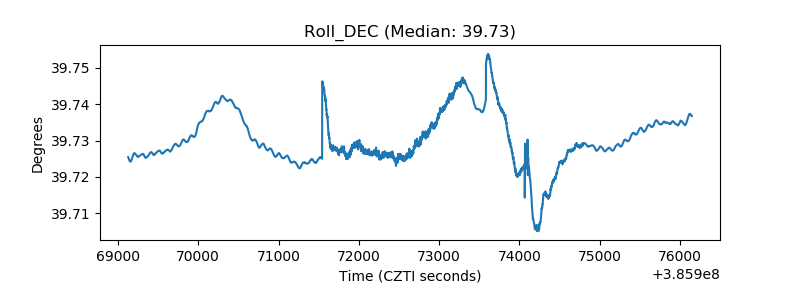 |
| _Roll_RA | 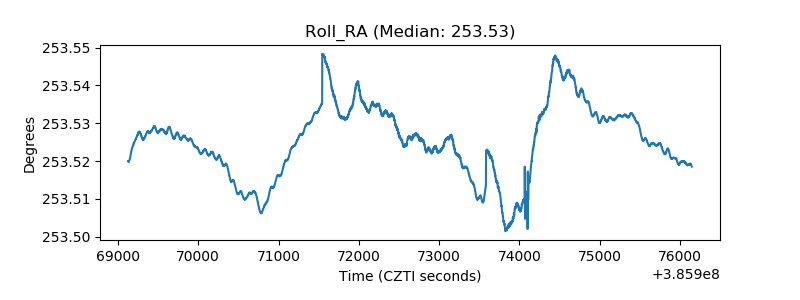 |
| Veto Counter | 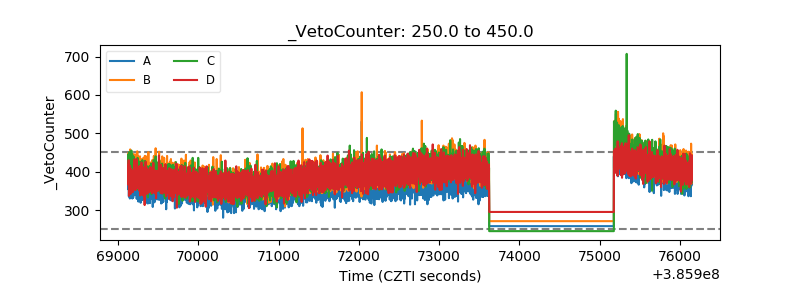 |