| Param | Original file | Final file |
|---|---|---|
| Filename | modeM0/AS1T05_015T01_9000005026_35096cztM0_level2.evt | modeM0/AS1T05_015T01_9000005026_35096cztM0_level2_quad_clean.evt |
| Size (bytes) | 1,099,679,040 | 130,674,240 |
| Size | 1.0 GB | 124.6 MB |
| Events in quadrant A | 5,064,796 | 823,792 |
| Events in quadrant B | 6,017,381 | 836,569 |
| Events in quadrant C | 6,307,936 | 824,069 |
| Events in quadrant D | 15,186,876 | 725,280 |
| Mode SS | |||
|---|---|---|---|
| Quadrant | BADHDUFLAG | Total packets | Discarded packets |
| A | 0 | 220 | 0 |
| B | 0 | 220 | 0 |
| C | 0 | 220 | 0 |
| D | 0 | 220 | 0 |
| Mode M9 | |||
|---|---|---|---|
| Quadrant | BADHDUFLAG | Total packets | Discarded packets |
| A | 0 | 28 | 0 |
| B | 0 | 28 | 0 |
| C | 0 | 28 | 0 |
| D | 0 | 29 | 0 |
| Mode M0 | |||
|---|---|---|---|
| Quadrant | BADHDUFLAG | Total packets | Discarded packets |
| A | 0 | 21995 | 4 |
| B | 0 | 24880 | 3 |
| C | 0 | 25263 | 3 |
| D | 0 | 52680 | 3 |
| Quadrant | Total seconds | Saturated seconds | Saturation percentage |
|---|---|---|---|
| A | 10793 | 24 | 0.222366% |
| B | 10793 | 140 | 1.297137% |
| C | 10793 | 254 | 2.353377% |
| D | 10793 | 1965 | 18.206245% |
Noise dominated data is calculated using 1-second bins in cleaned event files. If a bin has >2000 counts, and if more than 50% of those come from <1% of pixels, then it is considered to be noise-dominated and hence unusable.
| Quadrant | # 1 sec bins | Bins with >0 counts | Bins with >2000 counts | High rate bins dominated by noise | Noise dominated (total time) | Noise dominated (detector-on time) | Marked lightcurve |
|---|---|---|---|---|---|---|---|
| A | 13568 | 10795 | 2 | 2 | 0.01% | 0.02% | 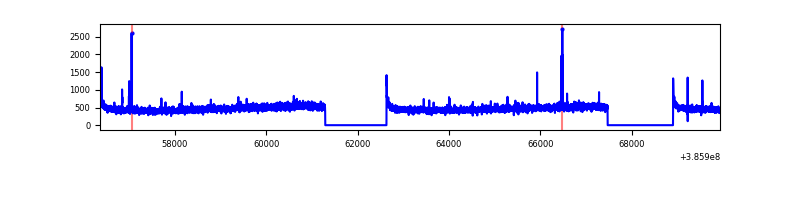 |
| B | 13568 | 10795 | 75 | 75 | 0.55% | 0.69% | 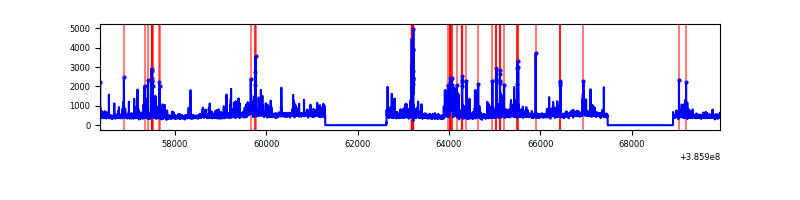 |
| C | 13568 | 10795 | 223 | 223 | 1.64% | 2.07% | 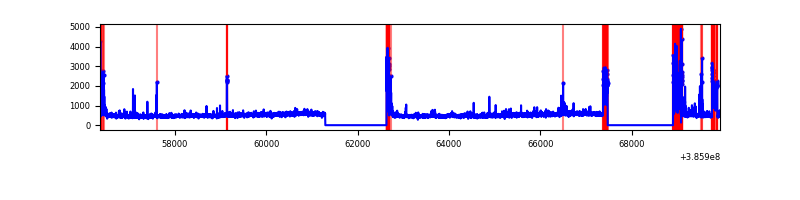 |
| D | 13568 | 10793 | 1685 | 1685 | 12.42% | 15.61% | 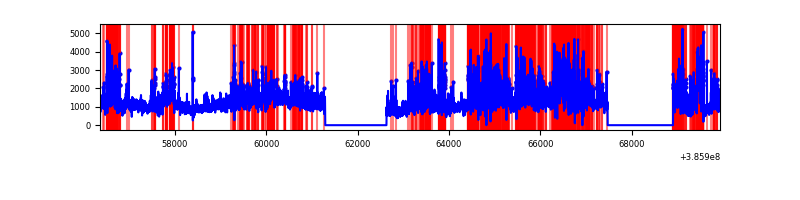 |
Top three noisy pixels from each quadrant. If the there are fewer than three noisy pixels in the level2.evt file, extra rows are filled as -1
| Pixel properties | Quadrant properties | ||||||
|---|---|---|---|---|---|---|---|
| Quadrant | DetID | PixID | Counts | Sigma | Mean | Median | Sigma |
| A | 10 | 83 | 134537 | 525.14 | 1253 | 1227 | 253.9 |
| A | 13 | 6 | 25372 | 95.11 | 1253 | 1227 | 253.9 |
| A | 7 | 16 | 21632 | 80.38 | 1253 | 1227 | 253.9 |
| B | 5 | 172 | 704841 | 2971.45 | 1239 | 1208 | 236.8 |
| B | 5 | 255 | 142596 | 597.08 | 1239 | 1208 | 236.8 |
| B | 0 | 245 | 100978 | 421.33 | 1239 | 1208 | 236.8 |
| C | 10 | 49 | 562463 | 2015.0 | 1208 | 1215 | 278.5 |
| C | 0 | 10 | 474436 | 1698.96 | 1208 | 1215 | 278.5 |
| C | 15 | 214 | 447950 | 1603.87 | 1208 | 1215 | 278.5 |
| D | 8 | 195 | 6146520 | 22182.88 | 1127 | 1093 | 277.0 |
| D | 7 | 80 | 3231280 | 11659.87 | 1127 | 1093 | 277.0 |
| D | 2 | 249 | 553028 | 1992.3 | 1127 | 1093 | 277.0 |
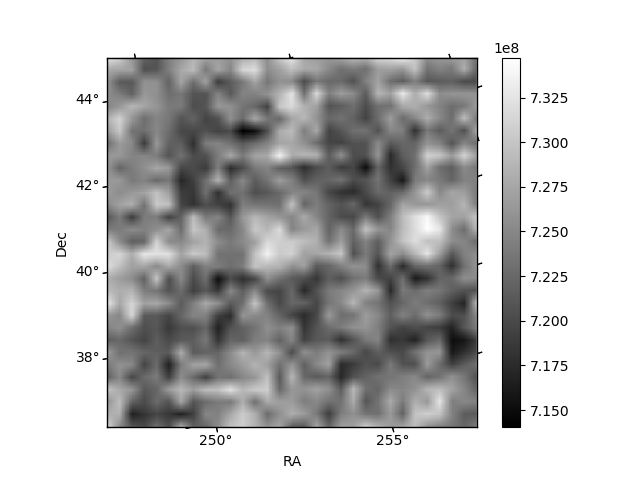
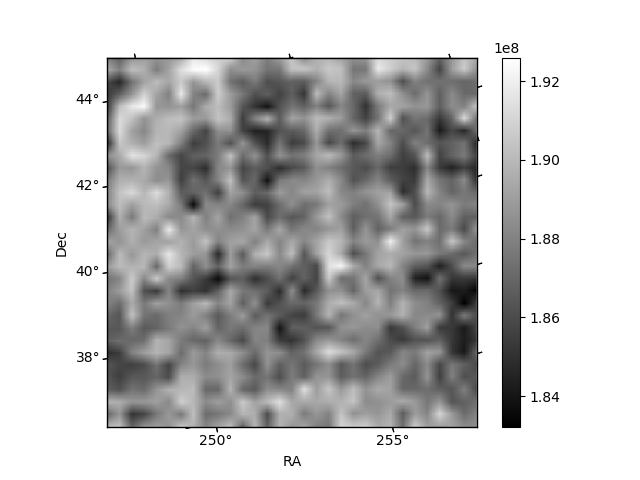
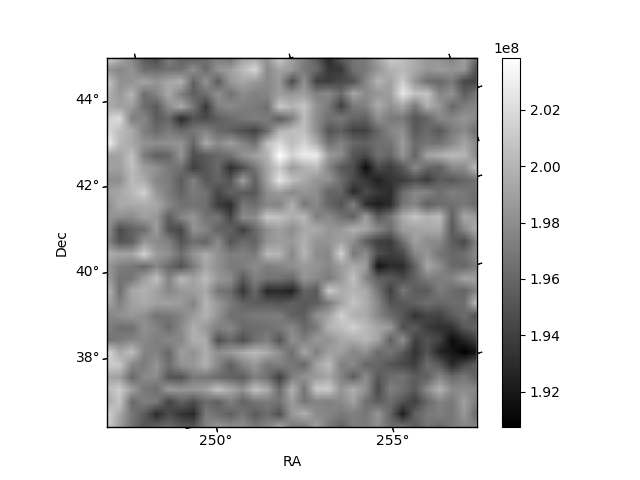
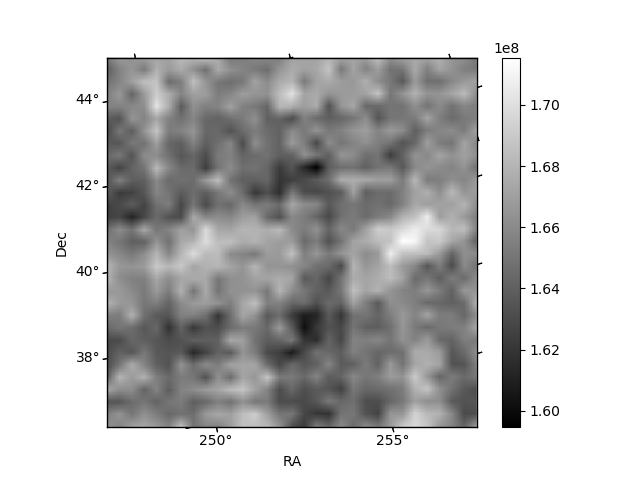
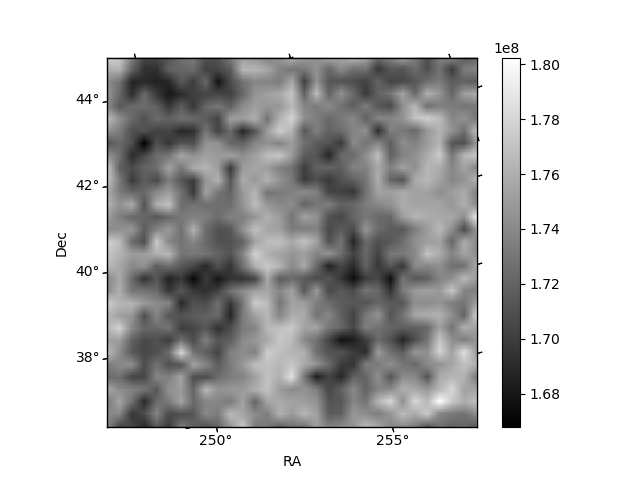
Histogram calculated using DETX and DETY for each event in the final _common_clean file
| Quadrant A | 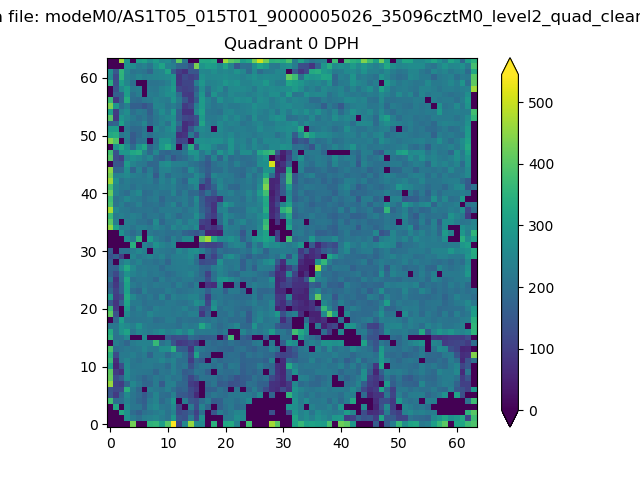 |
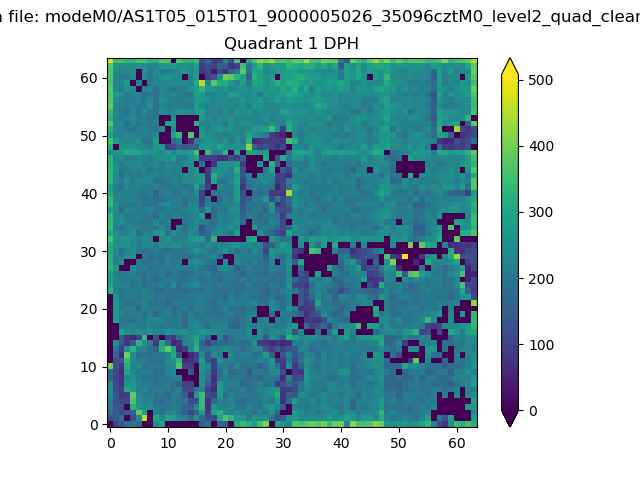 |
Quadrant B |
|---|---|---|---|
| Quadrant D | 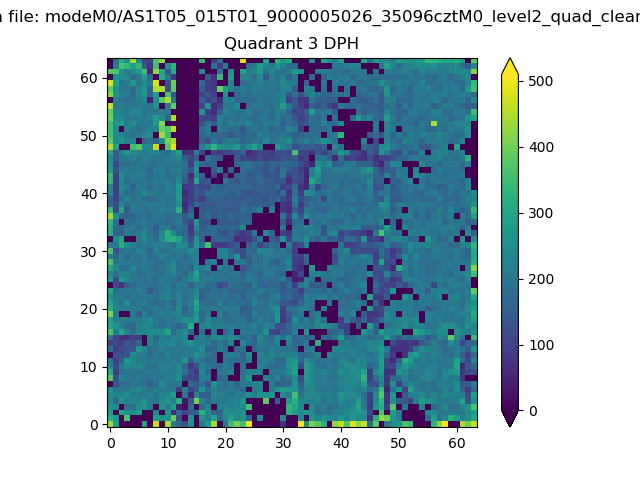 |
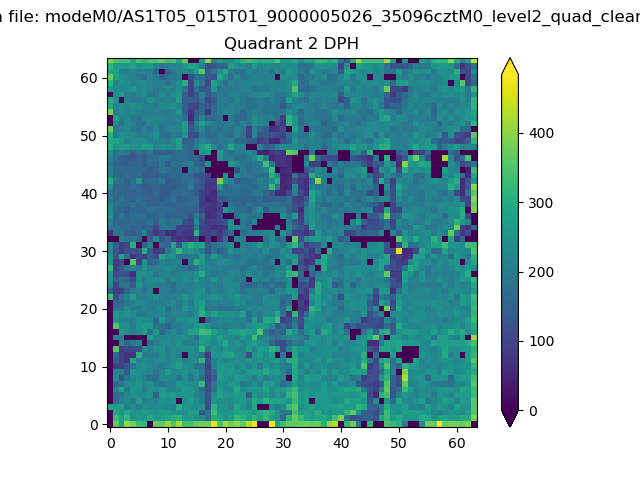 |
Quadrant C |
| Plot type | Count rate plots | Images |
|---|---|---|
| Comparison with Poisson distribution Blue bars denote a histogram of data divided into 1 sec bins. Red curve is a Poisson curve with rate = median count rate of data. |
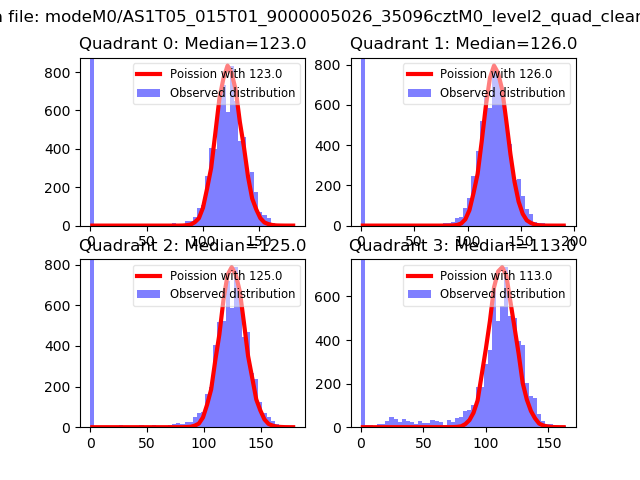 |
 |
| Quadrant-wise count rates Data is divided into 100 sec bins |
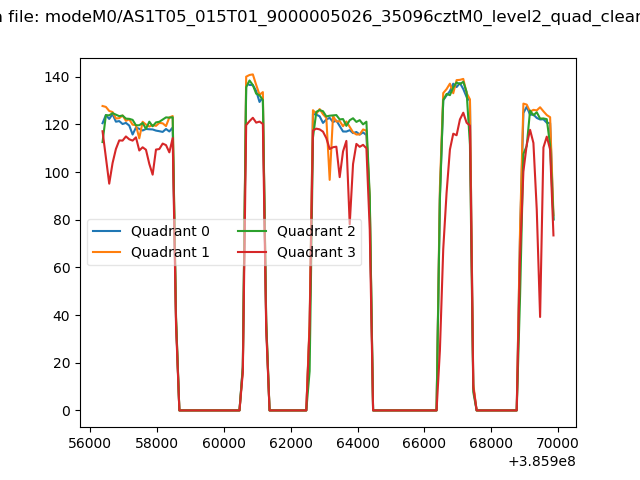 |
|
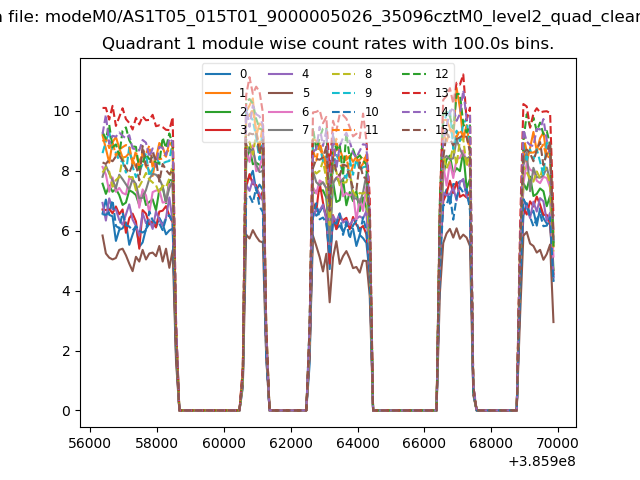
| Module-wise count rates for Quadrant A Data is divided into 100 sec bins |
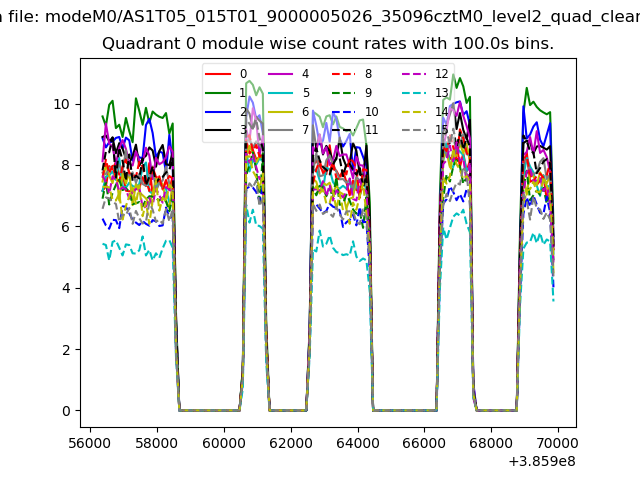 |
 |
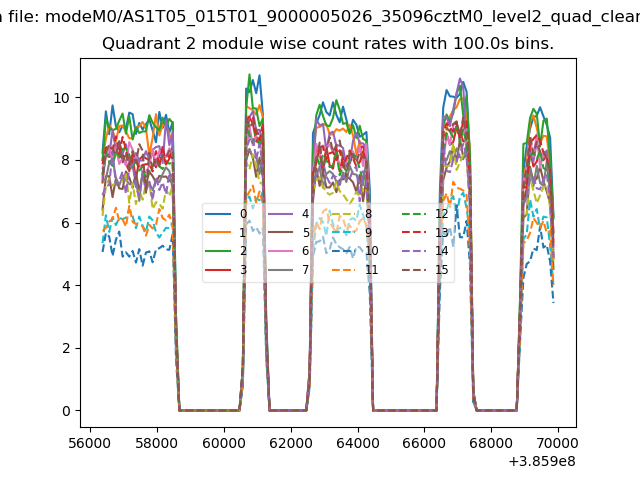
| Module-wise count rates for Quadrant B Data is divided into 100 sec bins |
 |
 |
| Module-wise count rates for Quadrant C Data is divided into 100 sec bins |
 |
 |
| Module-wise count rates for Quadrant D Data is divided into 100 sec bins |
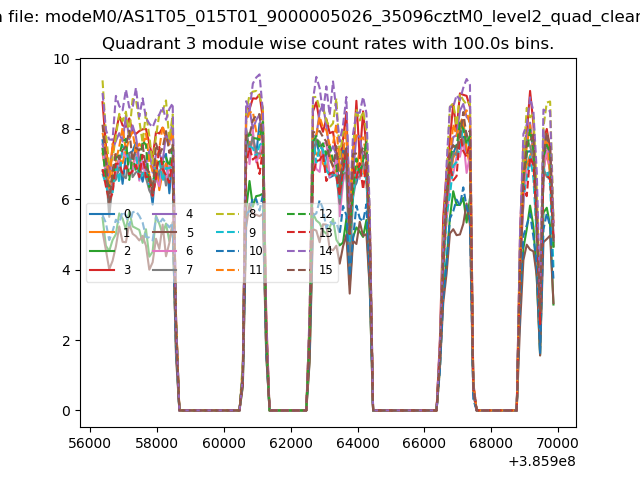 |
 |
| Parameter | Plot |
|---|---|
| CZT HV Monitor | 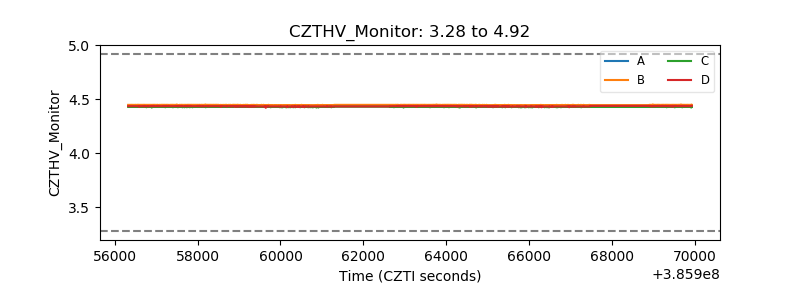 |
| D_VDD | 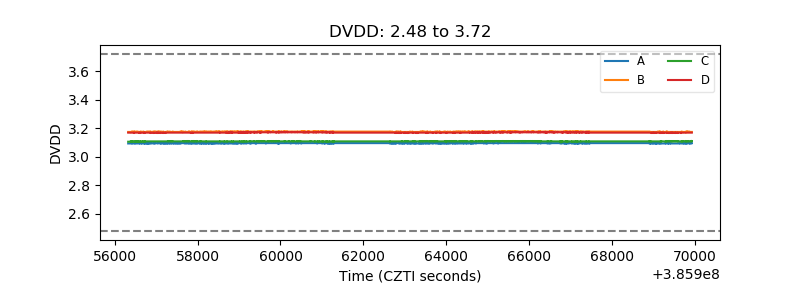 |
| Temperature 1 | 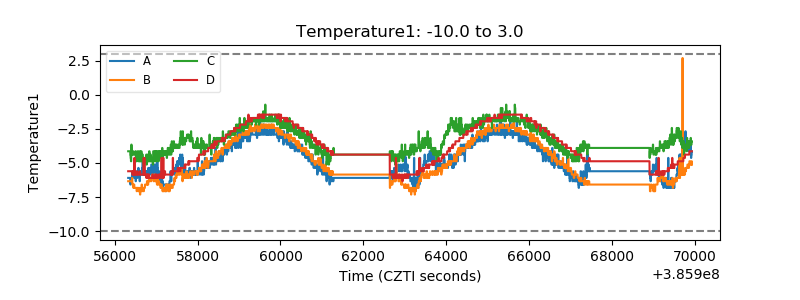 |
| Veto HV Monitor | 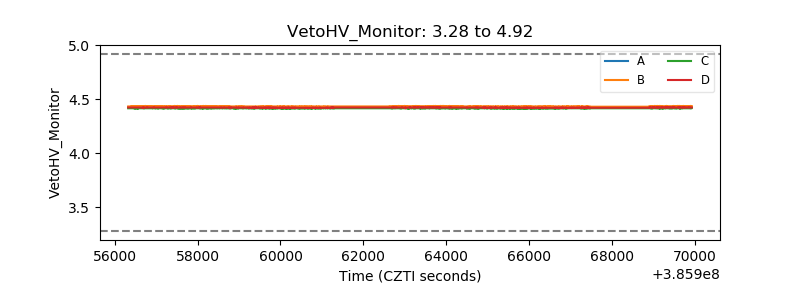 |
| Veto LLD | 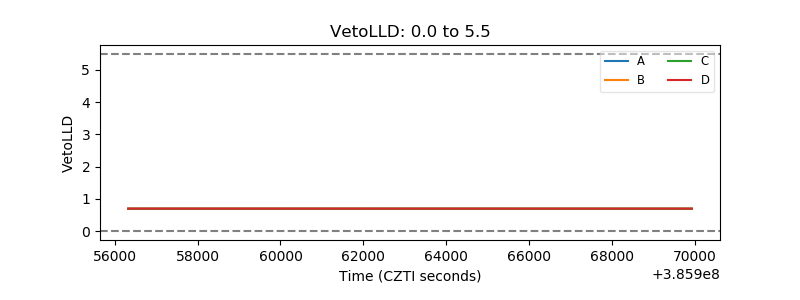 |
| Alpha Counter | 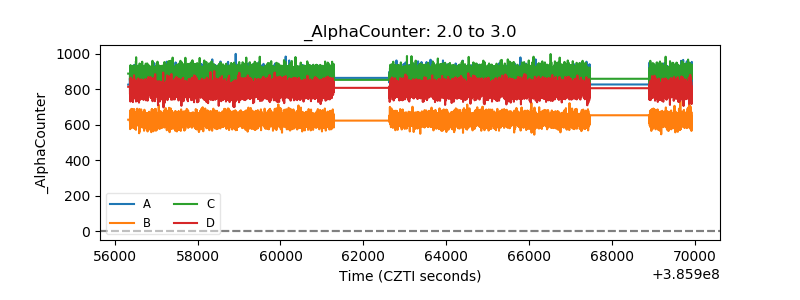 |
| _CPM_Rate | 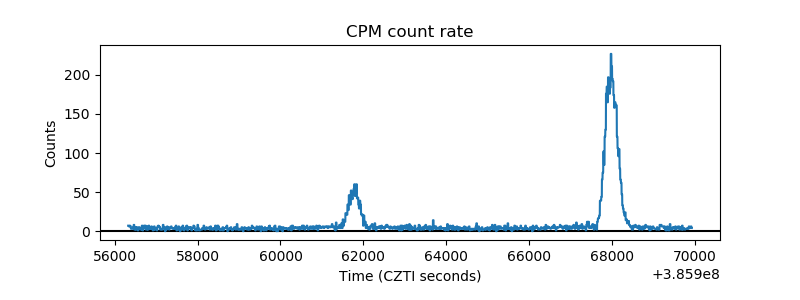 |
| CZT Counter | 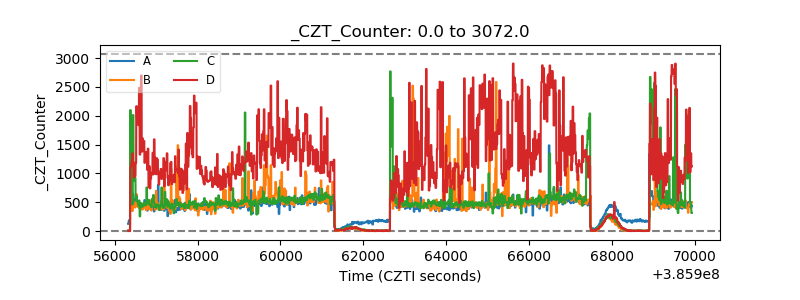 |
| +2.5 Volts monitor | 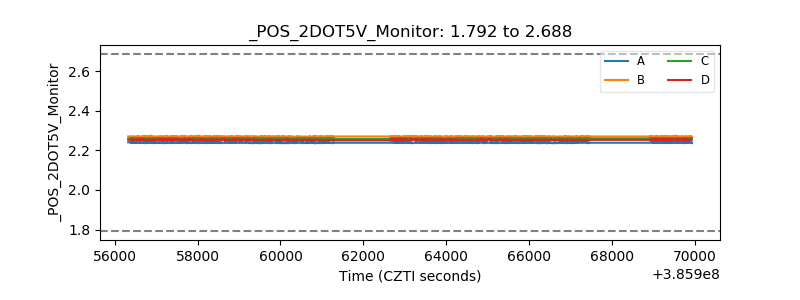 |
| +5 Volts monitor | 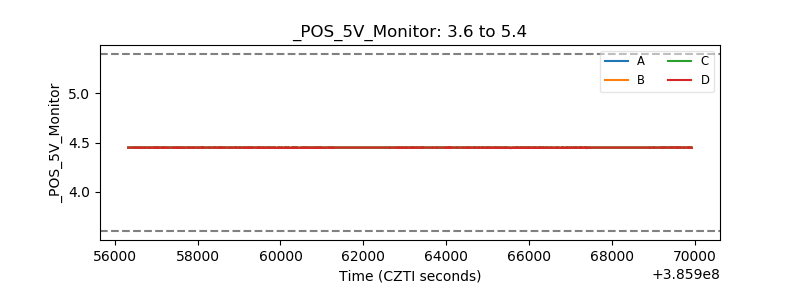 |
| _ROLL_ROT | 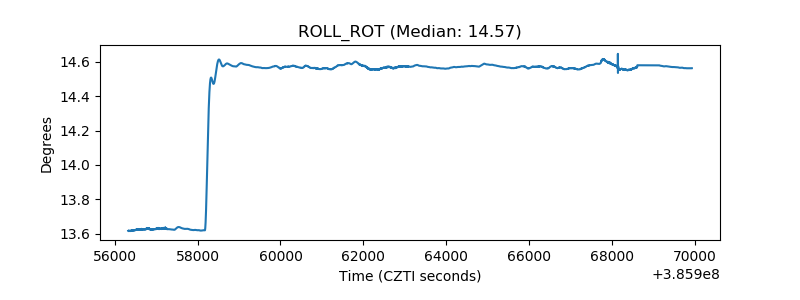 |
| _Roll_DEC | 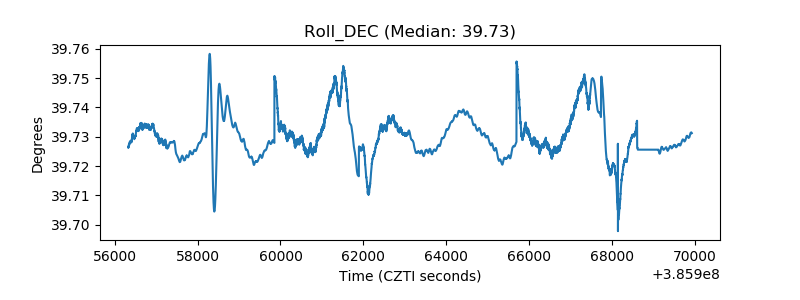 |
| _Roll_RA | 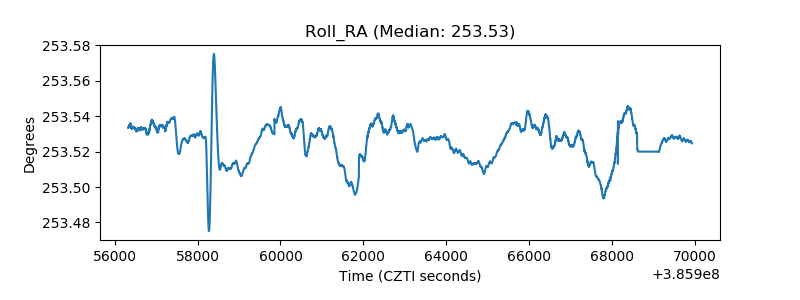 |
| Veto Counter | 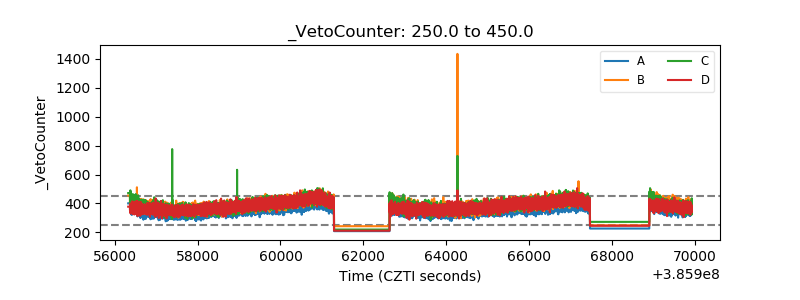 |