| Param | Original file | Final file |
|---|---|---|
| Filename | modeM0/AS1T05_015T01_9000005026_35094cztM0_level2.evt | modeM0/AS1T05_015T01_9000005026_35094cztM0_level2_quad_clean.evt |
| Size (bytes) | 632,188,800 | 75,418,560 |
| Size | 602.9 MB | 71.9 MB |
| Events in quadrant A | 2,948,039 | 480,098 |
| Events in quadrant B | 3,338,545 | 489,193 |
| Events in quadrant C | 3,384,316 | 484,260 |
| Events in quadrant D | 9,052,951 | 394,016 |
| Mode SS | |||
|---|---|---|---|
| Quadrant | BADHDUFLAG | Total packets | Discarded packets |
| A | 0 | 130 | 0 |
| B | 0 | 130 | 0 |
| C | 0 | 130 | 0 |
| D | 0 | 130 | 0 |
| Mode M9 | |||
|---|---|---|---|
| Quadrant | BADHDUFLAG | Total packets | Discarded packets |
| A | 0 | 26 | 0 |
| B | 0 | 26 | 0 |
| C | 0 | 26 | 0 |
| D | 0 | 26 | 0 |
| Mode M0 | |||
|---|---|---|---|
| Quadrant | BADHDUFLAG | Total packets | Discarded packets |
| A | 0 | 12946 | 3 |
| B | 0 | 14175 | 2 |
| C | 0 | 13903 | 2 |
| D | 0 | 31279 | 2 |
| Quadrant | Total seconds | Saturated seconds | Saturation percentage |
|---|---|---|---|
| A | 6238 | 22 | 0.352677% |
| B | 6238 | 95 | 1.522924% |
| C | 6238 | 62 | 0.993908% |
| D | 6238 | 1351 | 21.657583% |
Noise dominated data is calculated using 1-second bins in cleaned event files. If a bin has >2000 counts, and if more than 50% of those come from <1% of pixels, then it is considered to be noise-dominated and hence unusable.
| Quadrant | # 1 sec bins | Bins with >0 counts | Bins with >2000 counts | High rate bins dominated by noise | Noise dominated (total time) | Noise dominated (detector-on time) | Marked lightcurve |
|---|---|---|---|---|---|---|---|
| A | 8894 | 6240 | 12 | 12 | 0.13% | 0.19% | 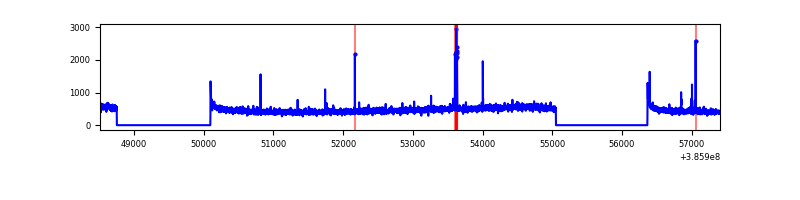 |
| B | 8894 | 6240 | 44 | 44 | 0.49% | 0.71% | 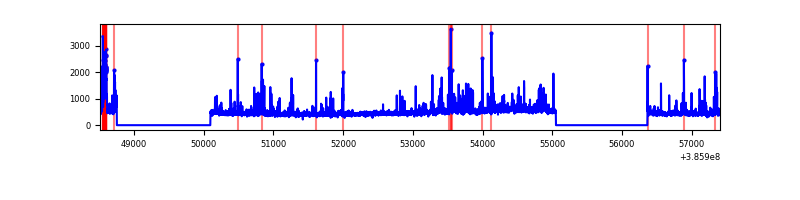 |
| C | 8894 | 6240 | 43 | 43 | 0.48% | 0.69% | 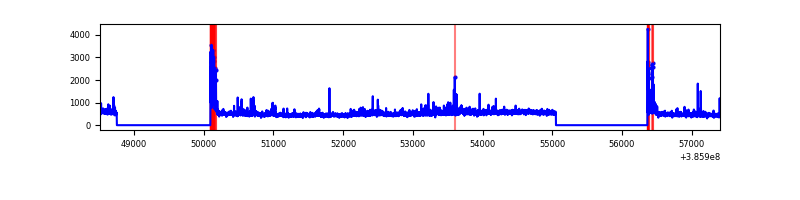 |
| D | 8894 | 6239 | 1018 | 1018 | 11.45% | 16.32% | 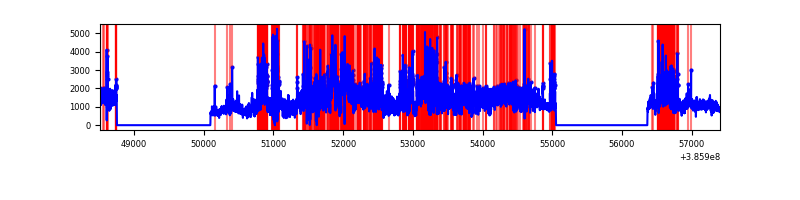 |
Top three noisy pixels from each quadrant. If the there are fewer than three noisy pixels in the level2.evt file, extra rows are filled as -1
| Pixel properties | Quadrant properties | ||||||
|---|---|---|---|---|---|---|---|
| Quadrant | DetID | PixID | Counts | Sigma | Mean | Median | Sigma |
| A | 10 | 83 | 85159 | 583.58 | 716 | 702 | 144.7 |
| A | 9 | 143 | 58306 | 398.03 | 716 | 702 | 144.7 |
| A | 13 | 6 | 16994 | 112.58 | 716 | 702 | 144.7 |
| B | 5 | 172 | 388368 | 2805.96 | 714 | 697 | 138.2 |
| B | 5 | 255 | 77407 | 555.23 | 714 | 697 | 138.2 |
| B | 4 | 232 | 23257 | 163.29 | 714 | 697 | 138.2 |
| C | 15 | 214 | 260569 | 1607.24 | 697 | 702 | 161.7 |
| C | 0 | 10 | 209281 | 1290.03 | 697 | 702 | 161.7 |
| C | 0 | 207 | 93851 | 576.11 | 697 | 702 | 161.7 |
| D | 8 | 195 | 3576213 | 23309.54 | 632 | 613 | 153.4 |
| D | 7 | 80 | 2180907 | 14213.46 | 632 | 613 | 153.4 |
| D | 13 | 249 | 493352 | 3212.19 | 632 | 613 | 153.4 |
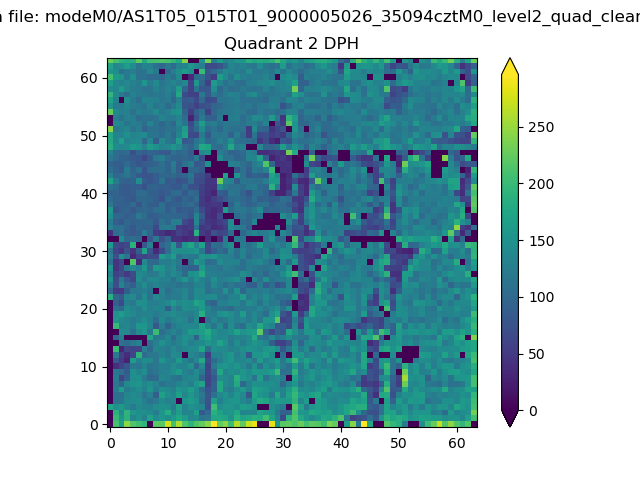
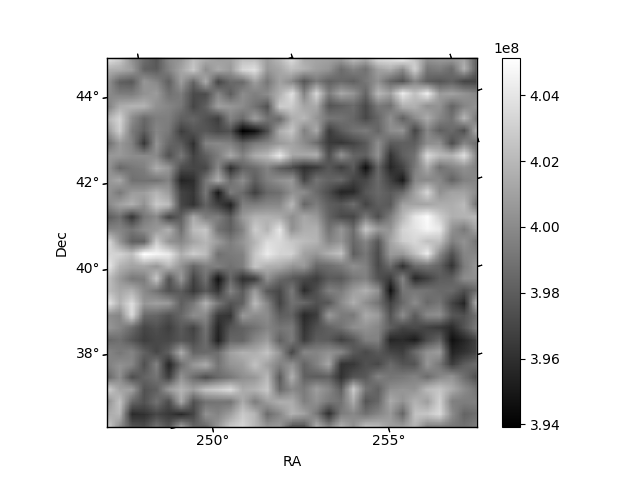
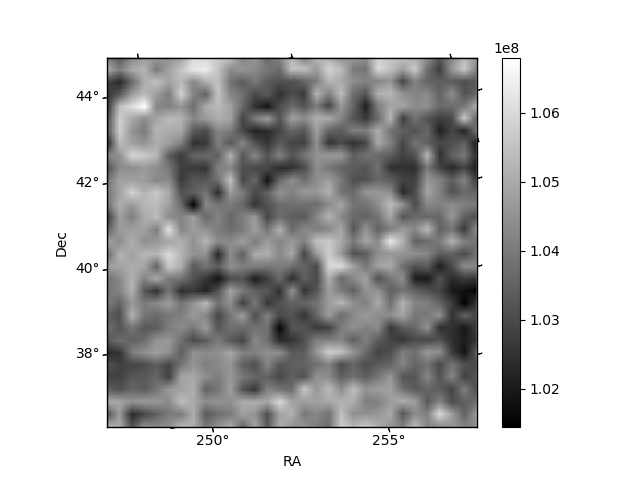
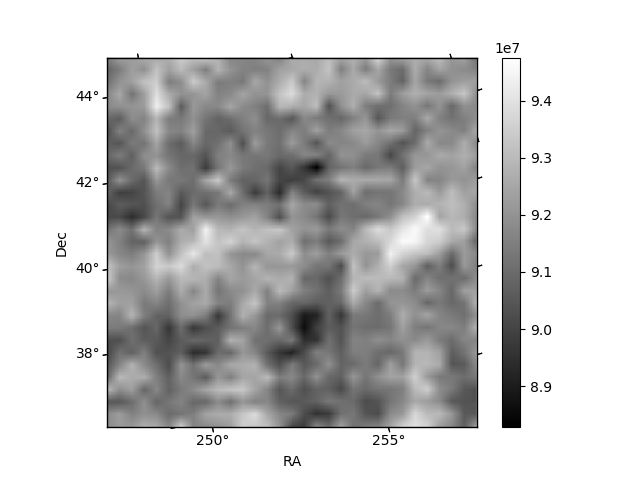
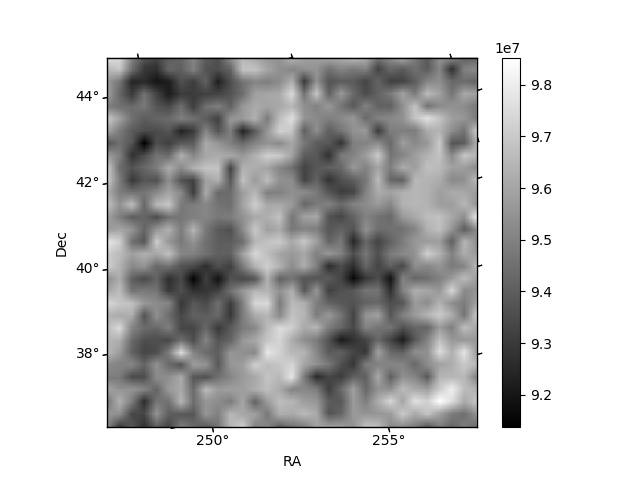
Histogram calculated using DETX and DETY for each event in the final _common_clean file
| Quadrant A | 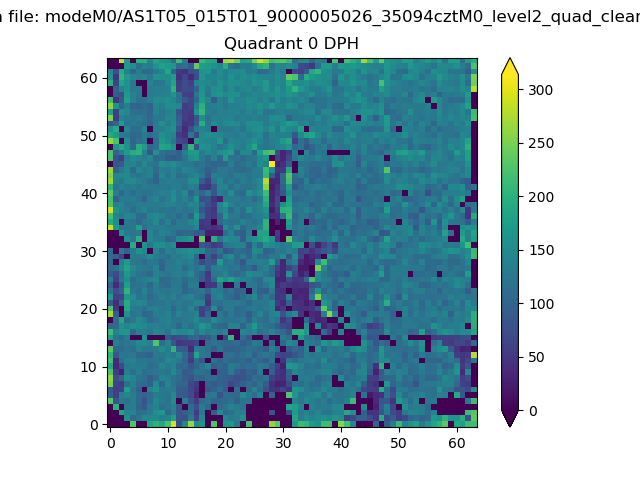 |
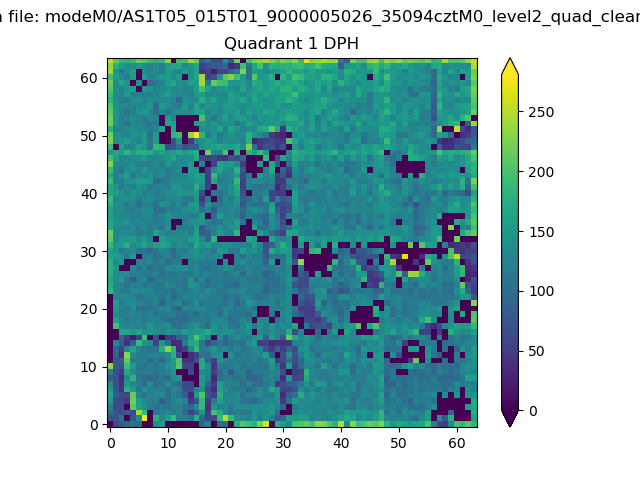 |
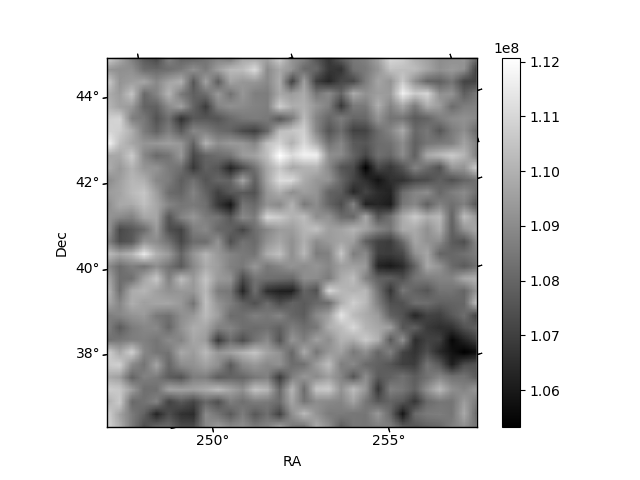
Quadrant B |
|---|---|---|---|
| Quadrant D | 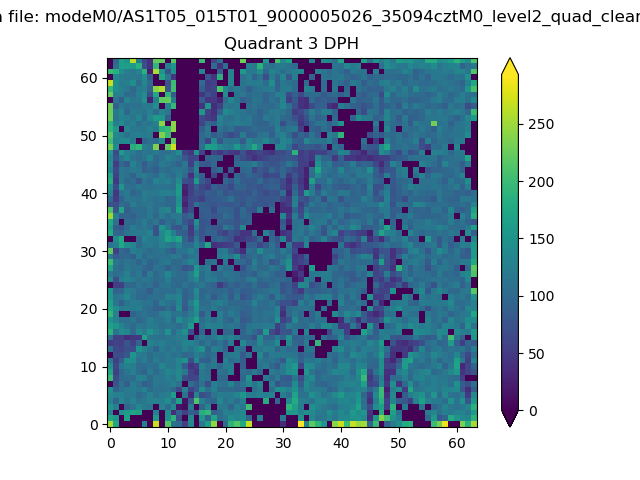 |
 |
Quadrant C |
| Plot type | Count rate plots | Images |
|---|---|---|
| Comparison with Poisson distribution Blue bars denote a histogram of data divided into 1 sec bins. Red curve is a Poisson curve with rate = median count rate of data. |
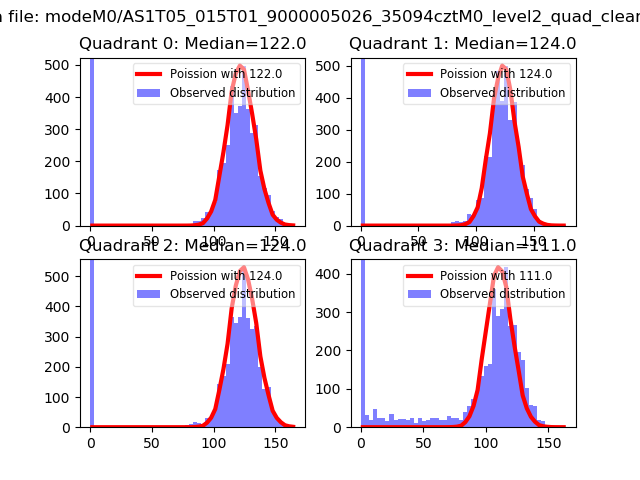 |
 |
| Quadrant-wise count rates Data is divided into 100 sec bins |
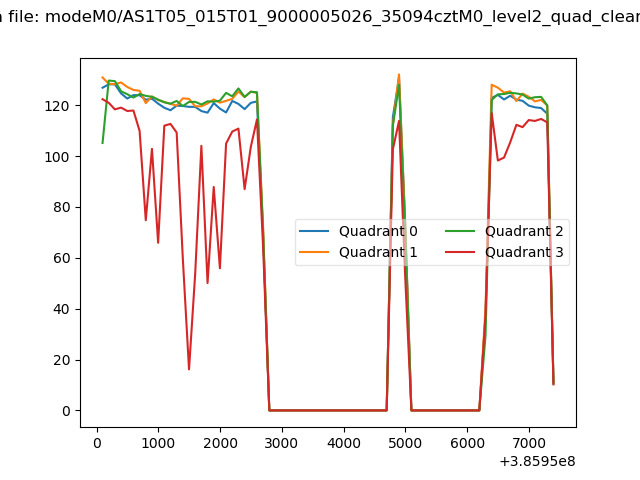 |
|
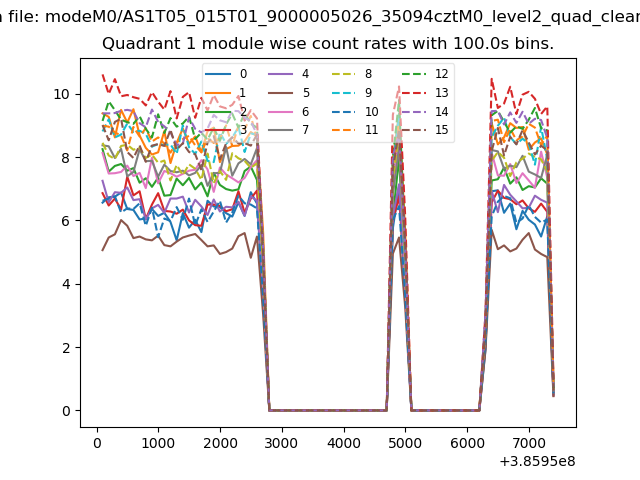
| Module-wise count rates for Quadrant A Data is divided into 100 sec bins |
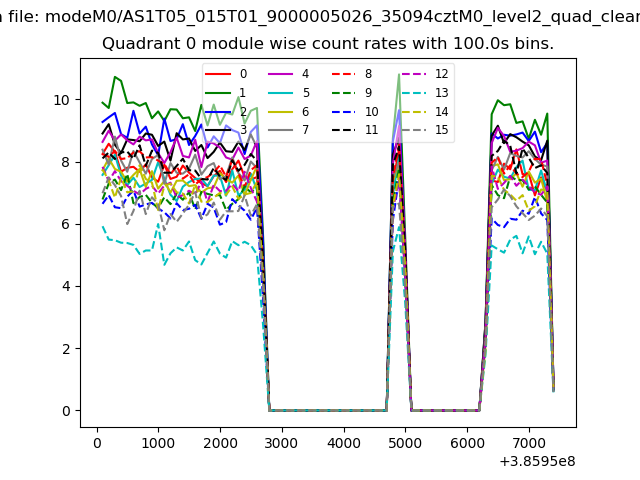 |
 |
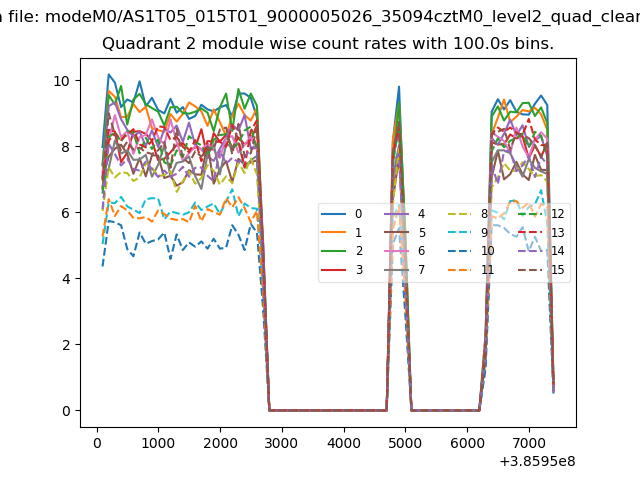
| Module-wise count rates for Quadrant B Data is divided into 100 sec bins |
 |
 |
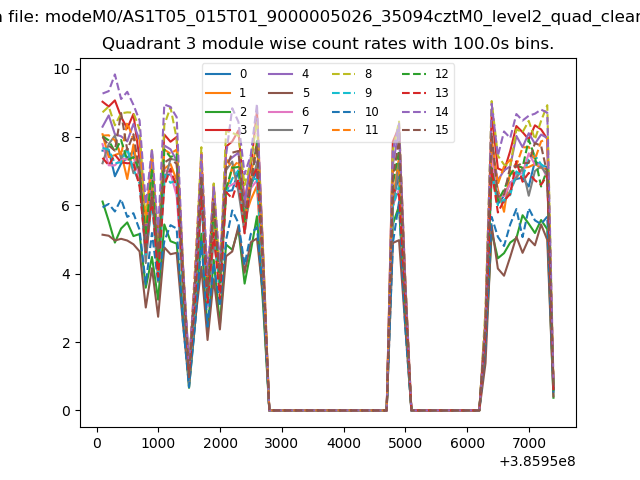
| Module-wise count rates for Quadrant C Data is divided into 100 sec bins |
 |
 |
| Module-wise count rates for Quadrant D Data is divided into 100 sec bins |
 |
 |
| Parameter | Plot |
|---|---|
| CZT HV Monitor |  |
| D_VDD | 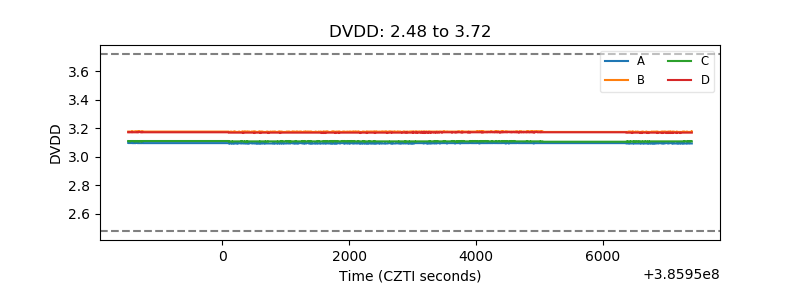 |
| Temperature 1 | 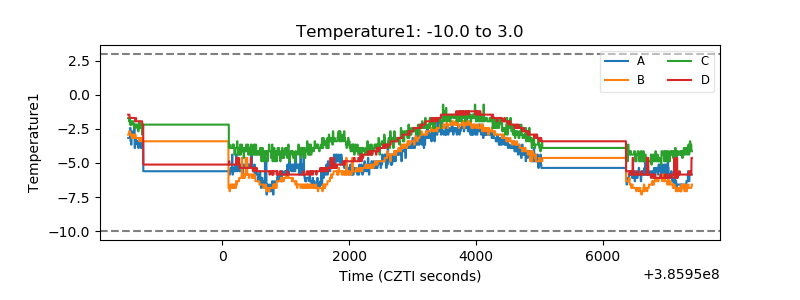 |
| Veto HV Monitor | 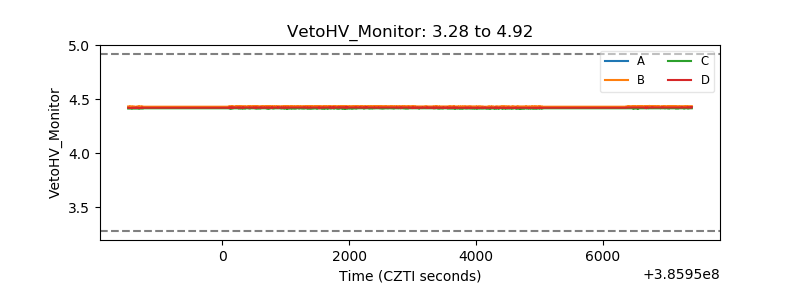 |
| Veto LLD | 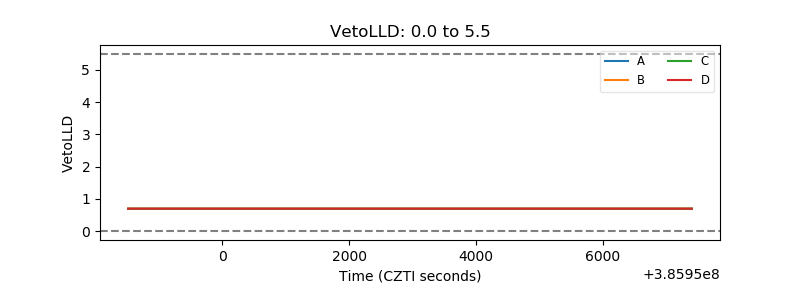 |
| Alpha Counter | 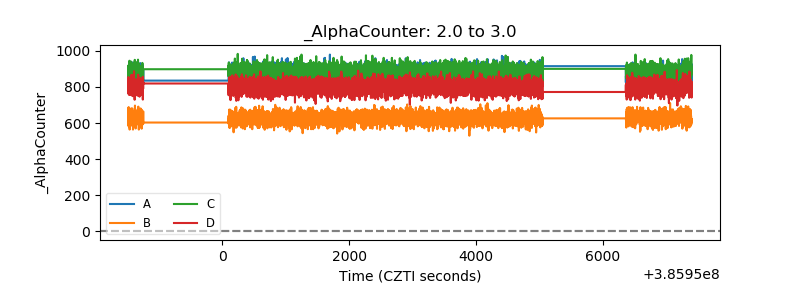 |
| _CPM_Rate | 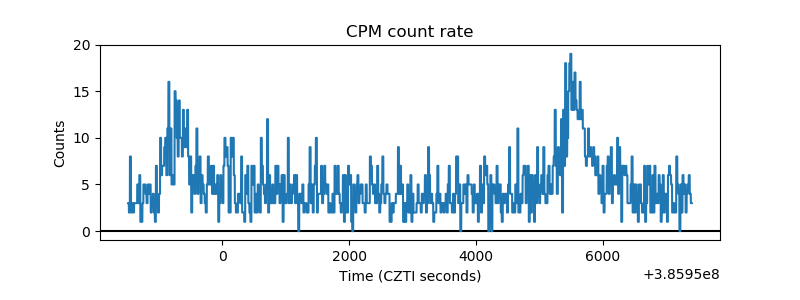 |
| CZT Counter | 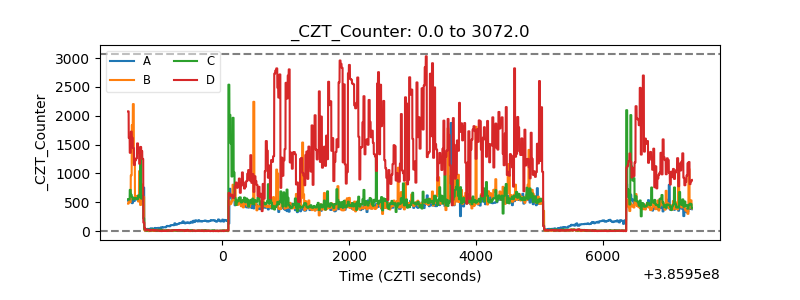 |
| +2.5 Volts monitor | 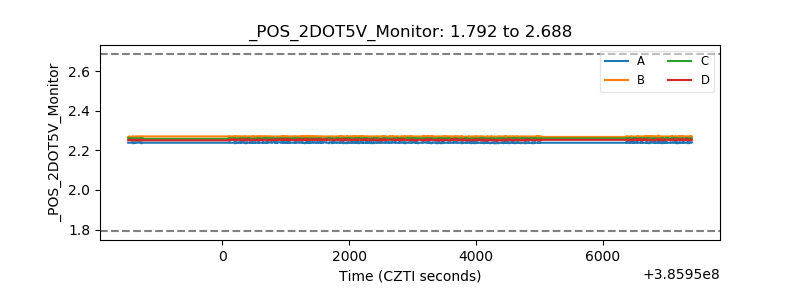 |
| +5 Volts monitor | 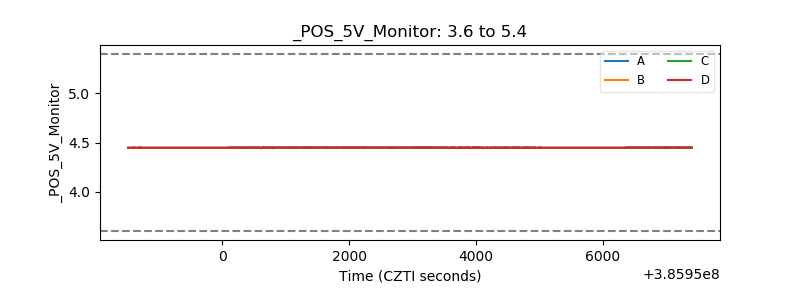 |
| _ROLL_ROT | 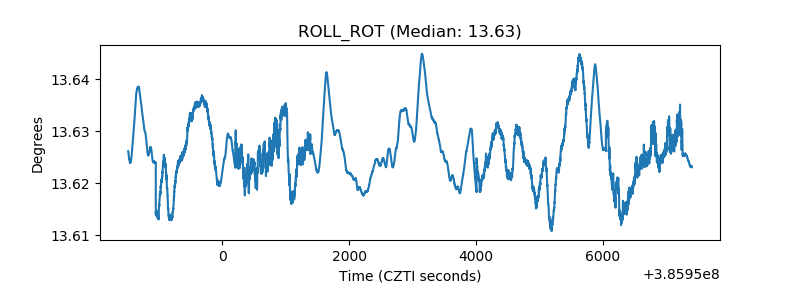 |
| _Roll_DEC | 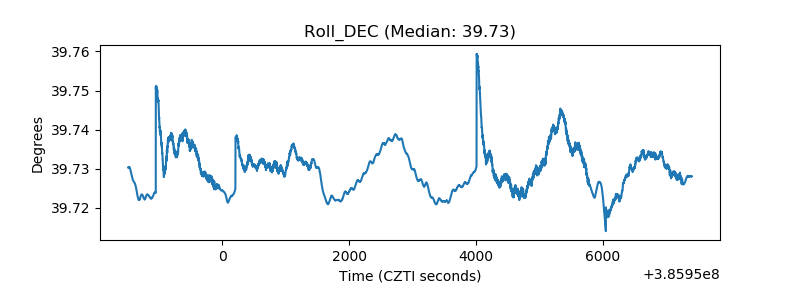 |
| _Roll_RA | 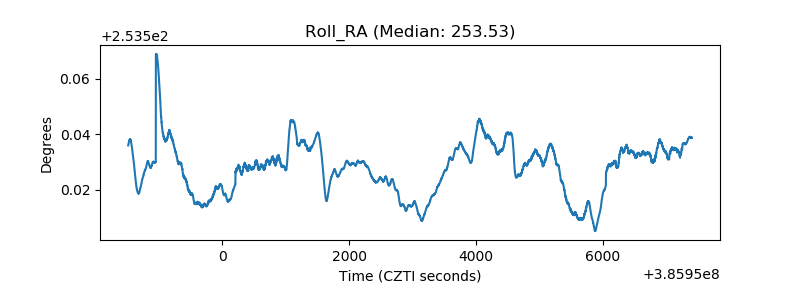 |
| Veto Counter | 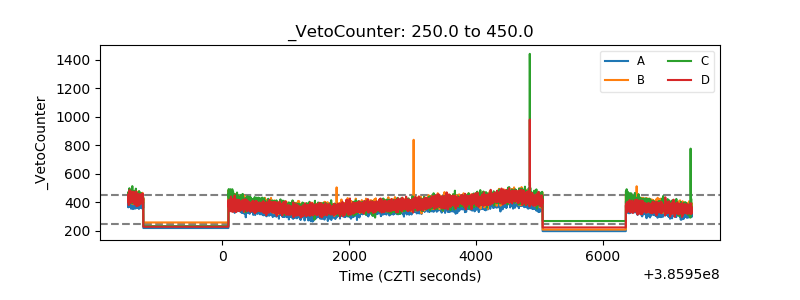 |