| Param | Original file | Final file |
|---|---|---|
| Filename | modeM0/AS1T05_015T01_9000005026_35093cztM0_level2.evt | modeM0/AS1T05_015T01_9000005026_35093cztM0_level2_quad_clean.evt |
| Size (bytes) | 534,533,760 | 77,080,320 |
| Size | 509.8 MB | 73.5 MB |
| Events in quadrant A | 2,723,659 | 491,545 |
| Events in quadrant B | 3,764,430 | 492,394 |
| Events in quadrant C | 3,135,257 | 496,823 |
| Events in quadrant D | 6,170,526 | 446,035 |
| Mode SS | |||
|---|---|---|---|
| Quadrant | BADHDUFLAG | Total packets | Discarded packets |
| A | 0 | 118 | 0 |
| B | 0 | 118 | 0 |
| C | 0 | 118 | 0 |
| D | 0 | 118 | 0 |
| Mode M9 | |||
|---|---|---|---|
| Quadrant | BADHDUFLAG | Total packets | Discarded packets |
| A | 0 | 25 | 0 |
| B | 0 | 25 | 0 |
| C | 0 | 25 | 0 |
| D | 0 | 26 | 0 |
| Mode M0 | |||
|---|---|---|---|
| Quadrant | BADHDUFLAG | Total packets | Discarded packets |
| A | 0 | 12014 | 3 |
| B | 0 | 15036 | 2 |
| C | 0 | 12823 | 2 |
| D | 0 | 22416 | 2 |
| Quadrant | Total seconds | Saturated seconds | Saturation percentage |
|---|---|---|---|
| A | 5824 | 4 | 0.068681% |
| B | 5824 | 231 | 3.966346% |
| C | 5824 | 64 | 1.098901% |
| D | 5824 | 708 | 12.156593% |
Noise dominated data is calculated using 1-second bins in cleaned event files. If a bin has >2000 counts, and if more than 50% of those come from <1% of pixels, then it is considered to be noise-dominated and hence unusable.
| Quadrant | # 1 sec bins | Bins with >0 counts | Bins with >2000 counts | High rate bins dominated by noise | Noise dominated (total time) | Noise dominated (detector-on time) | Marked lightcurve |
|---|---|---|---|---|---|---|---|
| A | 7167 | 5825 | 0 | 0 | 0.00% | 0.00% | 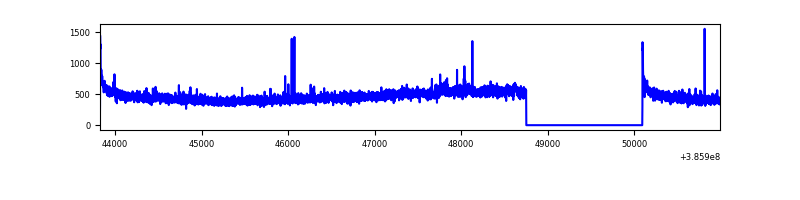 |
| B | 7167 | 5825 | 154 | 154 | 2.15% | 2.64% | 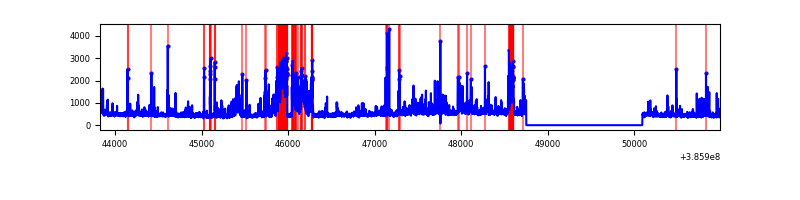 |
| C | 7167 | 5825 | 43 | 43 | 0.60% | 0.74% |  |
| D | 7167 | 5825 | 541 | 541 | 7.55% | 9.29% | 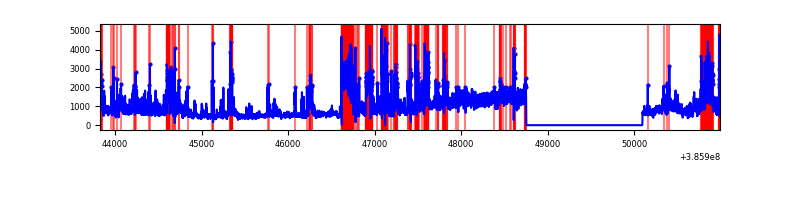 |
Top three noisy pixels from each quadrant. If the there are fewer than three noisy pixels in the level2.evt file, extra rows are filled as -1
| Pixel properties | Quadrant properties | ||||||
|---|---|---|---|---|---|---|---|
| Quadrant | DetID | PixID | Counts | Sigma | Mean | Median | Sigma |
| A | 10 | 83 | 83709 | 614.68 | 669 | 655 | 135.1 |
| A | 13 | 6 | 19084 | 136.39 | 669 | 655 | 135.1 |
| A | 9 | 143 | 18384 | 131.21 | 669 | 655 | 135.1 |
| B | 5 | 172 | 959034 | 7483.51 | 661 | 643 | 128.1 |
| B | 5 | 255 | 95983 | 744.45 | 661 | 643 | 128.1 |
| B | 0 | 190 | 39490 | 303.33 | 661 | 643 | 128.1 |
| C | 15 | 214 | 245231 | 1611.16 | 653 | 658 | 151.8 |
| C | 0 | 10 | 186870 | 1226.7 | 653 | 658 | 151.8 |
| C | 12 | 250 | 65074 | 424.35 | 653 | 658 | 151.8 |
| D | 8 | 195 | 1751840 | 11562.88 | 614 | 595 | 151.5 |
| D | 7 | 80 | 1005455 | 6634.75 | 614 | 595 | 151.5 |
| D | 1 | 52 | 494061 | 3258.19 | 614 | 595 | 151.5 |
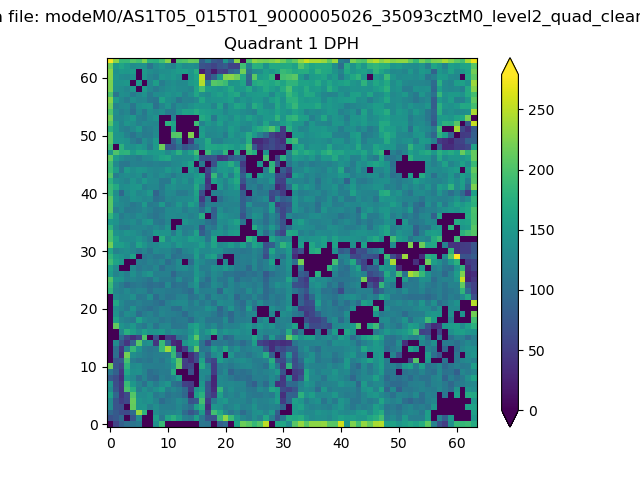
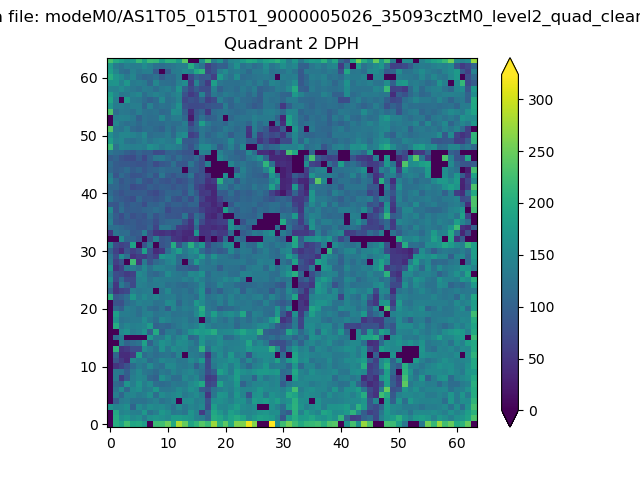
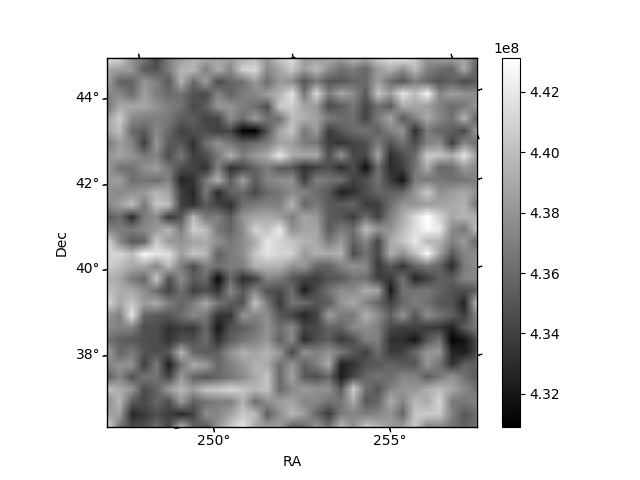
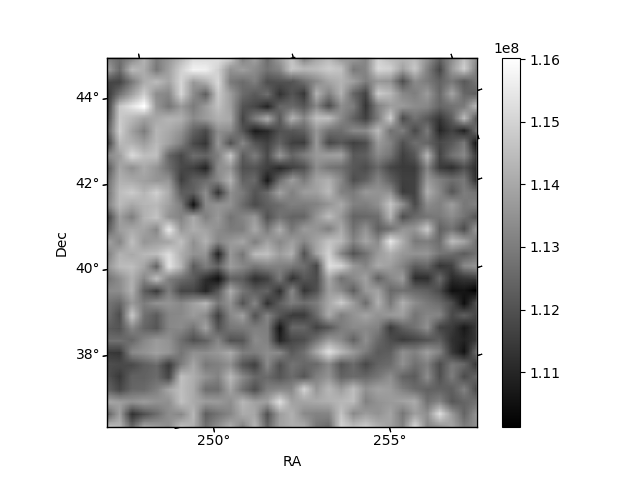
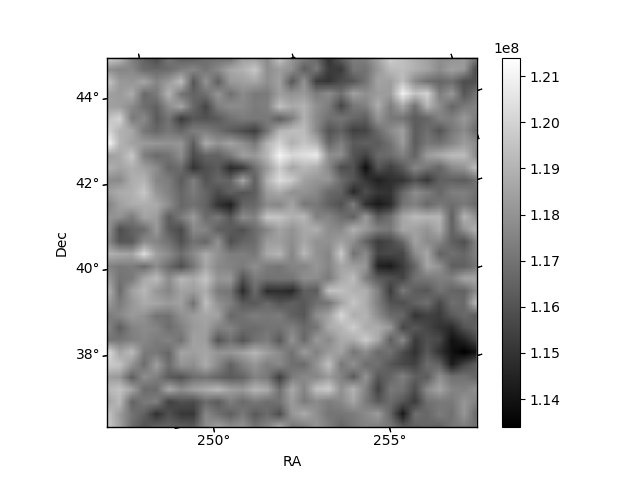
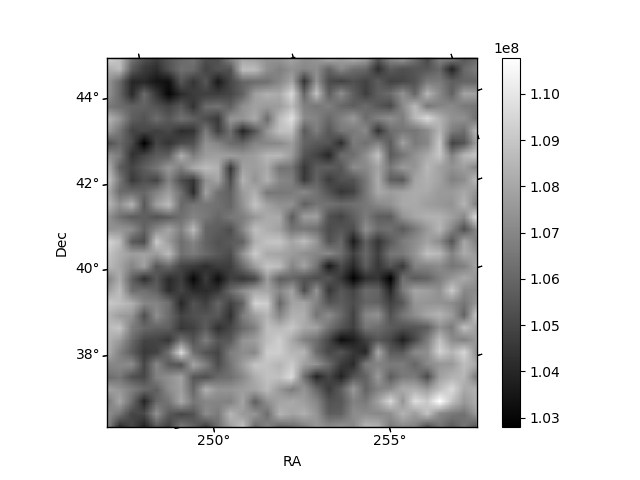
Histogram calculated using DETX and DETY for each event in the final _common_clean file
| Quadrant A | 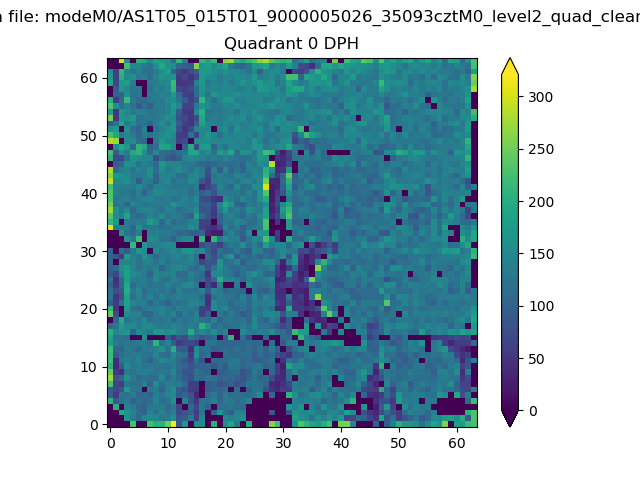 |
 |
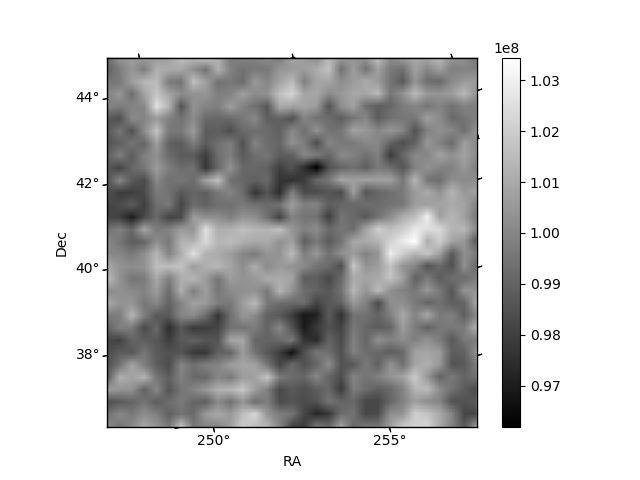
Quadrant B |
|---|---|---|---|
| Quadrant D | 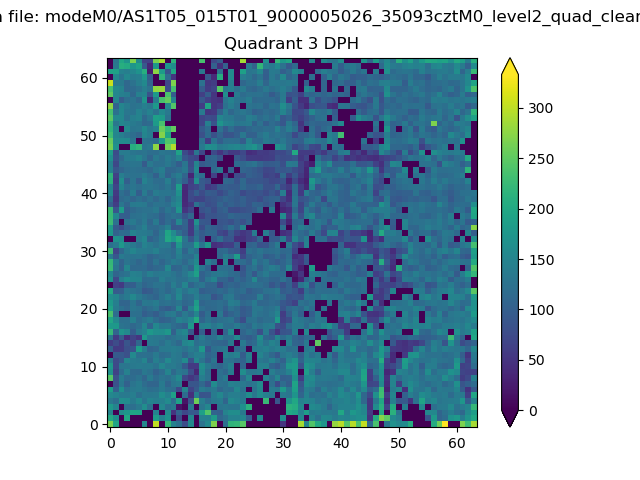 |
 |
Quadrant C |
| Plot type | Count rate plots | Images |
|---|---|---|
| Comparison with Poisson distribution Blue bars denote a histogram of data divided into 1 sec bins. Red curve is a Poisson curve with rate = median count rate of data. |
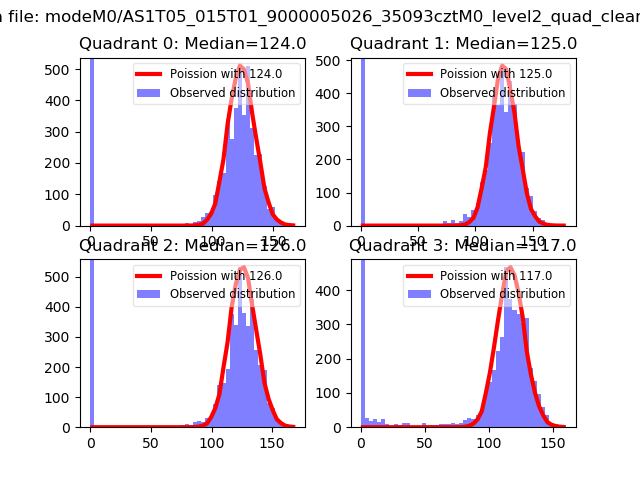 |
 |
| Quadrant-wise count rates Data is divided into 100 sec bins |
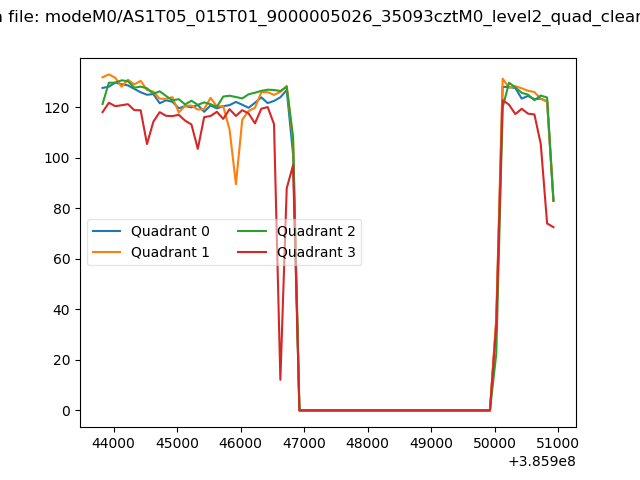 |
|
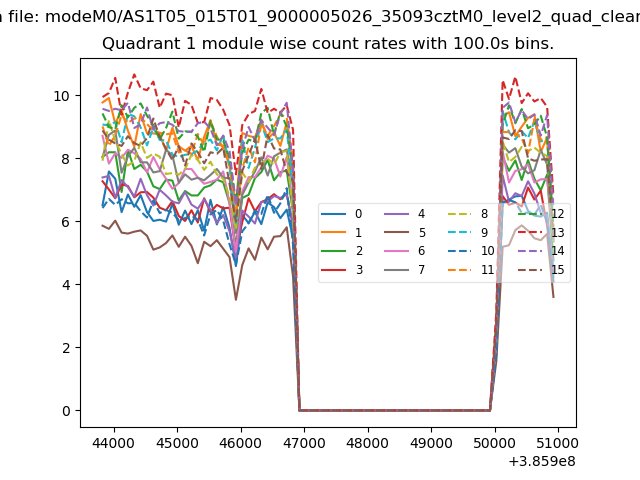
| Module-wise count rates for Quadrant A Data is divided into 100 sec bins |
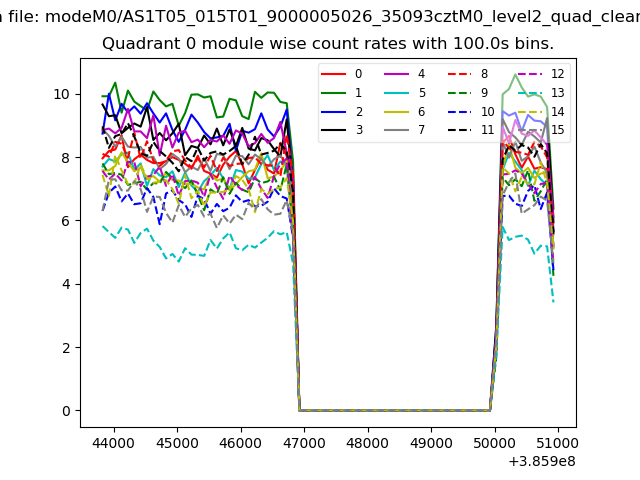 |
 |
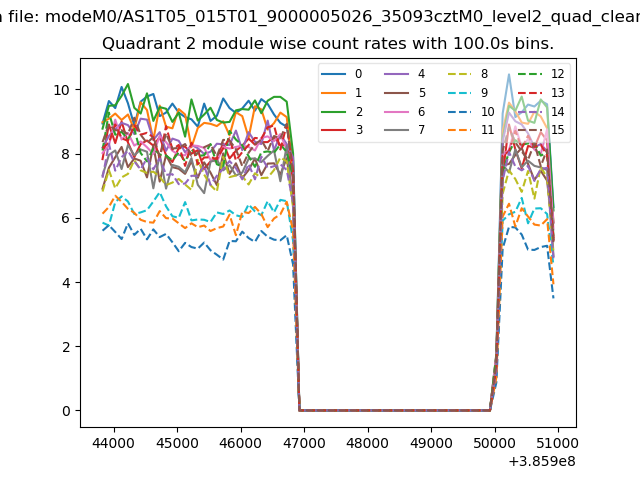
| Module-wise count rates for Quadrant B Data is divided into 100 sec bins |
 |
 |
| Module-wise count rates for Quadrant C Data is divided into 100 sec bins |
 |
 |
| Module-wise count rates for Quadrant D Data is divided into 100 sec bins |
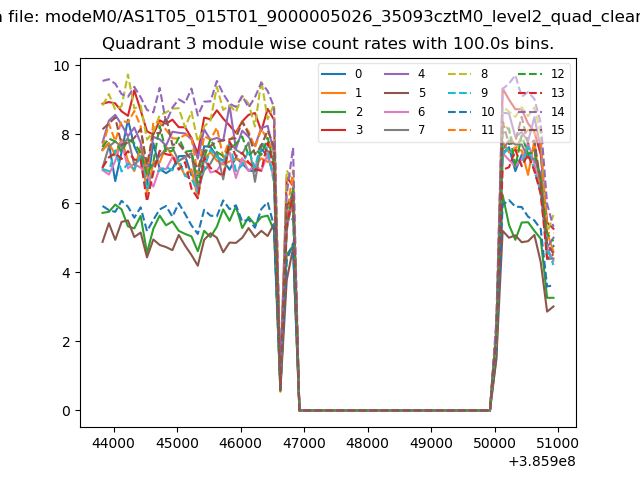 |
 |
| Parameter | Plot |
|---|---|
| CZT HV Monitor | 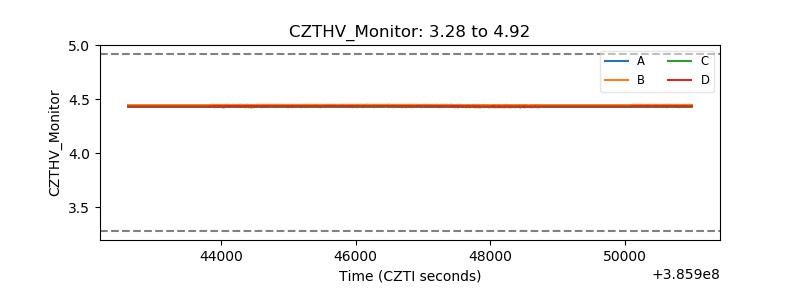 |
| D_VDD | 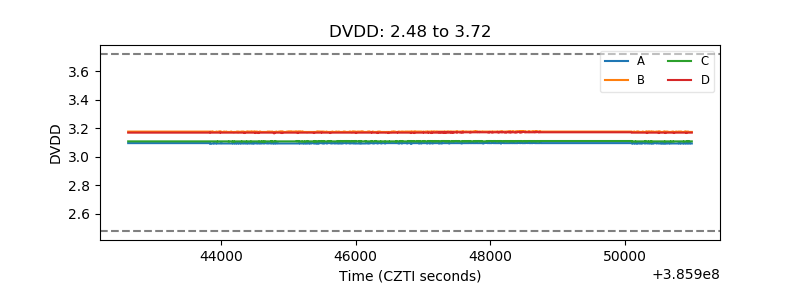 |
| Temperature 1 | 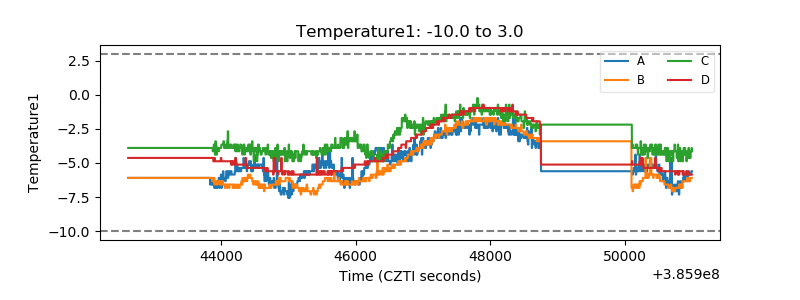 |
| Veto HV Monitor | 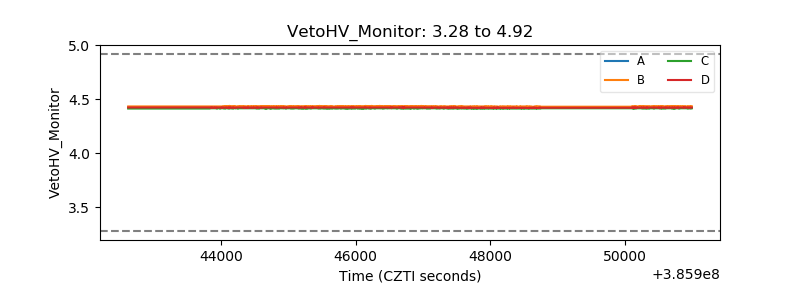 |
| Veto LLD | 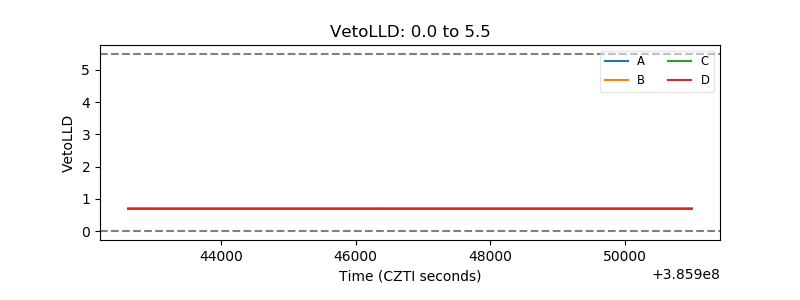 |
| Alpha Counter | 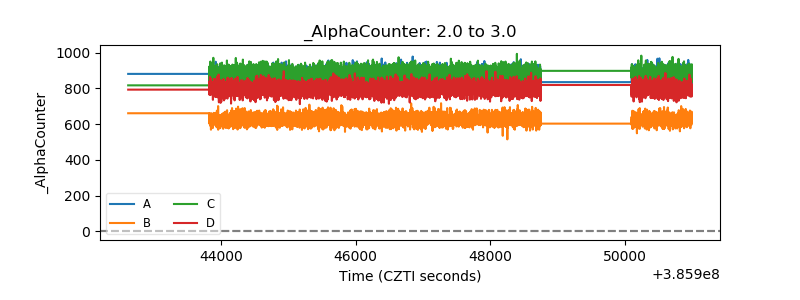 |
| _CPM_Rate | 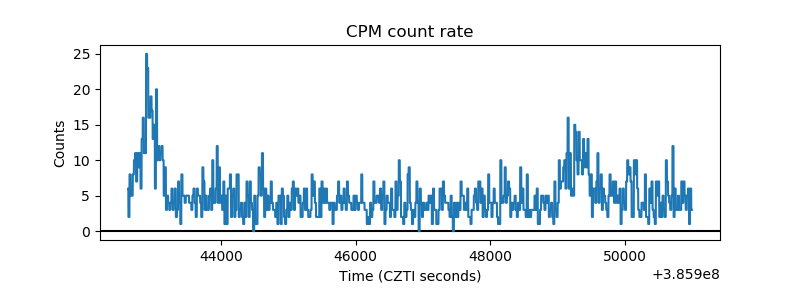 |
| CZT Counter | 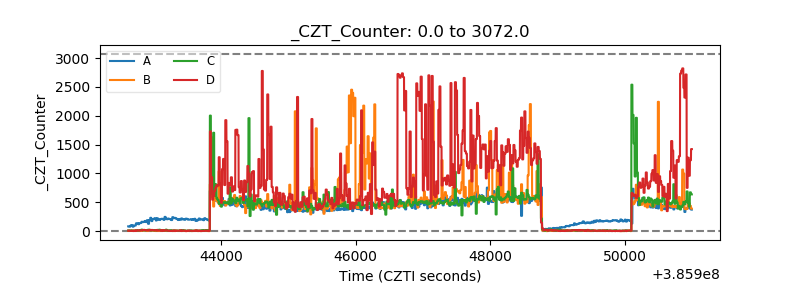 |
| +2.5 Volts monitor | 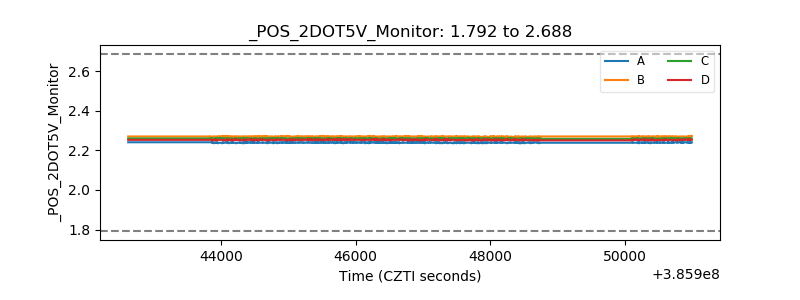 |
| +5 Volts monitor | 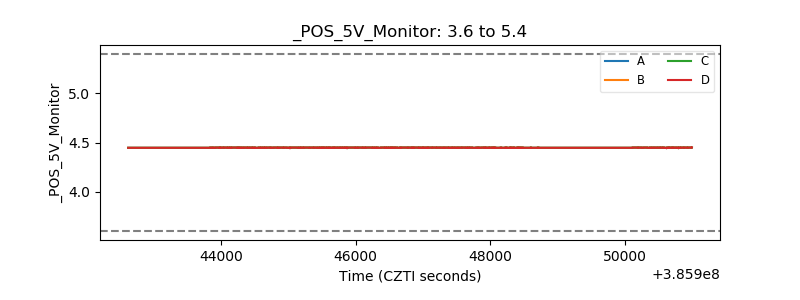 |
| _ROLL_ROT | 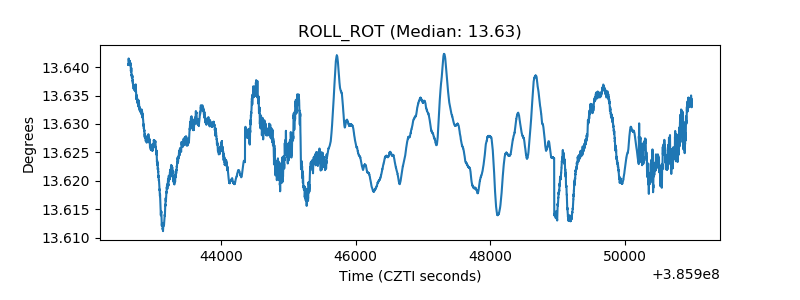 |
| _Roll_DEC | 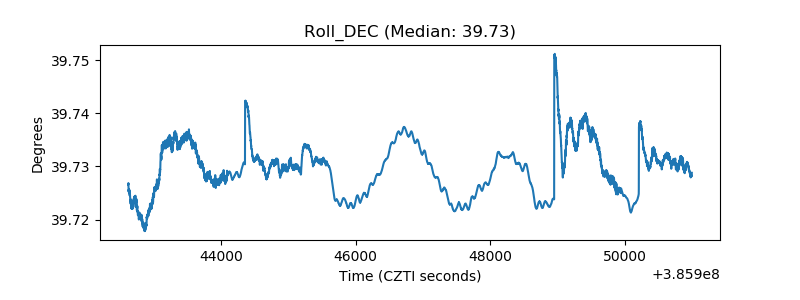 |
| _Roll_RA | 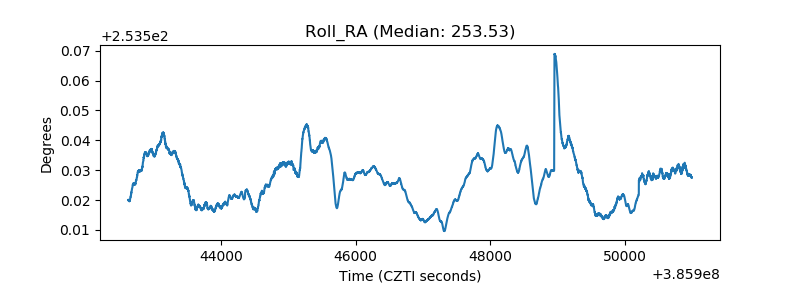 |
| Veto Counter | 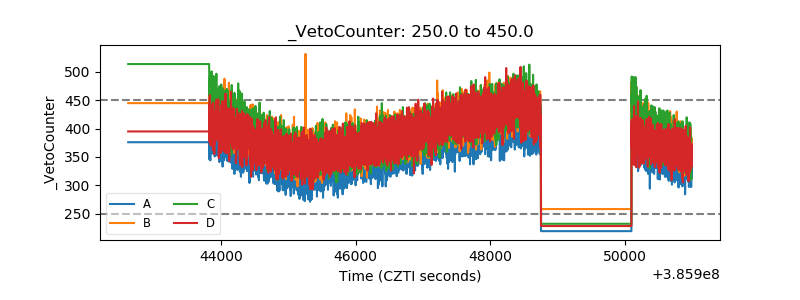 |