| Param | Original file | Final file |
|---|---|---|
| Filename | modeM0/AS1T05_015T01_9000005026_35092cztM0_level2.evt | modeM0/AS1T05_015T01_9000005026_35092cztM0_level2_quad_clean.evt |
| Size (bytes) | 464,486,400 | 83,620,800 |
| Size | 443.0 MB | 79.7 MB |
| Events in quadrant A | 2,624,323 | 539,836 |
| Events in quadrant B | 3,382,382 | 551,424 |
| Events in quadrant C | 3,086,289 | 548,276 |
| Events in quadrant D | 4,600,267 | 507,283 |
| Mode SS | |||
|---|---|---|---|
| Quadrant | BADHDUFLAG | Total packets | Discarded packets |
| A | 0 | 110 | 0 |
| B | 0 | 110 | 0 |
| C | 0 | 110 | 0 |
| D | 0 | 110 | 0 |
| Mode M9 | |||
|---|---|---|---|
| Quadrant | BADHDUFLAG | Total packets | Discarded packets |
| A | 0 | 29 | 0 |
| B | 0 | 29 | 0 |
| C | 0 | 29 | 0 |
| D | 0 | 30 | 0 |
| Mode M0 | |||
|---|---|---|---|
| Quadrant | BADHDUFLAG | Total packets | Discarded packets |
| A | 0 | 11493 | 3 |
| B | 0 | 13780 | 2 |
| C | 0 | 12503 | 2 |
| D | 0 | 17578 | 2 |
| Quadrant | Total seconds | Saturated seconds | Saturation percentage |
|---|---|---|---|
| A | 5514 | 18 | 0.326442% |
| B | 5514 | 246 | 4.461371% |
| C | 5514 | 102 | 1.849837% |
| D | 5514 | 252 | 4.570185% |
Noise dominated data is calculated using 1-second bins in cleaned event files. If a bin has >2000 counts, and if more than 50% of those come from <1% of pixels, then it is considered to be noise-dominated and hence unusable.
| Quadrant | # 1 sec bins | Bins with >0 counts | Bins with >2000 counts | High rate bins dominated by noise | Noise dominated (total time) | Noise dominated (detector-on time) | Marked lightcurve |
|---|---|---|---|---|---|---|---|
| A | 7037 | 5515 | 4 | 4 | 0.06% | 0.07% | 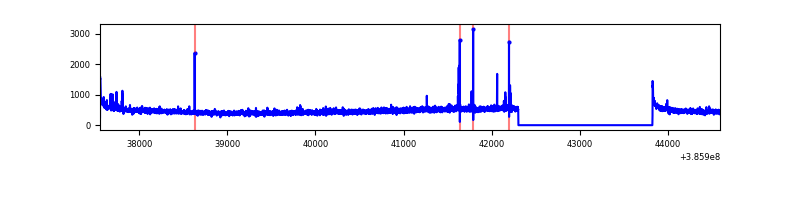 |
| B | 7037 | 5515 | 115 | 115 | 1.63% | 2.09% | 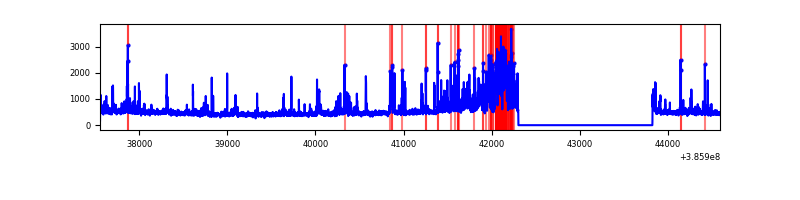 |
| C | 7037 | 5515 | 77 | 77 | 1.09% | 1.40% | 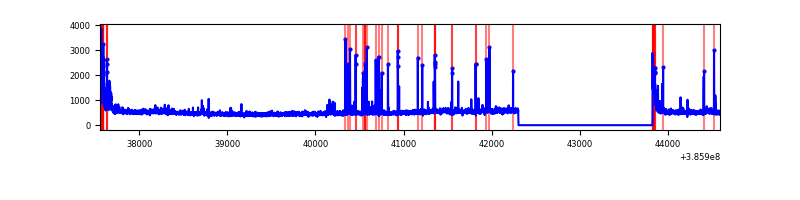 |
| D | 7037 | 5515 | 229 | 229 | 3.25% | 4.15% | 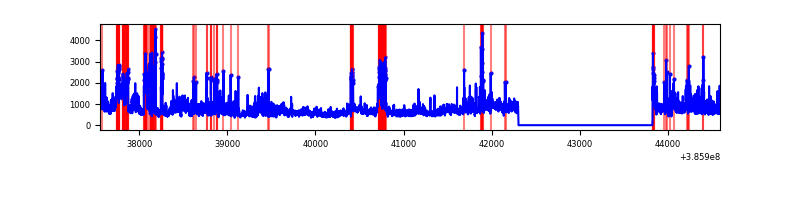 |
Top three noisy pixels from each quadrant. If the there are fewer than three noisy pixels in the level2.evt file, extra rows are filled as -1
| Pixel properties | Quadrant properties | ||||||
|---|---|---|---|---|---|---|---|
| Quadrant | DetID | PixID | Counts | Sigma | Mean | Median | Sigma |
| A | 10 | 83 | 80901 | 617.41 | 639 | 627 | 130.0 |
| A | 9 | 143 | 24391 | 182.78 | 639 | 627 | 130.0 |
| A | 15 | 174 | 15549 | 114.77 | 639 | 627 | 130.0 |
| B | 5 | 172 | 667038 | 5537.09 | 627 | 611 | 120.4 |
| B | 0 | 190 | 76870 | 633.61 | 627 | 611 | 120.4 |
| B | 5 | 255 | 62255 | 512.18 | 627 | 611 | 120.4 |
| C | 15 | 214 | 230101 | 1593.25 | 623 | 628 | 144.0 |
| C | 0 | 10 | 198689 | 1375.15 | 623 | 628 | 144.0 |
| C | 4 | 254 | 99811 | 688.64 | 623 | 628 | 144.0 |
| D | 8 | 195 | 1127440 | 7512.85 | 613 | 595 | 150.0 |
| D | 13 | 249 | 687354 | 4578.73 | 613 | 595 | 150.0 |
| D | 2 | 250 | 130537 | 866.34 | 613 | 595 | 150.0 |
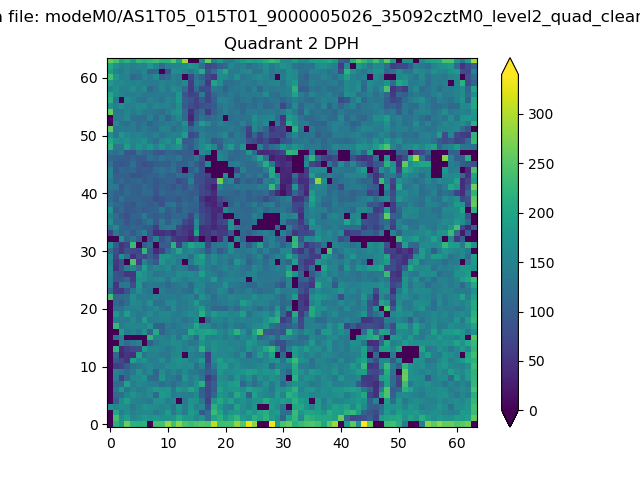
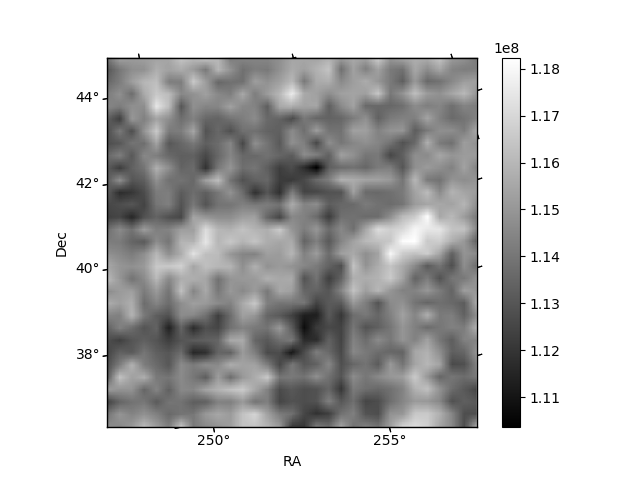
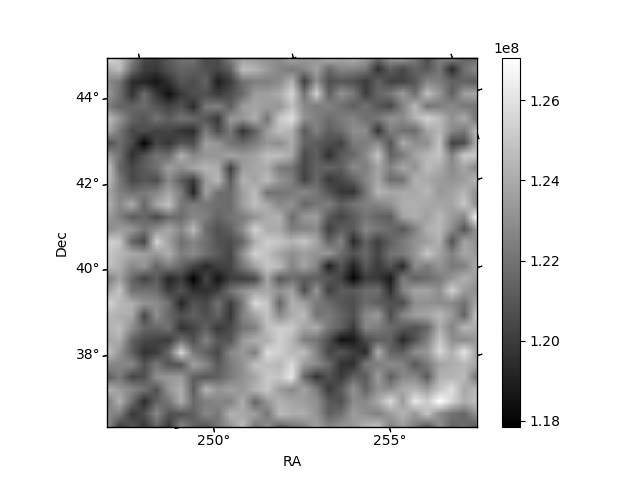
Histogram calculated using DETX and DETY for each event in the final _common_clean file
| Quadrant A | 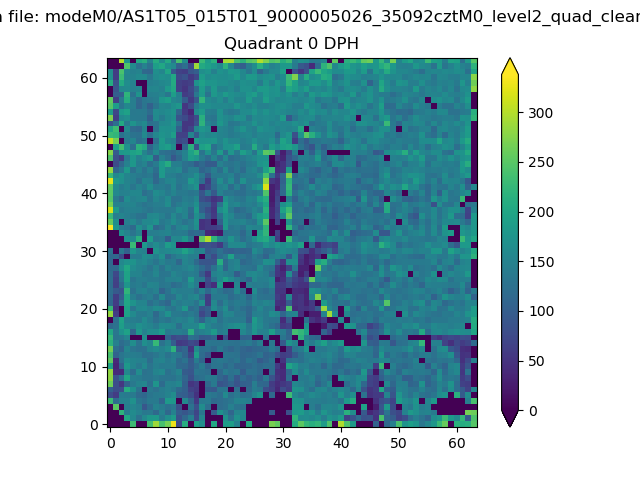 |
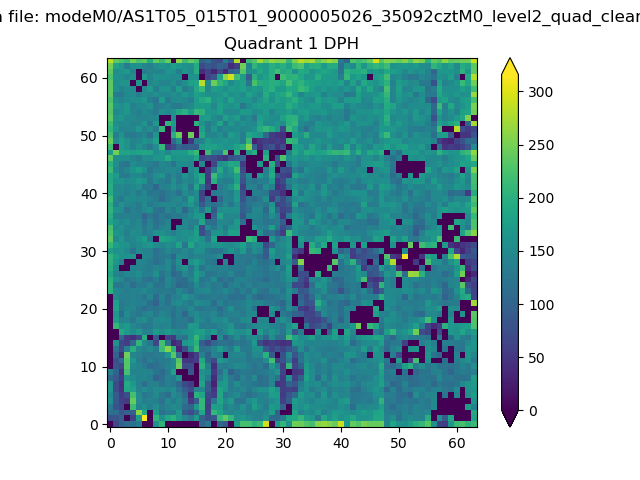 |
Quadrant B |
|---|---|---|---|
| Quadrant D | 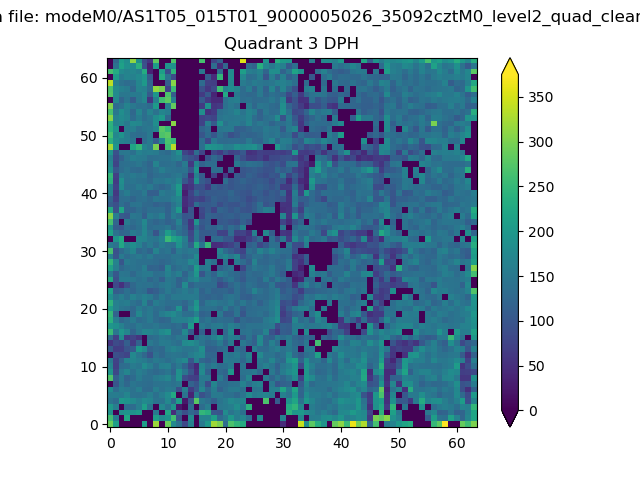 |
 |
Quadrant C |
| Plot type | Count rate plots | Images |
|---|---|---|
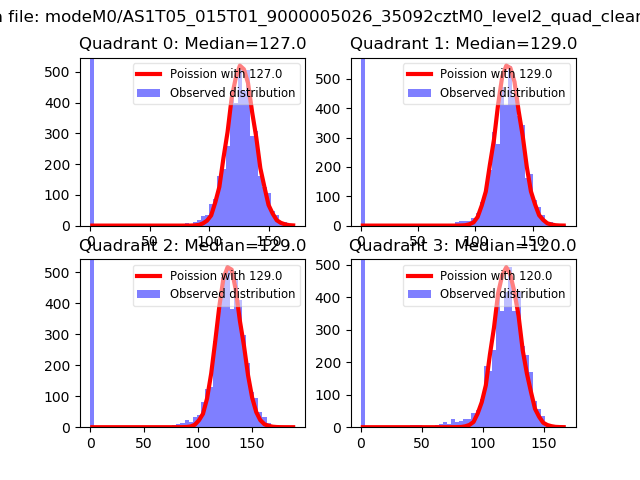
| Comparison with Poisson distribution Blue bars denote a histogram of data divided into 1 sec bins. Red curve is a Poisson curve with rate = median count rate of data. |
 |
 |
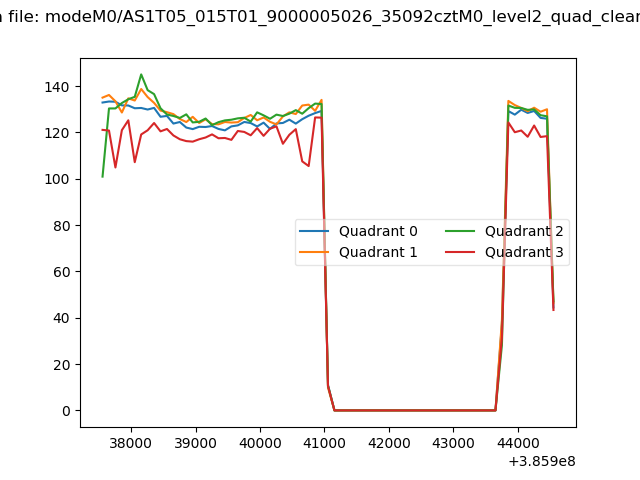
| Quadrant-wise count rates Data is divided into 100 sec bins |
 |
|
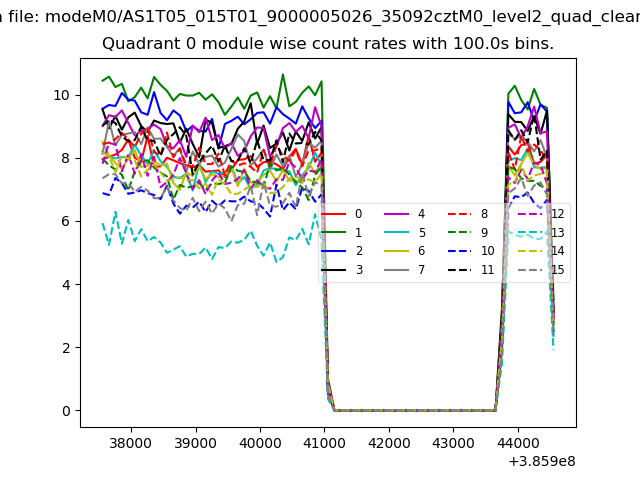
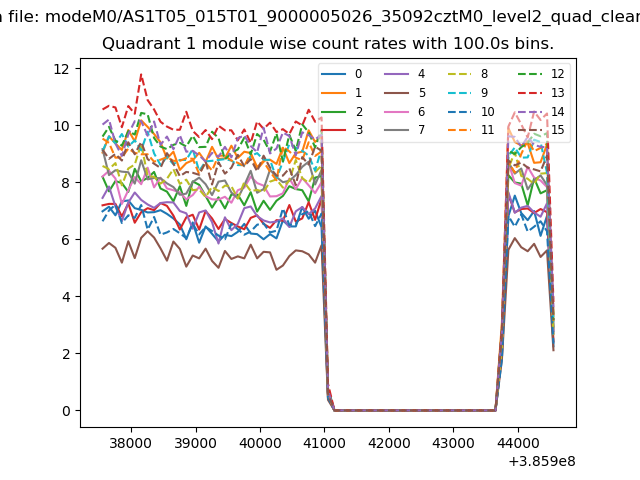
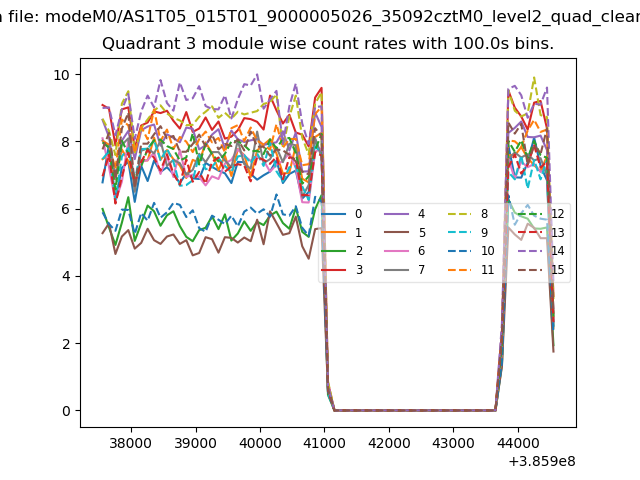
| Module-wise count rates for Quadrant A Data is divided into 100 sec bins |
 |
 |
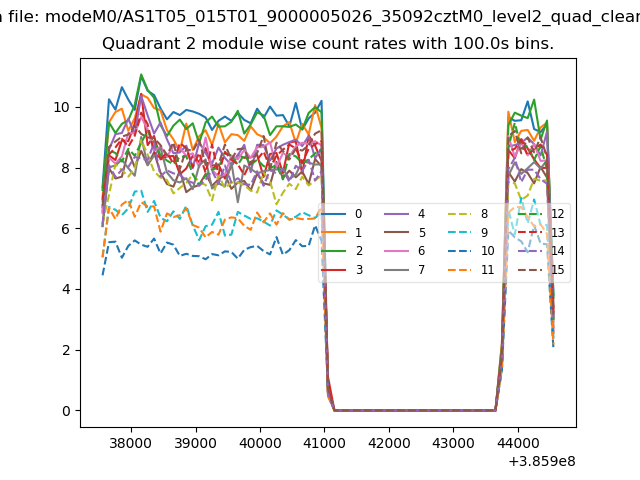
| Module-wise count rates for Quadrant B Data is divided into 100 sec bins |
 |
 |
| Module-wise count rates for Quadrant C Data is divided into 100 sec bins |
 |
 |
| Module-wise count rates for Quadrant D Data is divided into 100 sec bins |
 |
 |
| Parameter | Plot |
|---|---|
| CZT HV Monitor | 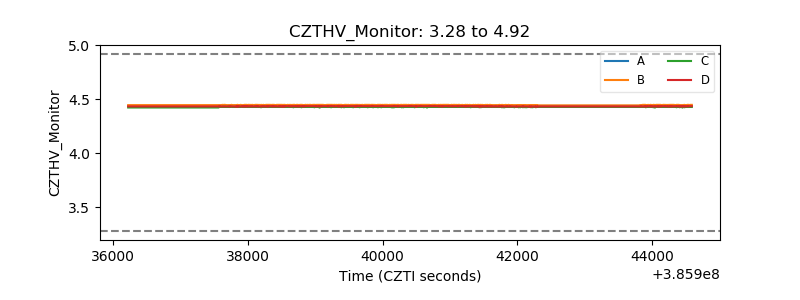 |
| D_VDD | 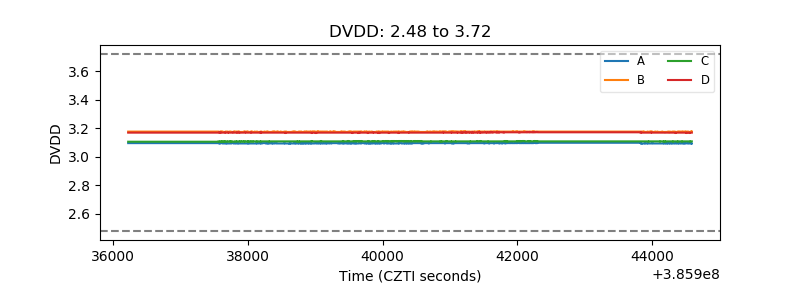 |
| Temperature 1 | 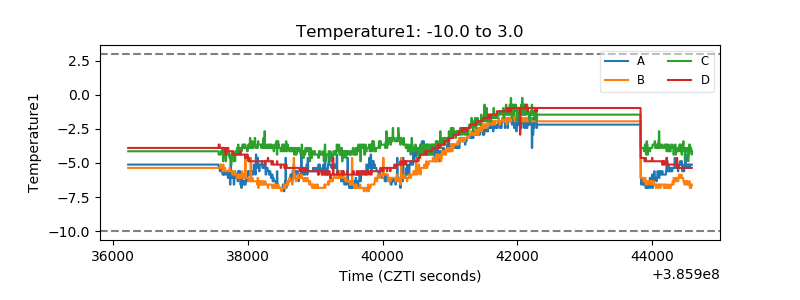 |
| Veto HV Monitor | 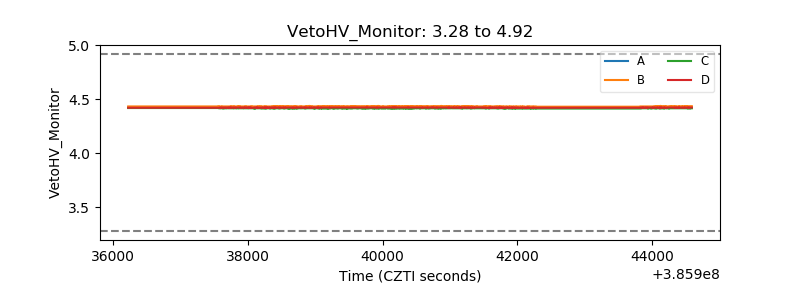 |
| Veto LLD | 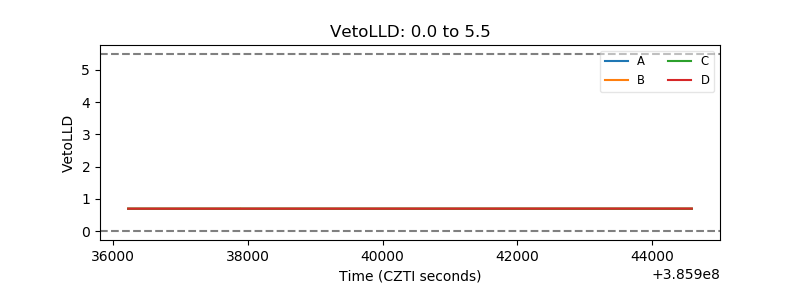 |
| Alpha Counter | 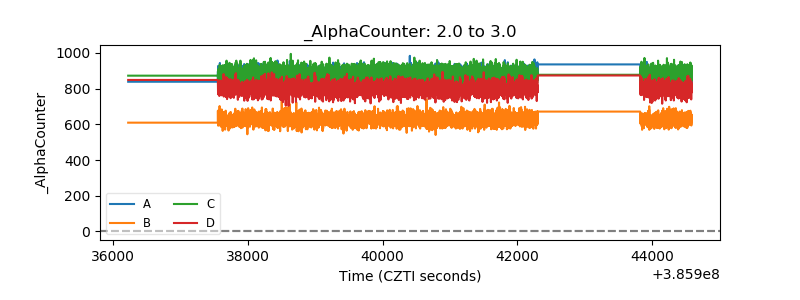 |
| _CPM_Rate | 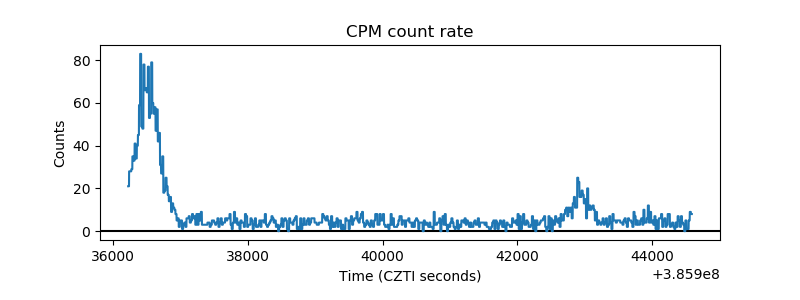 |
| CZT Counter | 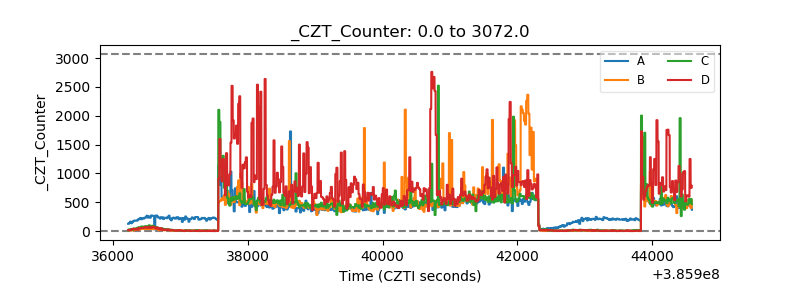 |
| +2.5 Volts monitor |  |
| +5 Volts monitor | 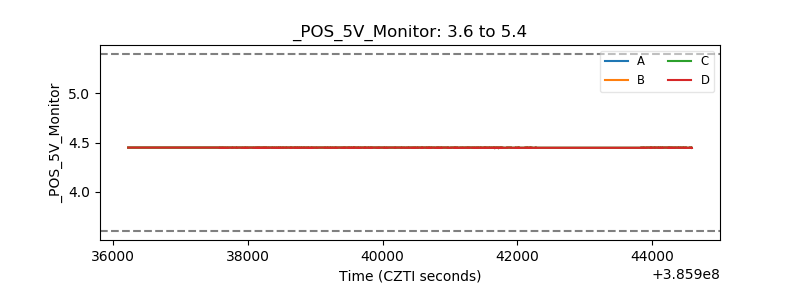 |
| _ROLL_ROT | 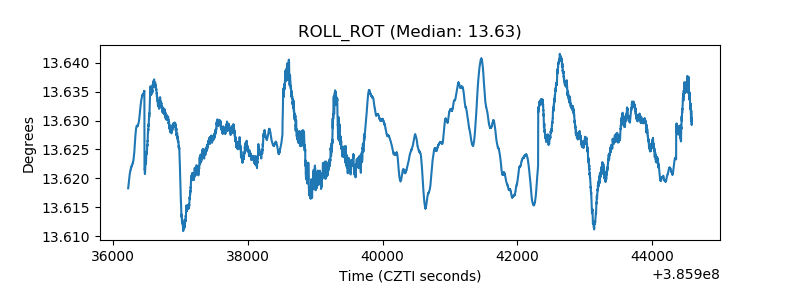 |
| _Roll_DEC | 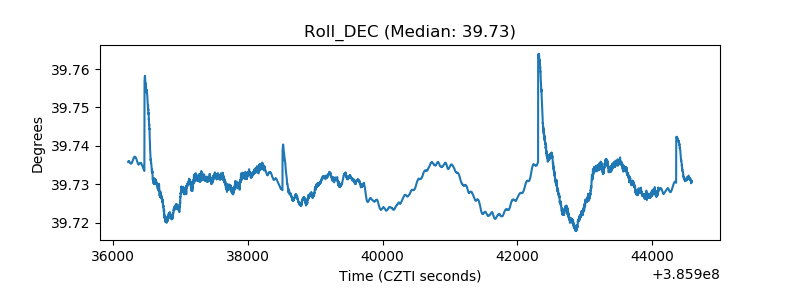 |
| _Roll_RA | 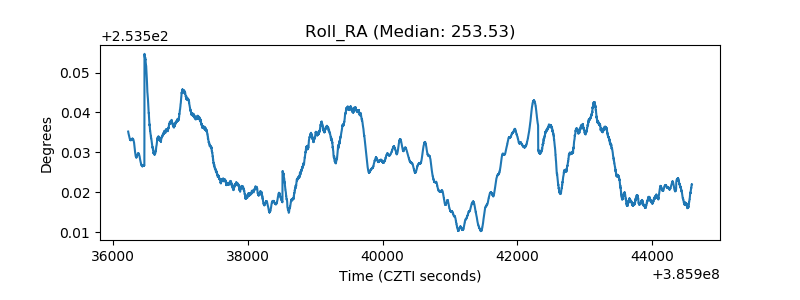 |
| Veto Counter | 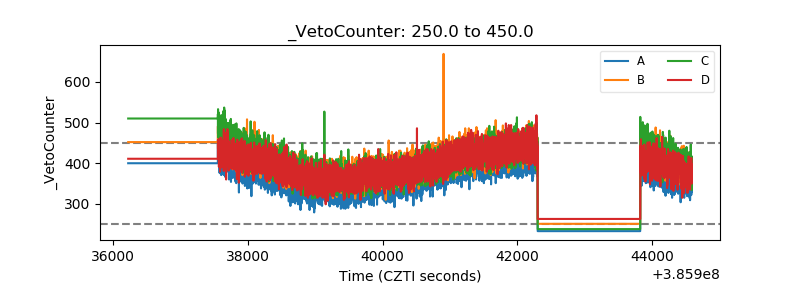 |