| Param | Original file | Final file |
|---|---|---|
| Filename | modeM0/AS1T05_015T01_9000005026_35091cztM0_level2.evt | modeM0/AS1T05_015T01_9000005026_35091cztM0_level2_quad_clean.evt |
| Size (bytes) | 420,517,440 | 91,540,800 |
| Size | 401.0 MB | 87.3 MB |
| Events in quadrant A | 2,482,720 | 607,068 |
| Events in quadrant B | 2,908,293 | 615,603 |
| Events in quadrant C | 2,904,976 | 613,888 |
| Events in quadrant D | 4,086,734 | 572,111 |
| Mode SS | |||
|---|---|---|---|
| Quadrant | BADHDUFLAG | Total packets | Discarded packets |
| A | 0 | 106 | 0 |
| B | 0 | 106 | 0 |
| C | 0 | 106 | 0 |
| D | 0 | 106 | 0 |
| Mode M9 | |||
|---|---|---|---|
| Quadrant | BADHDUFLAG | Total packets | Discarded packets |
| A | 0 | 38 | 0 |
| B | 0 | 38 | 0 |
| C | 0 | 38 | 0 |
| D | 0 | 39 | 0 |
| Mode M0 | |||
|---|---|---|---|
| Quadrant | BADHDUFLAG | Total packets | Discarded packets |
| A | 0 | 10764 | 3 |
| B | 0 | 11954 | 2 |
| C | 0 | 11663 | 2 |
| D | 0 | 15697 | 2 |
| Quadrant | Total seconds | Saturated seconds | Saturation percentage |
|---|---|---|---|
| A | 5189 | 9 | 0.173444% |
| B | 5189 | 144 | 2.775101% |
| C | 5189 | 84 | 1.618809% |
| D | 5189 | 163 | 3.141260% |
Noise dominated data is calculated using 1-second bins in cleaned event files. If a bin has >2000 counts, and if more than 50% of those come from <1% of pixels, then it is considered to be noise-dominated and hence unusable.
| Quadrant | # 1 sec bins | Bins with >0 counts | Bins with >2000 counts | High rate bins dominated by noise | Noise dominated (total time) | Noise dominated (detector-on time) | Marked lightcurve |
|---|---|---|---|---|---|---|---|
| A | 7072 | 5190 | 0 | 0 | 0.00% | 0.00% | 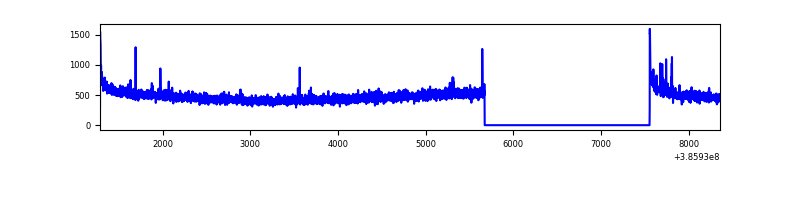 |
| B | 7072 | 5190 | 88 | 88 | 1.24% | 1.70% | 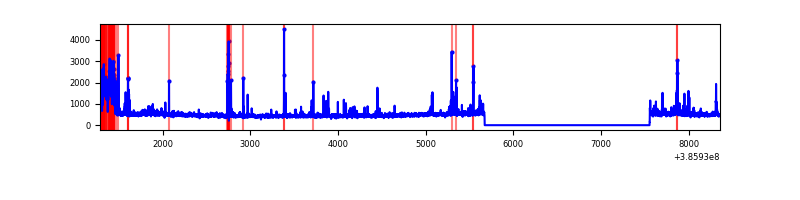 |
| C | 7072 | 5190 | 56 | 56 | 0.79% | 1.08% | 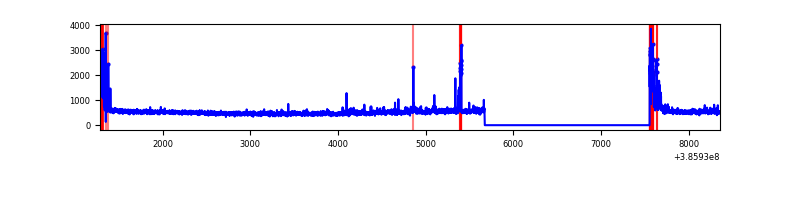 |
| D | 7072 | 5190 | 148 | 148 | 2.09% | 2.85% | 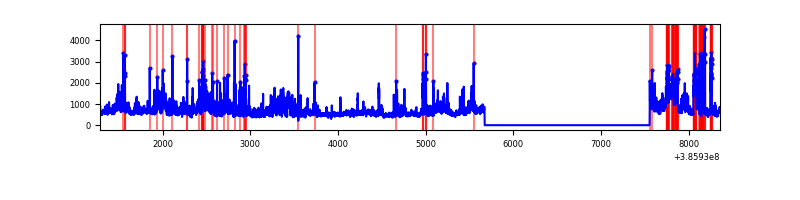 |
Top three noisy pixels from each quadrant. If the there are fewer than three noisy pixels in the level2.evt file, extra rows are filled as -1
| Pixel properties | Quadrant properties | ||||||
|---|---|---|---|---|---|---|---|
| Quadrant | DetID | PixID | Counts | Sigma | Mean | Median | Sigma |
| A | 10 | 83 | 79184 | 635.79 | 612 | 601 | 123.6 |
| A | 13 | 6 | 12900 | 99.51 | 612 | 601 | 123.6 |
| A | 7 | 16 | 12738 | 98.2 | 612 | 601 | 123.6 |
| B | 5 | 172 | 349109 | 3005.31 | 606 | 590 | 116.0 |
| B | 5 | 255 | 125637 | 1078.29 | 606 | 590 | 116.0 |
| B | 12 | 111 | 14094 | 116.45 | 606 | 590 | 116.0 |
| C | 15 | 214 | 218751 | 1568.0 | 599 | 606 | 139.1 |
| C | 0 | 10 | 215174 | 1542.29 | 599 | 606 | 139.1 |
| C | 12 | 250 | 53951 | 383.44 | 599 | 606 | 139.1 |
| D | 8 | 195 | 780446 | 5472.67 | 590 | 575 | 142.5 |
| D | 13 | 249 | 449231 | 3148.4 | 590 | 575 | 142.5 |
| D | 5 | 223 | 262731 | 1839.65 | 590 | 575 | 142.5 |
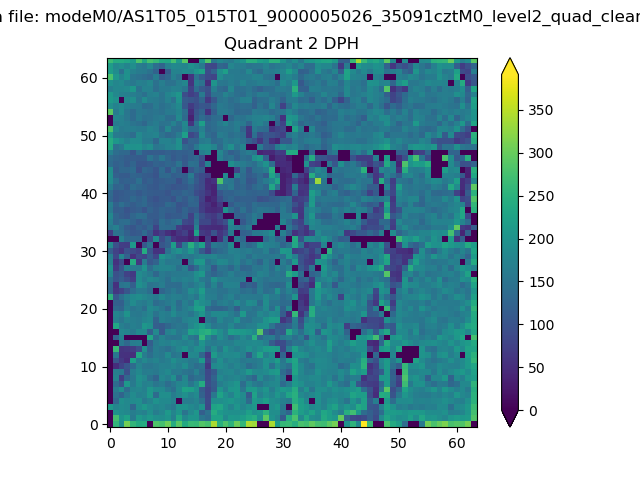
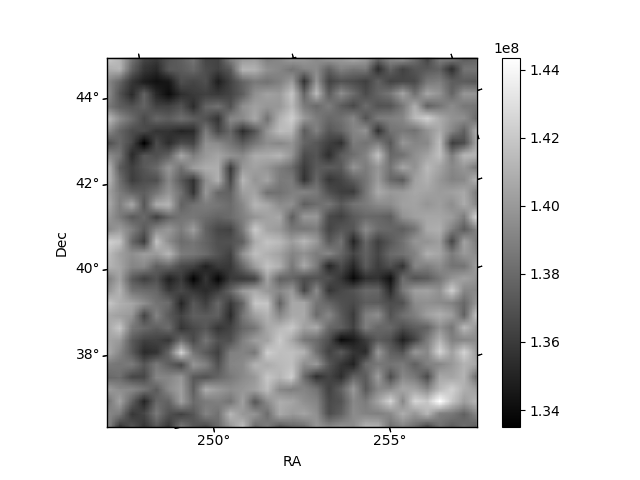
Histogram calculated using DETX and DETY for each event in the final _common_clean file
| Quadrant A | 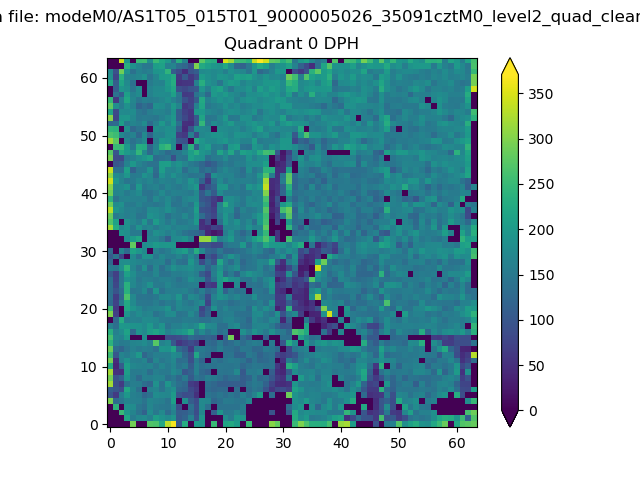 |
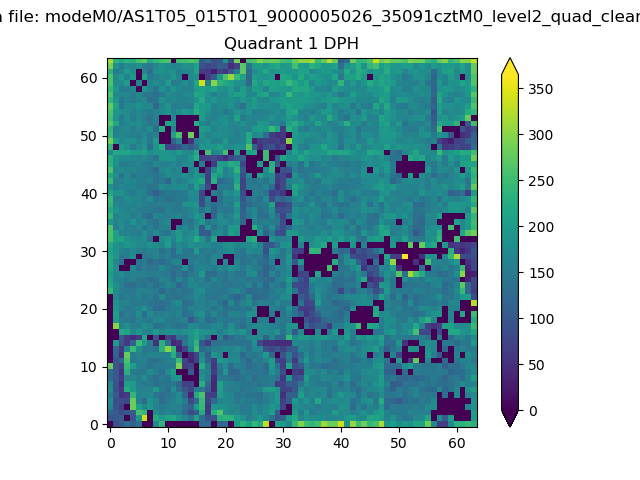 |
Quadrant B |
|---|---|---|---|
| Quadrant D | 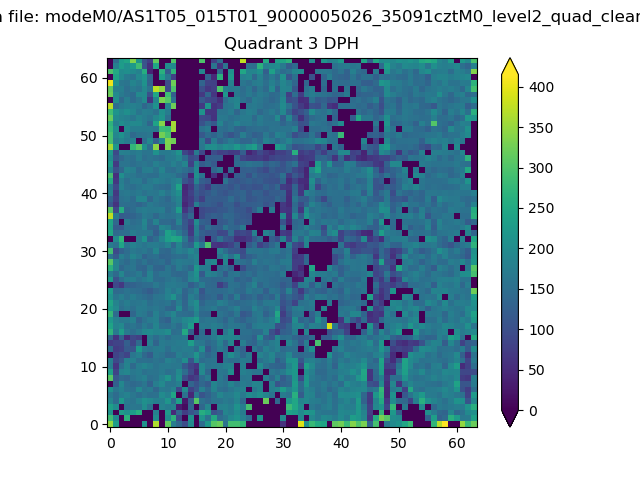 |
 |
Quadrant C |
| Plot type | Count rate plots | Images |
|---|---|---|
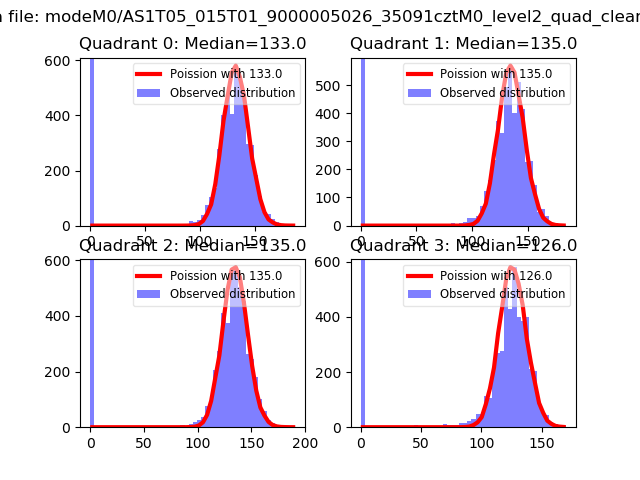
| Comparison with Poisson distribution Blue bars denote a histogram of data divided into 1 sec bins. Red curve is a Poisson curve with rate = median count rate of data. |
 |
 |
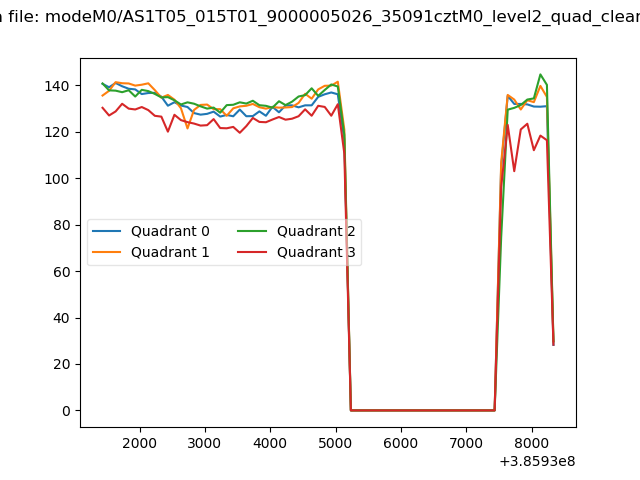
| Quadrant-wise count rates Data is divided into 100 sec bins |
 |
|
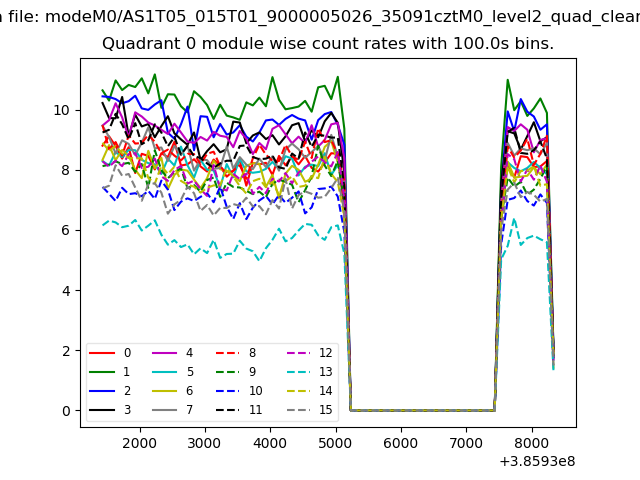
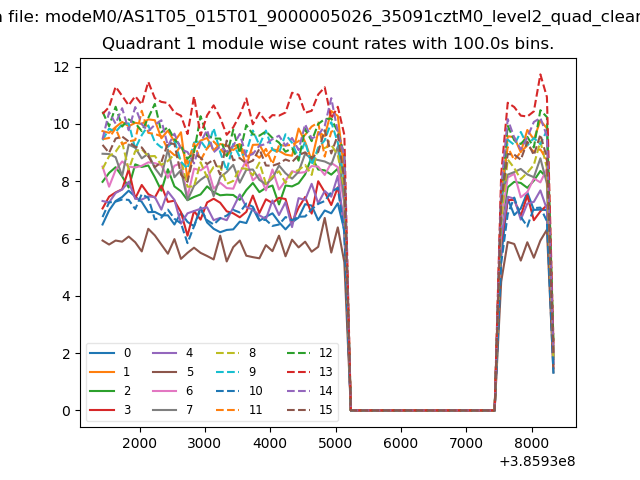
| Module-wise count rates for Quadrant A Data is divided into 100 sec bins |
 |
 |
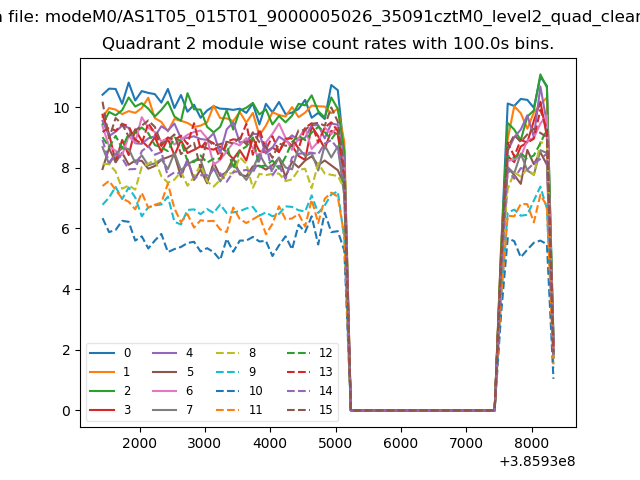
| Module-wise count rates for Quadrant B Data is divided into 100 sec bins |
 |
 |
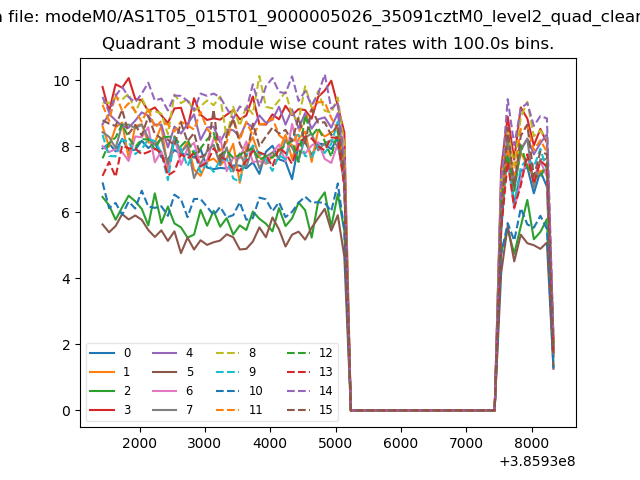
| Module-wise count rates for Quadrant C Data is divided into 100 sec bins |
 |
 |
| Module-wise count rates for Quadrant D Data is divided into 100 sec bins |
 |
 |
| Parameter | Plot |
|---|---|
| CZT HV Monitor | 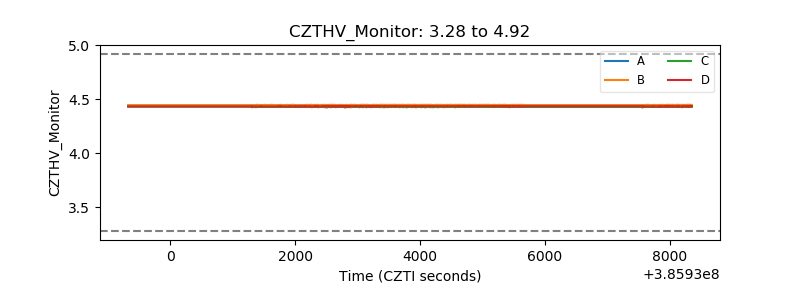 |
| D_VDD | 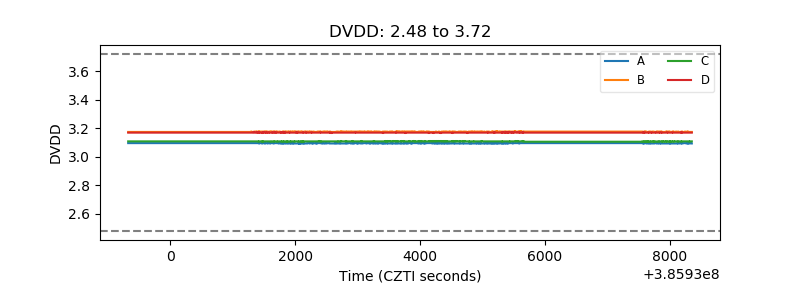 |
| Temperature 1 | 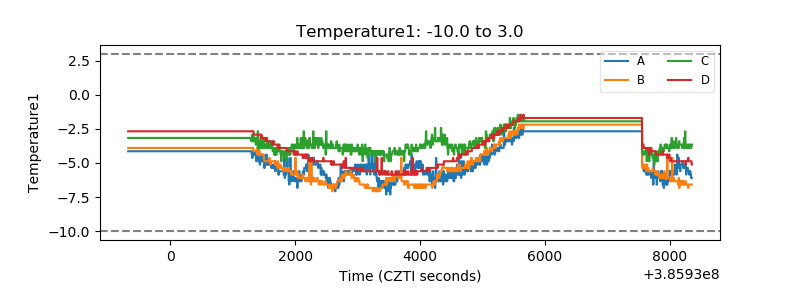 |
| Veto HV Monitor |  |
| Veto LLD | 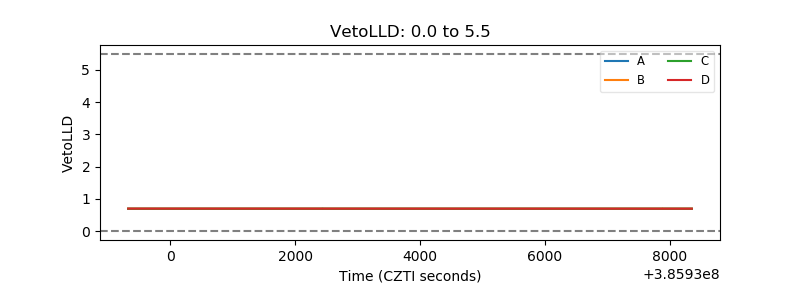 |
| Alpha Counter | 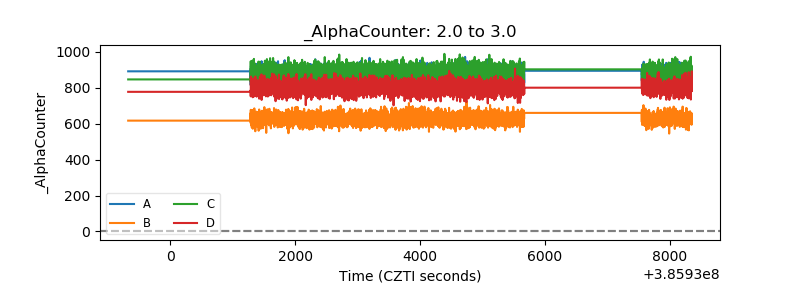 |
| _CPM_Rate | 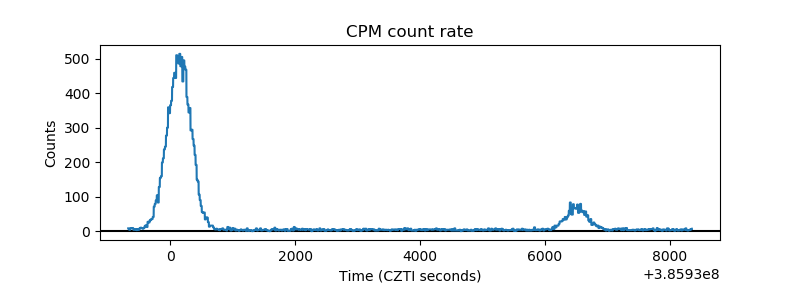 |
| CZT Counter | 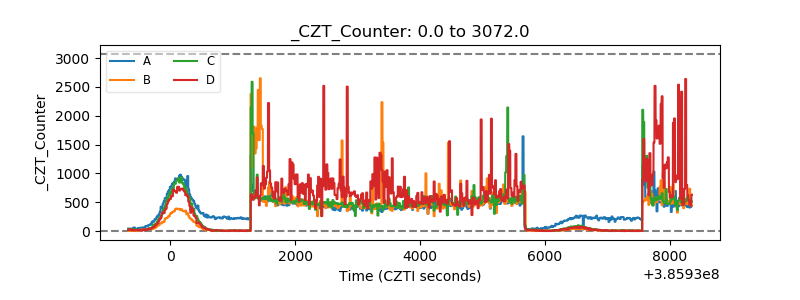 |
| +2.5 Volts monitor | 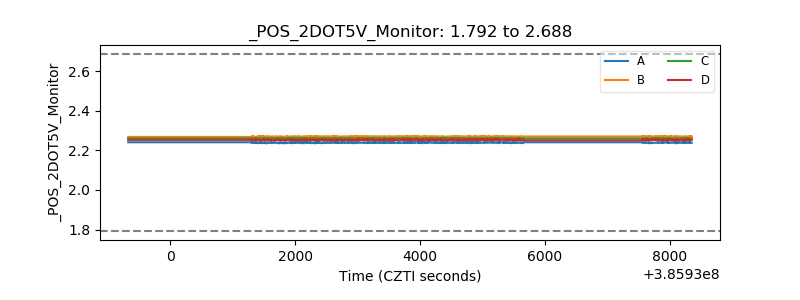 |
| +5 Volts monitor | 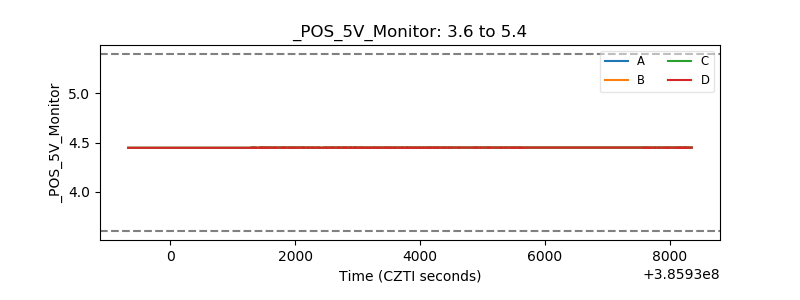 |
| _ROLL_ROT | 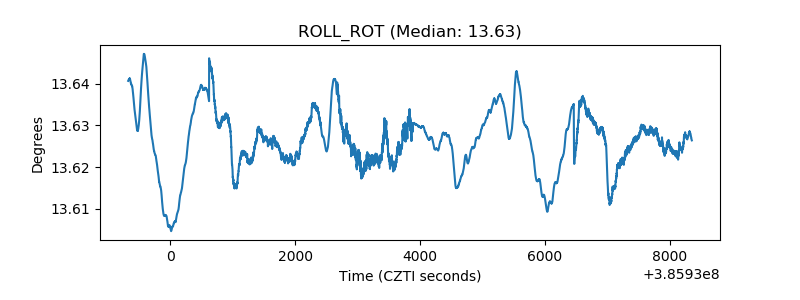 |
| _Roll_DEC | 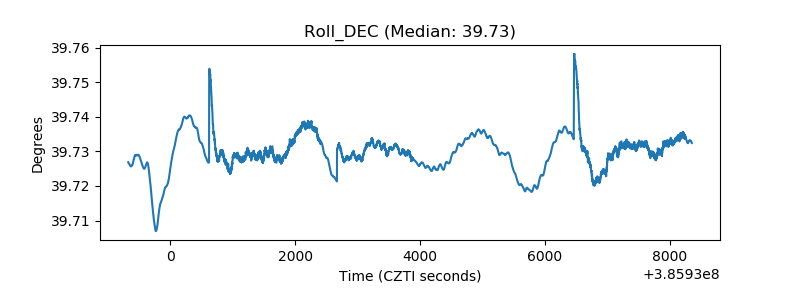 |
| _Roll_RA | 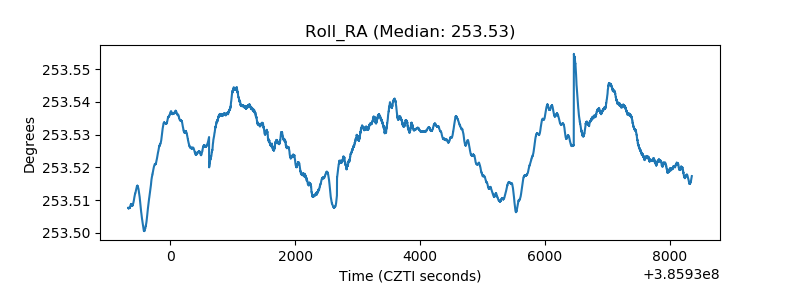 |
| Veto Counter | 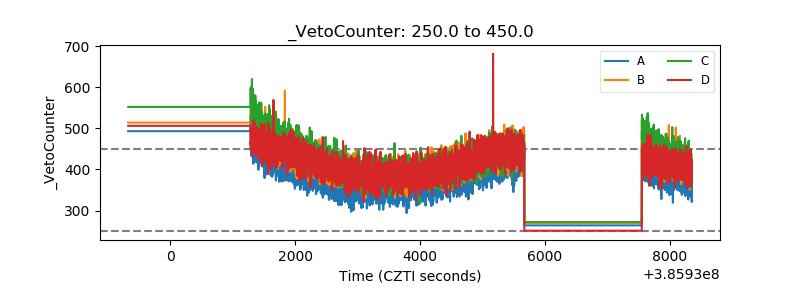 |