| Param | Original file | Final file |
|---|---|---|
| Filename | modeM0/AS1T05_015T01_9000005026_35089cztM0_level2.evt | modeM0/AS1T05_015T01_9000005026_35089cztM0_level2_quad_clean.evt |
| Size (bytes) | 449,006,400 | 74,759,040 |
| Size | 428.2 MB | 71.3 MB |
| Events in quadrant A | 2,692,655 | 486,535 |
| Events in quadrant B | 3,570,400 | 483,501 |
| Events in quadrant C | 2,842,027 | 494,089 |
| Events in quadrant D | 4,162,895 | 457,873 |
| Mode SS | |||
|---|---|---|---|
| Quadrant | BADHDUFLAG | Total packets | Discarded packets |
| A | 0 | 100 | 0 |
| B | 0 | 100 | 0 |
| C | 0 | 100 | 0 |
| D | 0 | 100 | 0 |
| Mode M9 | |||
|---|---|---|---|
| Quadrant | BADHDUFLAG | Total packets | Discarded packets |
| A | 0 | 26 | 0 |
| B | 0 | 26 | 0 |
| C | 0 | 26 | 0 |
| D | 0 | 27 | 0 |
| Mode M0 | |||
|---|---|---|---|
| Quadrant | BADHDUFLAG | Total packets | Discarded packets |
| A | 0 | 11092 | 3 |
| B | 0 | 13666 | 2 |
| C | 0 | 11313 | 2 |
| D | 0 | 15918 | 2 |
| Quadrant | Total seconds | Saturated seconds | Saturation percentage |
|---|---|---|---|
| A | 4868 | 18 | 0.369762% |
| B | 4868 | 298 | 6.121611% |
| C | 4868 | 65 | 1.335251% |
| D | 4868 | 242 | 4.971241% |
Noise dominated data is calculated using 1-second bins in cleaned event files. If a bin has >2000 counts, and if more than 50% of those come from <1% of pixels, then it is considered to be noise-dominated and hence unusable.
| Quadrant | # 1 sec bins | Bins with >0 counts | Bins with >2000 counts | High rate bins dominated by noise | Noise dominated (total time) | Noise dominated (detector-on time) | Marked lightcurve |
|---|---|---|---|---|---|---|---|
| A | 6990 | 4869 | 5 | 5 | 0.07% | 0.10% | 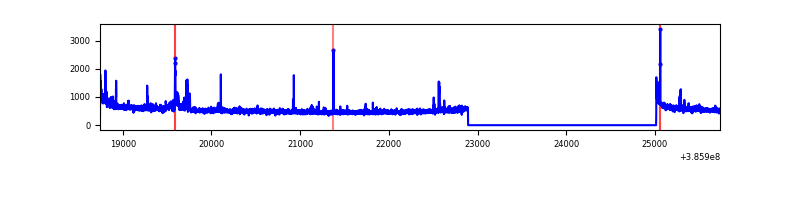 |
| B | 6990 | 4869 | 193 | 193 | 2.76% | 3.96% | 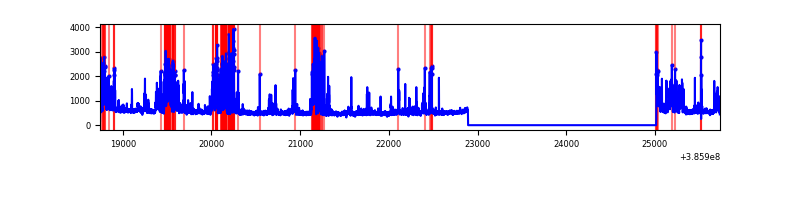 |
| C | 6990 | 4869 | 41 | 41 | 0.59% | 0.84% | 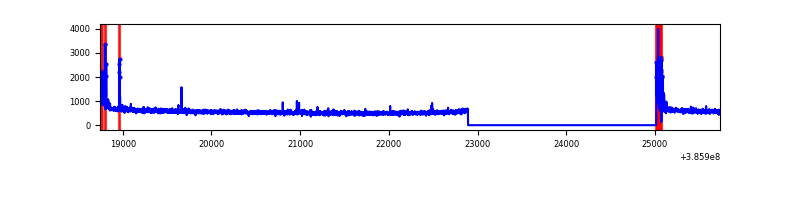 |
| D | 6990 | 4869 | 234 | 234 | 3.35% | 4.81% | 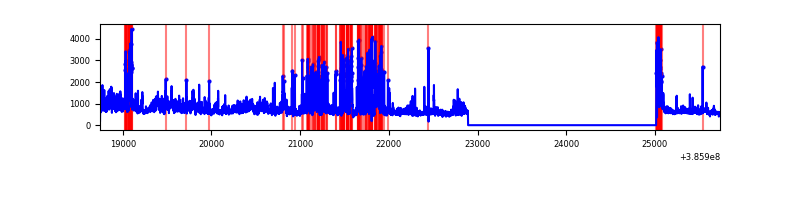 |
Top three noisy pixels from each quadrant. If the there are fewer than three noisy pixels in the level2.evt file, extra rows are filled as -1
| Pixel properties | Quadrant properties | ||||||
|---|---|---|---|---|---|---|---|
| Quadrant | DetID | PixID | Counts | Sigma | Mean | Median | Sigma |
| A | 10 | 83 | 80399 | 639.25 | 636 | 624 | 124.8 |
| A | 9 | 143 | 68263 | 542.0 | 636 | 624 | 124.8 |
| A | 15 | 174 | 38730 | 305.35 | 636 | 624 | 124.8 |
| B | 5 | 172 | 989911 | 8467.75 | 624 | 609 | 116.8 |
| B | 5 | 255 | 47182 | 398.63 | 624 | 609 | 116.8 |
| B | 15 | 85 | 39117 | 329.6 | 624 | 609 | 116.8 |
| C | 15 | 214 | 204420 | 1420.57 | 627 | 633 | 143.5 |
| C | 0 | 10 | 159880 | 1110.09 | 627 | 633 | 143.5 |
| C | 12 | 250 | 16667 | 111.77 | 627 | 633 | 143.5 |
| D | 8 | 195 | 770468 | 5193.22 | 613 | 596 | 148.2 |
| D | 7 | 80 | 509854 | 3435.23 | 613 | 596 | 148.2 |
| D | 13 | 249 | 182377 | 1226.22 | 613 | 596 | 148.2 |
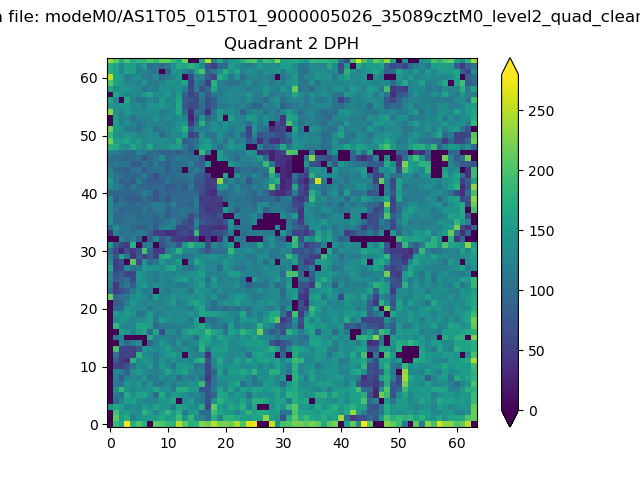
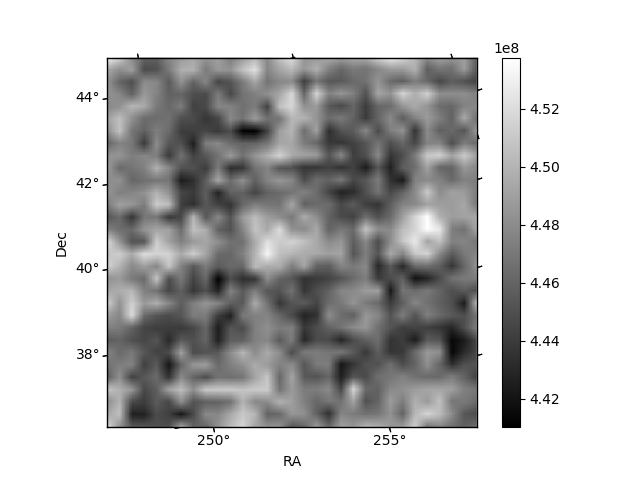
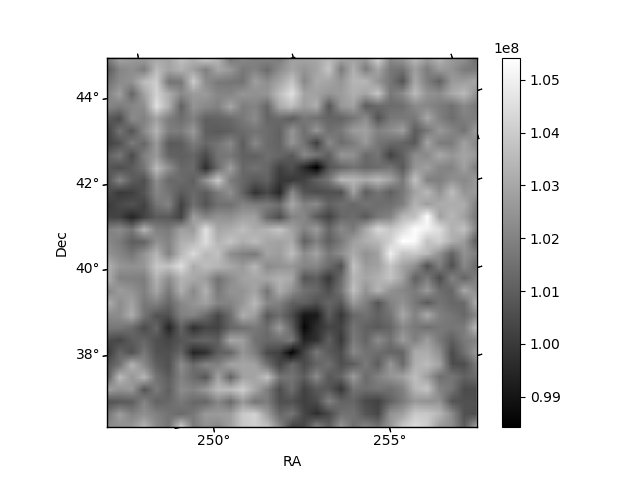
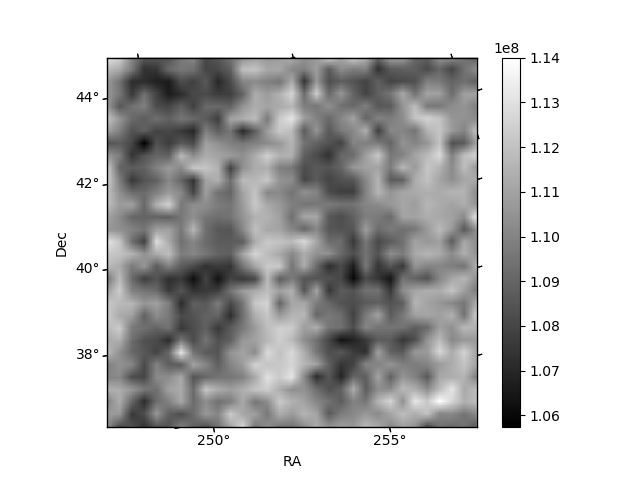
Histogram calculated using DETX and DETY for each event in the final _common_clean file
| Quadrant A | 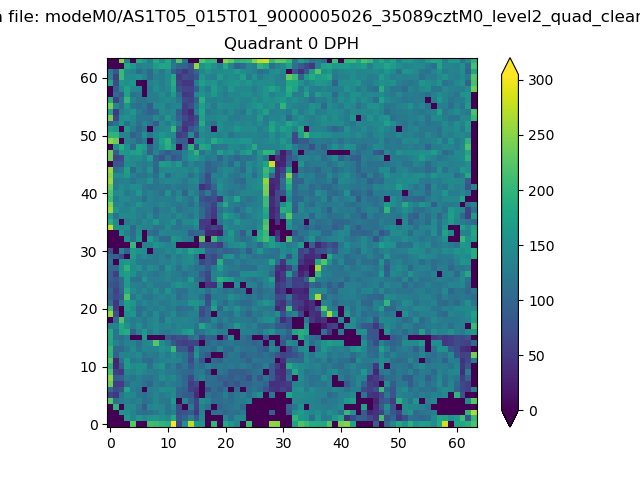 |
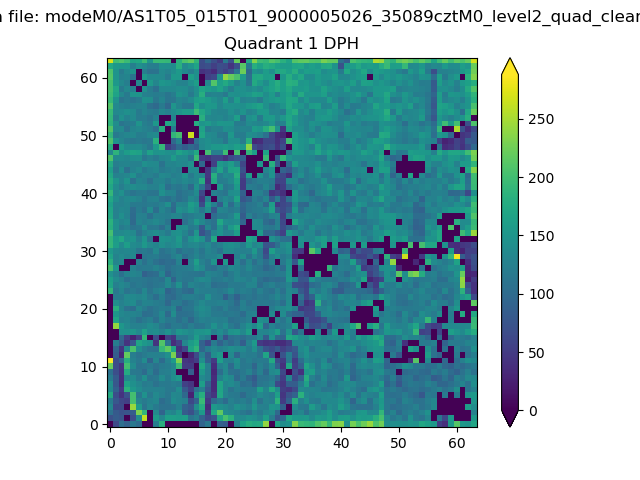 |
Quadrant B |
|---|---|---|---|
| Quadrant D | 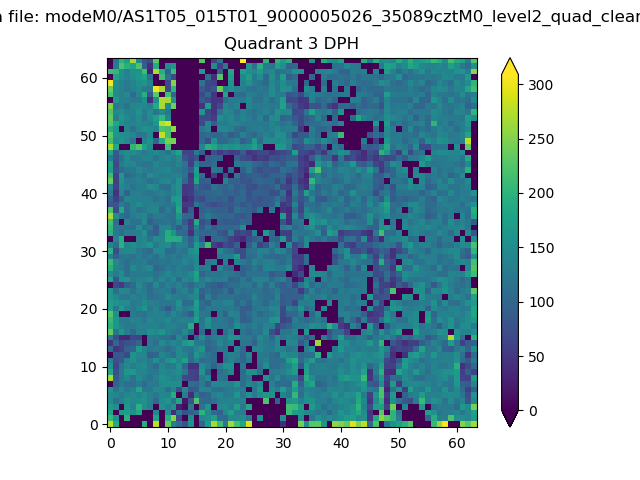 |
 |
Quadrant C |
| Plot type | Count rate plots | Images |
|---|---|---|
| Comparison with Poisson distribution Blue bars denote a histogram of data divided into 1 sec bins. Red curve is a Poisson curve with rate = median count rate of data. |
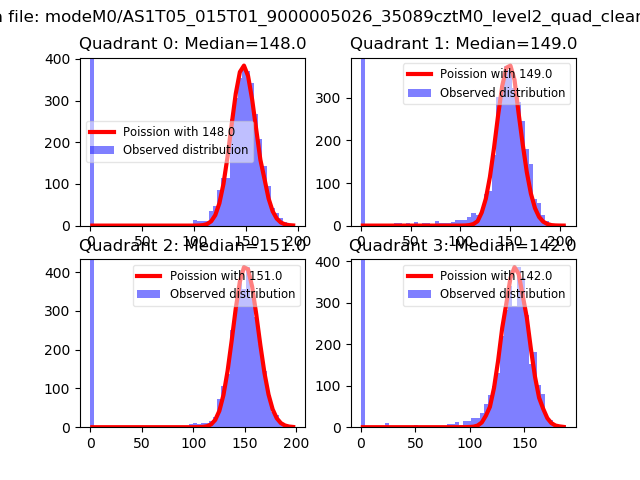 |
 |
| Quadrant-wise count rates Data is divided into 100 sec bins |
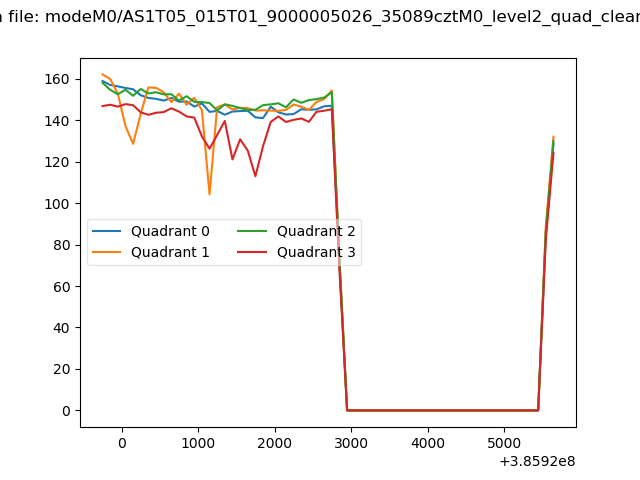 |
|
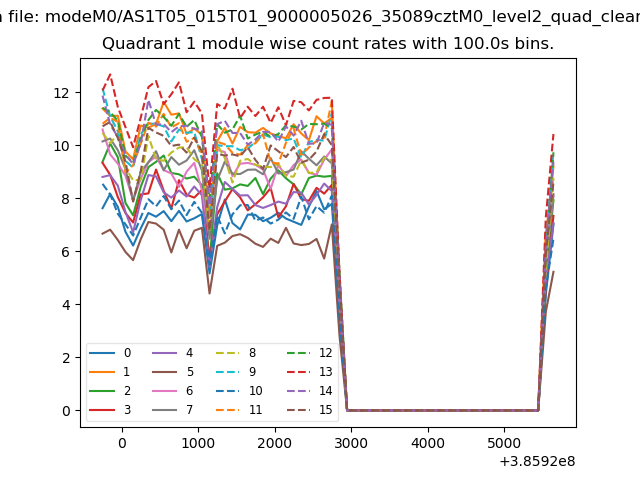
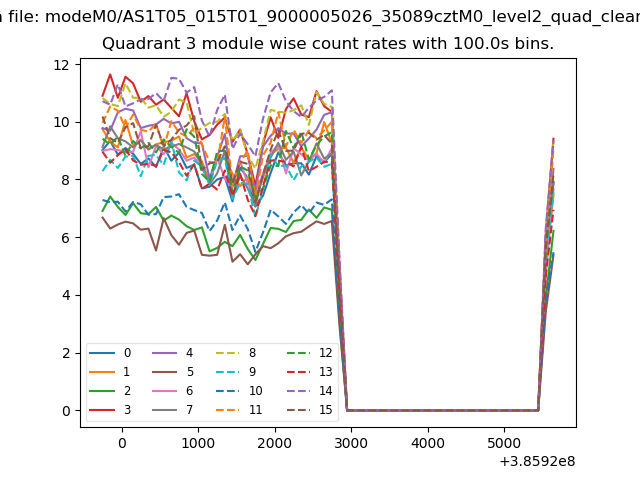
| Module-wise count rates for Quadrant A Data is divided into 100 sec bins |
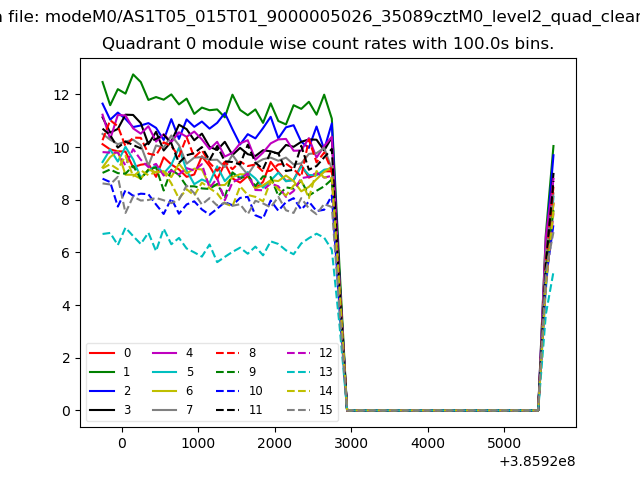 |
 |
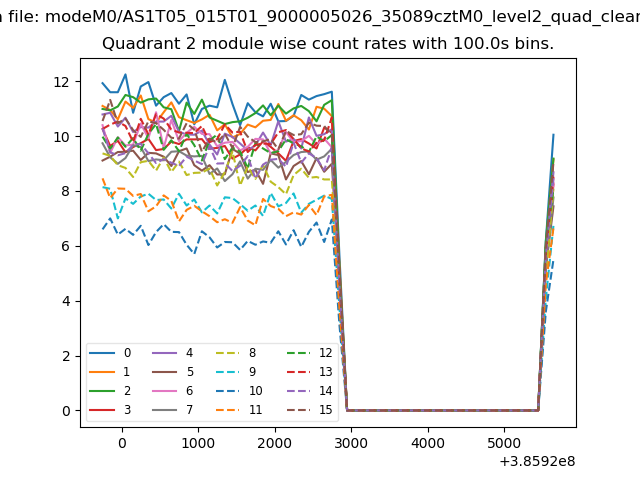
| Module-wise count rates for Quadrant B Data is divided into 100 sec bins |
 |
 |
| Module-wise count rates for Quadrant C Data is divided into 100 sec bins |
 |
 |
| Module-wise count rates for Quadrant D Data is divided into 100 sec bins |
 |
 |
| Parameter | Plot |
|---|---|
| CZT HV Monitor | 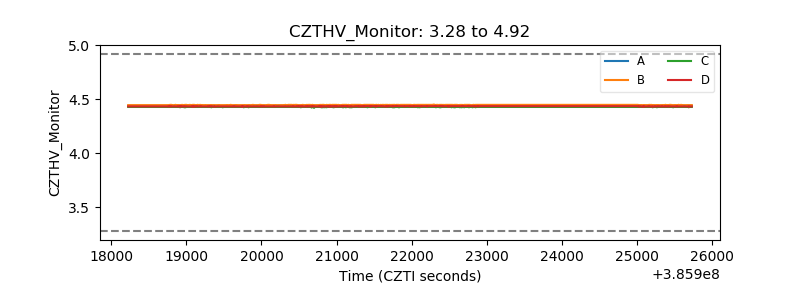 |
| D_VDD | 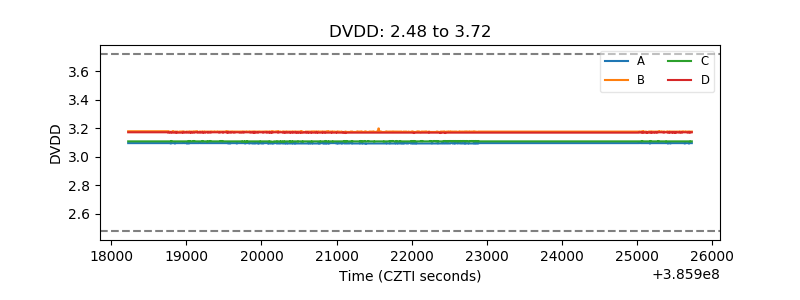 |
| Temperature 1 | 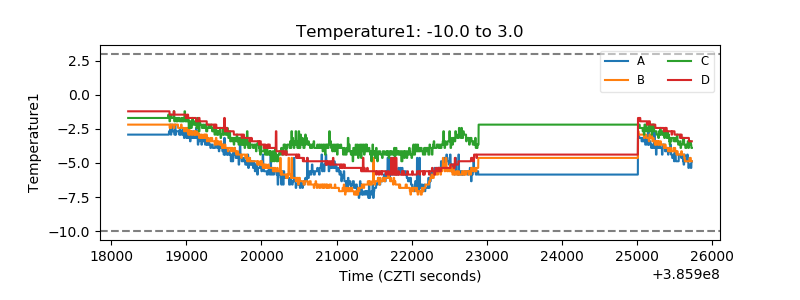 |
| Veto HV Monitor | 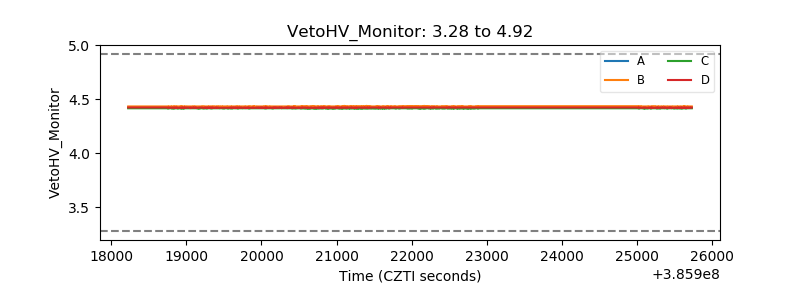 |
| Veto LLD | 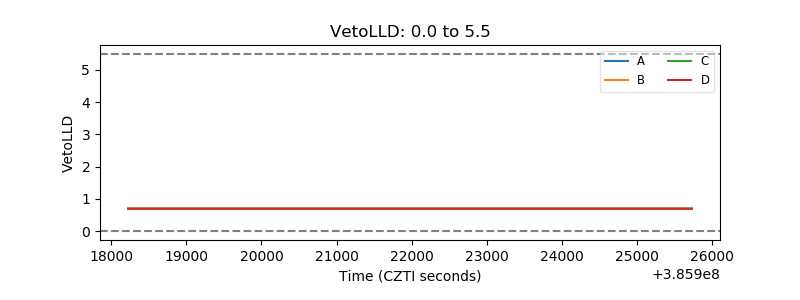 |
| Alpha Counter | 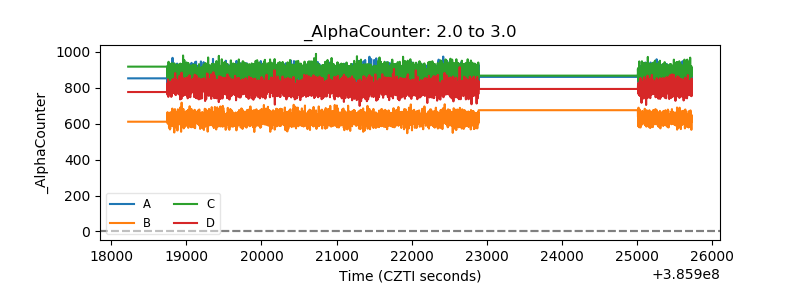 |
| _CPM_Rate | 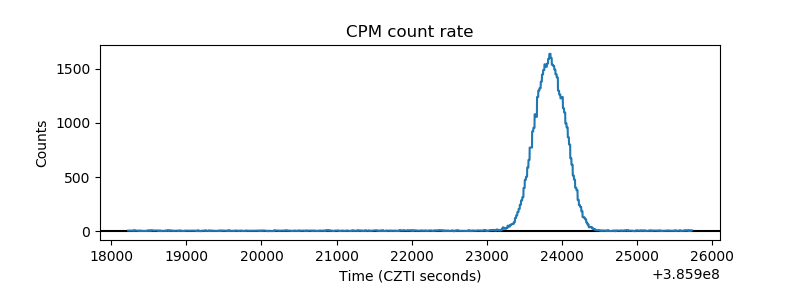 |
| CZT Counter | 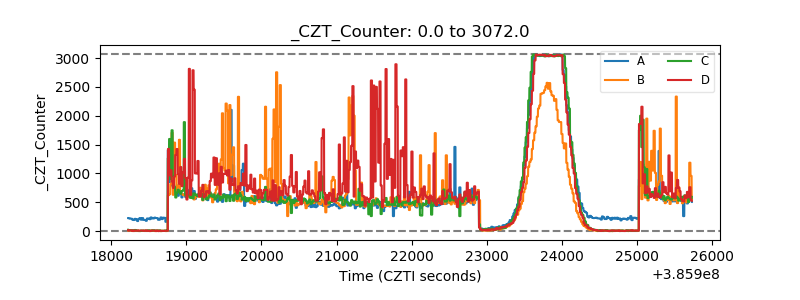 |
| +2.5 Volts monitor | 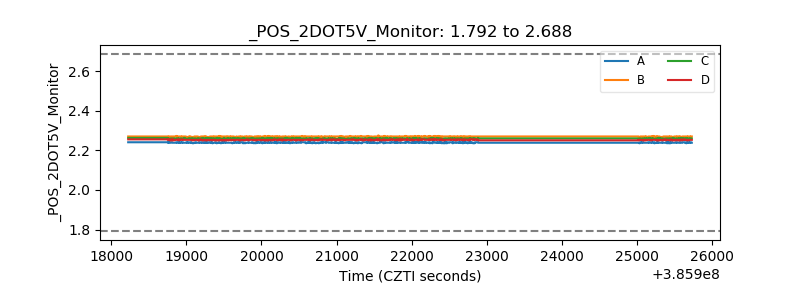 |
| +5 Volts monitor | 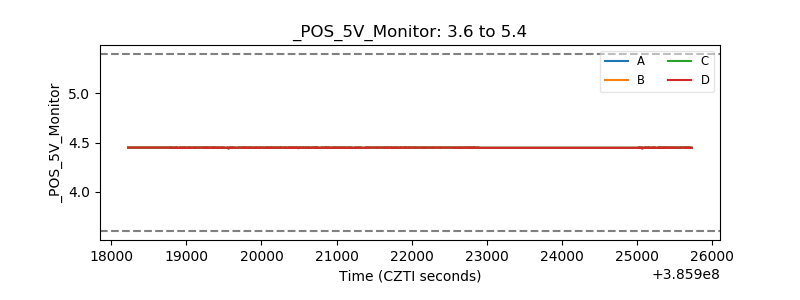 |
| _ROLL_ROT | 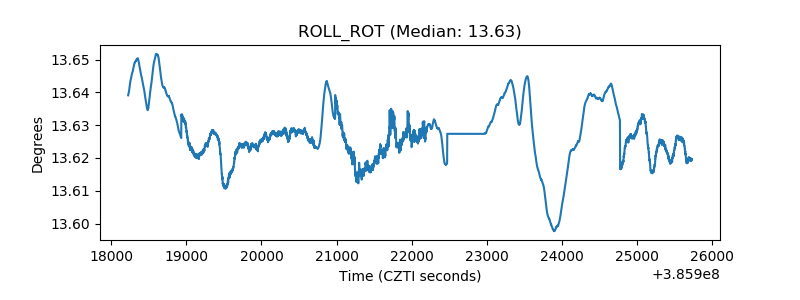 |
| _Roll_DEC | 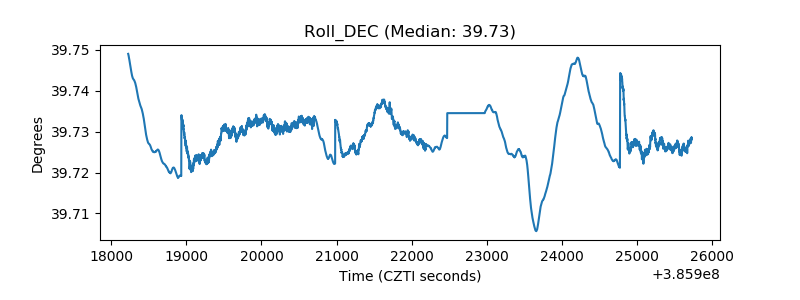 |
| _Roll_RA | 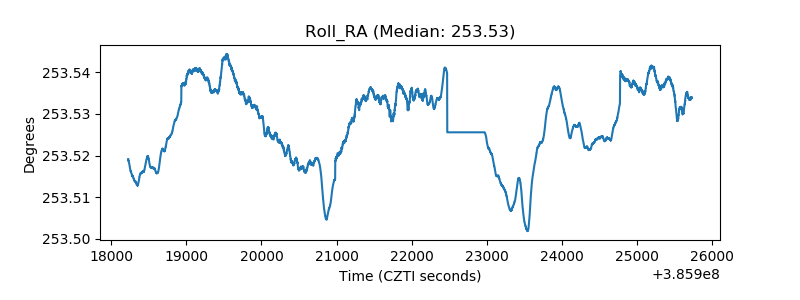 |
| Veto Counter | 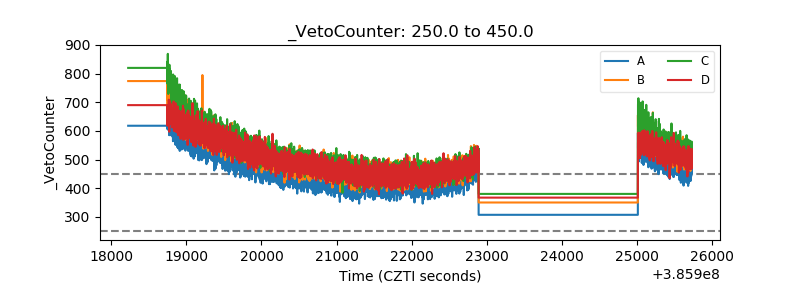 |