| Param | Original file | Final file |
|---|---|---|
| Filename | modeM0/AS1T05_015T01_9000005026_35086cztM0_level2.evt | modeM0/AS1T05_015T01_9000005026_35086cztM0_level2_quad_clean.evt |
| Size (bytes) | 508,443,840 | 54,659,520 |
| Size | 484.9 MB | 52.1 MB |
| Events in quadrant A | 2,904,343 | 324,440 |
| Events in quadrant B | 3,853,221 | 324,706 |
| Events in quadrant C | 3,033,678 | 323,591 |
| Events in quadrant D | 5,236,171 | 298,636 |
| Mode SS | |||
|---|---|---|---|
| Quadrant | BADHDUFLAG | Total packets | Discarded packets |
| A | 0 | 110 | 0 |
| B | 0 | 110 | 0 |
| C | 0 | 110 | 0 |
| D | 0 | 110 | 0 |
| Mode M9 | |||
|---|---|---|---|
| Quadrant | BADHDUFLAG | Total packets | Discarded packets |
| A | 0 | 22 | 0 |
| B | 0 | 22 | 0 |
| C | 0 | 22 | 0 |
| D | 0 | 23 | 0 |
| Mode M0 | |||
|---|---|---|---|
| Quadrant | BADHDUFLAG | Total packets | Discarded packets |
| A | 0 | 11958 | 3 |
| B | 0 | 14973 | 2 |
| C | 0 | 12108 | 2 |
| D | 0 | 19513 | 2 |
| Quadrant | Total seconds | Saturated seconds | Saturation percentage |
|---|---|---|---|
| A | 5476 | 17 | 0.310446% |
| B | 5476 | 261 | 4.766253% |
| C | 5476 | 18 | 0.328707% |
| D | 5476 | 299 | 5.460190% |
Noise dominated data is calculated using 1-second bins in cleaned event files. If a bin has >2000 counts, and if more than 50% of those come from <1% of pixels, then it is considered to be noise-dominated and hence unusable.
| Quadrant | # 1 sec bins | Bins with >0 counts | Bins with >2000 counts | High rate bins dominated by noise | Noise dominated (total time) | Noise dominated (detector-on time) | Marked lightcurve |
|---|---|---|---|---|---|---|---|
| A | 7358 | 5477 | 4 | 4 | 0.05% | 0.07% | 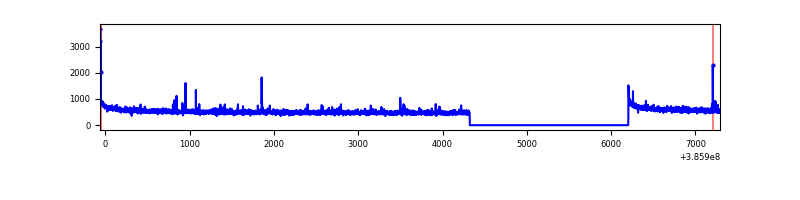 |
| B | 7358 | 5477 | 157 | 157 | 2.13% | 2.87% | 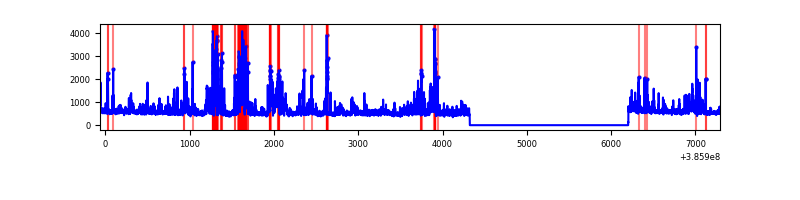 |
| C | 7358 | 5477 | 16 | 16 | 0.22% | 0.29% | 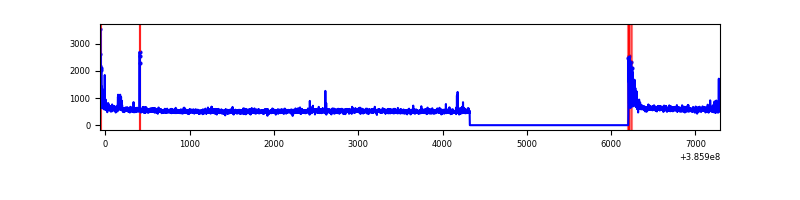 |
| D | 7358 | 5477 | 254 | 254 | 3.45% | 4.64% | 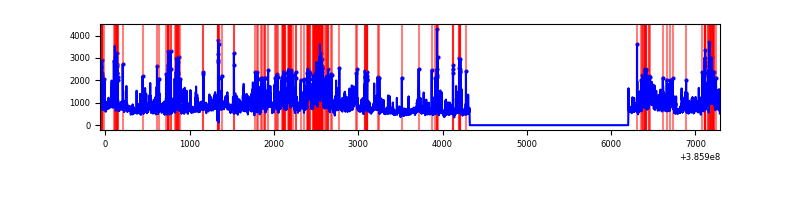 |
Top three noisy pixels from each quadrant. If the there are fewer than three noisy pixels in the level2.evt file, extra rows are filled as -1
| Pixel properties | Quadrant properties | ||||||
|---|---|---|---|---|---|---|---|
| Quadrant | DetID | PixID | Counts | Sigma | Mean | Median | Sigma |
| A | 10 | 83 | 84465 | 592.36 | 712 | 700 | 141.4 |
| A | 9 | 143 | 24398 | 167.58 | 712 | 700 | 141.4 |
| A | 7 | 16 | 19384 | 132.13 | 712 | 700 | 141.4 |
| B | 5 | 172 | 819776 | 6328.96 | 687 | 670 | 129.4 |
| B | 5 | 255 | 134320 | 1032.67 | 687 | 670 | 129.4 |
| B | 0 | 189 | 91253 | 699.9 | 687 | 670 | 129.4 |
| C | 15 | 214 | 231134 | 1475.89 | 686 | 692 | 156.1 |
| C | 0 | 10 | 78599 | 498.96 | 686 | 692 | 156.1 |
| C | 12 | 250 | 29043 | 181.58 | 686 | 692 | 156.1 |
| D | 8 | 195 | 1400052 | 8641.08 | 678 | 662 | 161.9 |
| D | 2 | 250 | 314084 | 1935.35 | 678 | 662 | 161.9 |
| D | 13 | 249 | 204712 | 1259.99 | 678 | 662 | 161.9 |
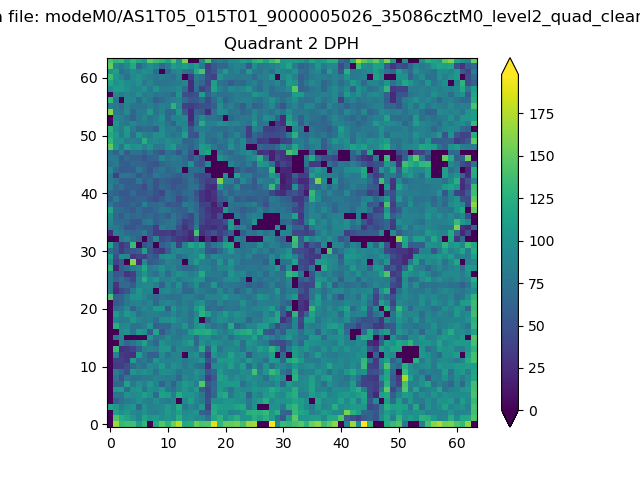
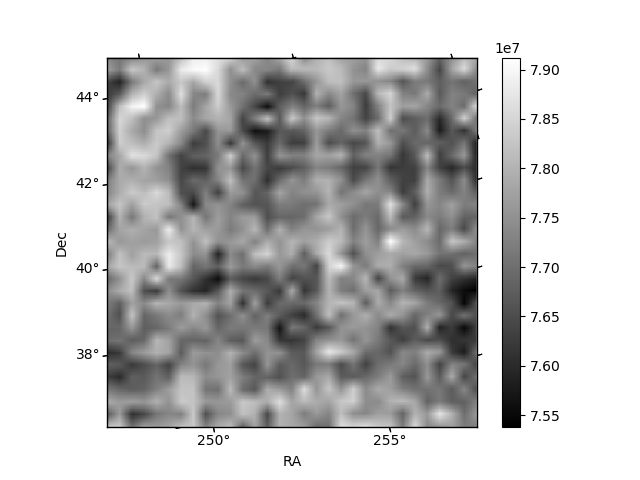
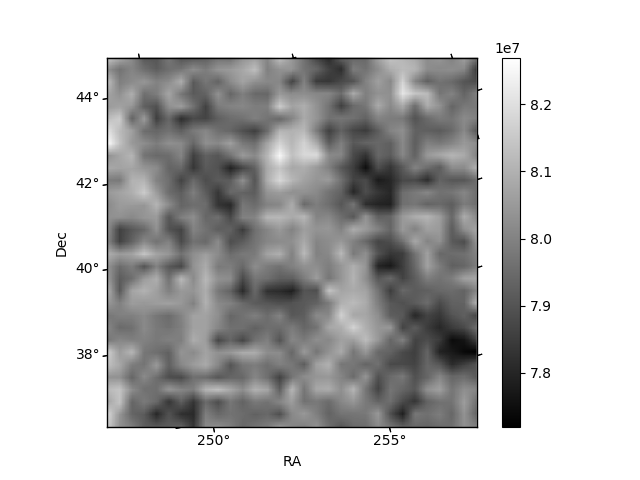
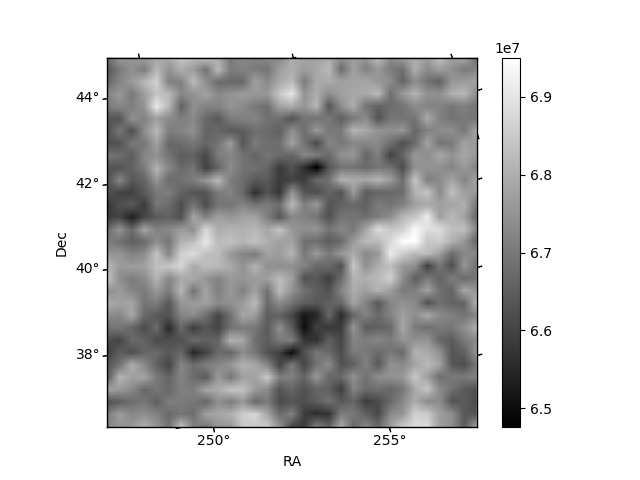
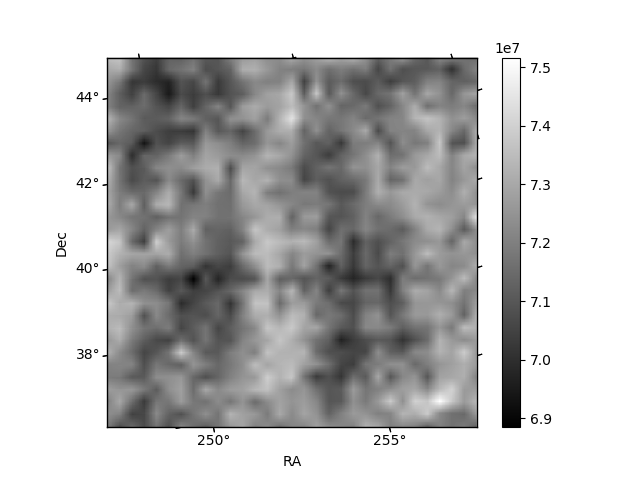
Histogram calculated using DETX and DETY for each event in the final _common_clean file
| Quadrant A | 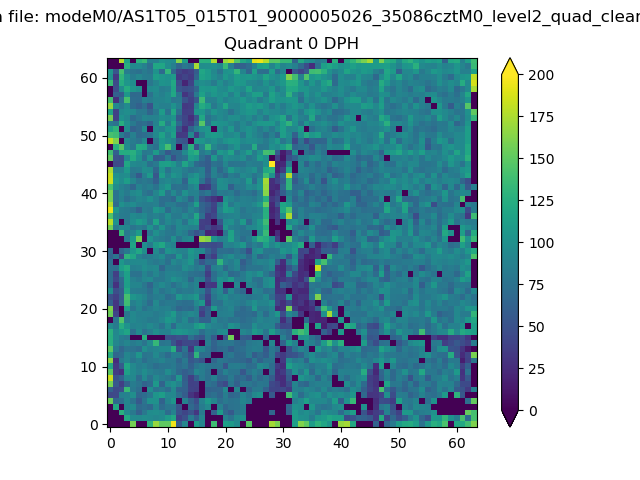 |
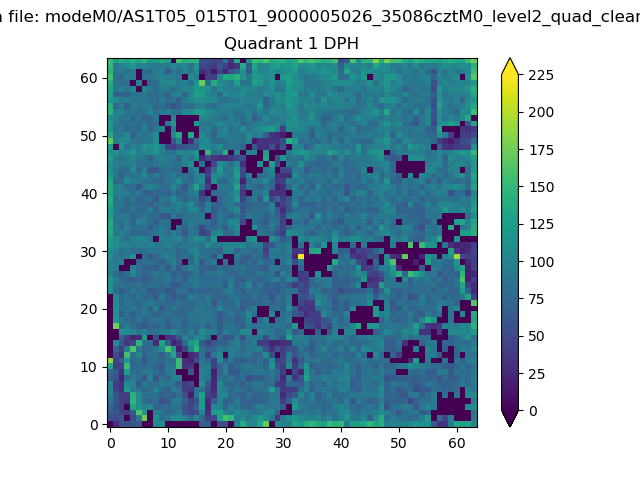 |
Quadrant B |
|---|---|---|---|
| Quadrant D | 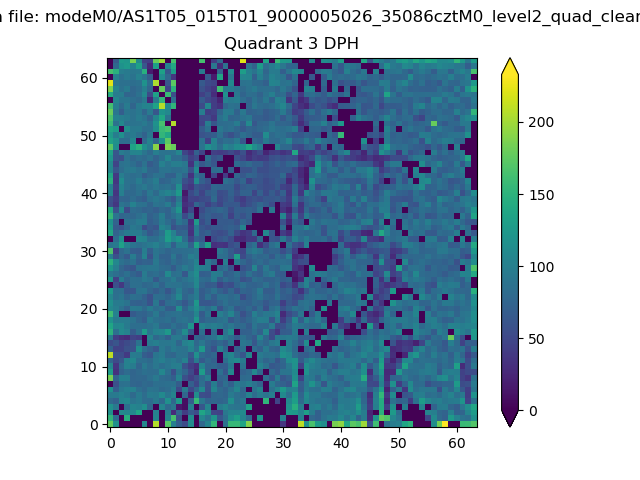 |
 |
Quadrant C |
| Plot type | Count rate plots | Images |
|---|---|---|
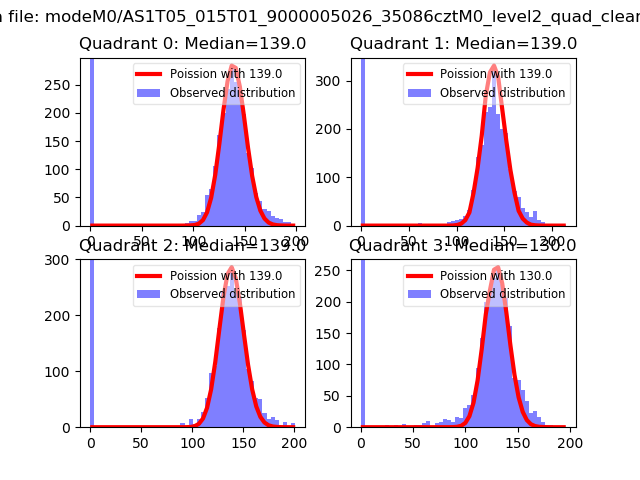
| Comparison with Poisson distribution Blue bars denote a histogram of data divided into 1 sec bins. Red curve is a Poisson curve with rate = median count rate of data. |
 |
 |
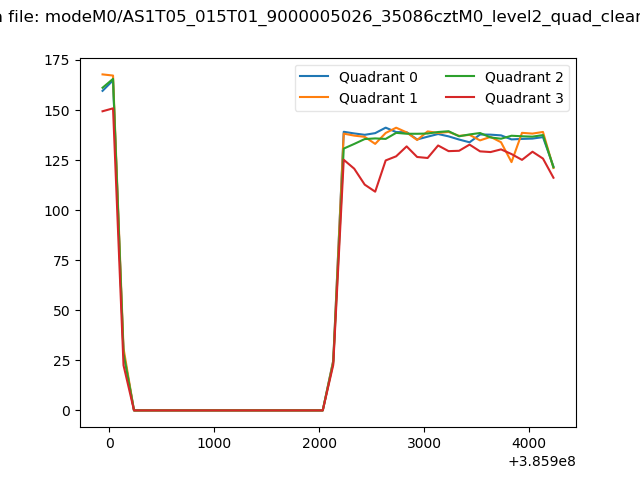
| Quadrant-wise count rates Data is divided into 100 sec bins |
 |
|
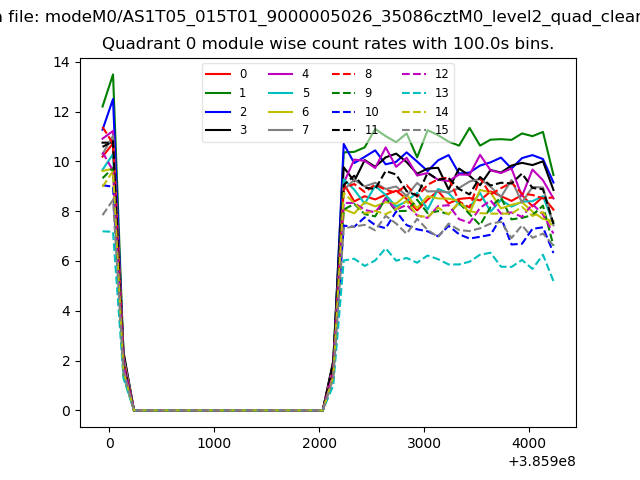
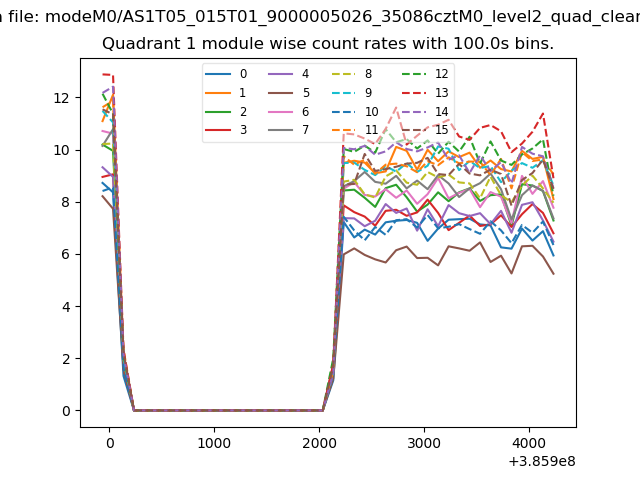
| Module-wise count rates for Quadrant A Data is divided into 100 sec bins |
 |
 |
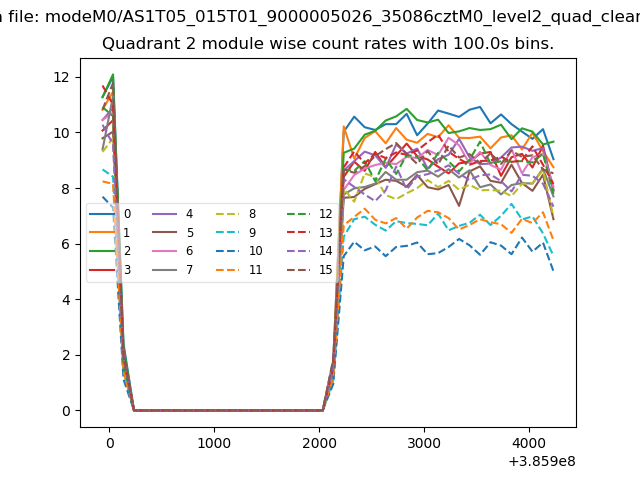
| Module-wise count rates for Quadrant B Data is divided into 100 sec bins |
 |
 |
| Module-wise count rates for Quadrant C Data is divided into 100 sec bins |
 |
 |
| Module-wise count rates for Quadrant D Data is divided into 100 sec bins |
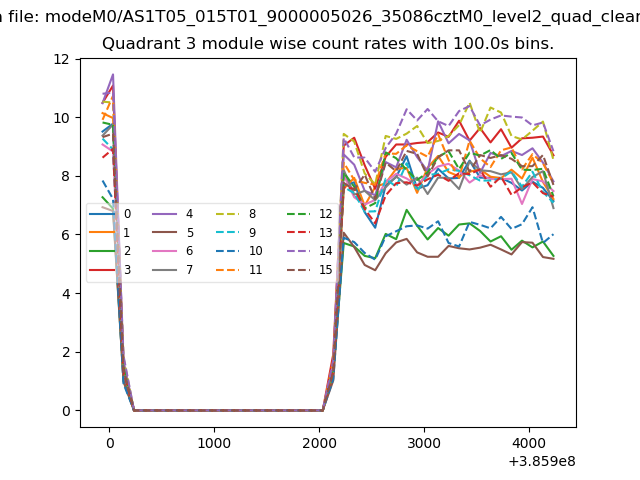 |
 |
| Parameter | Plot |
|---|---|
| CZT HV Monitor | 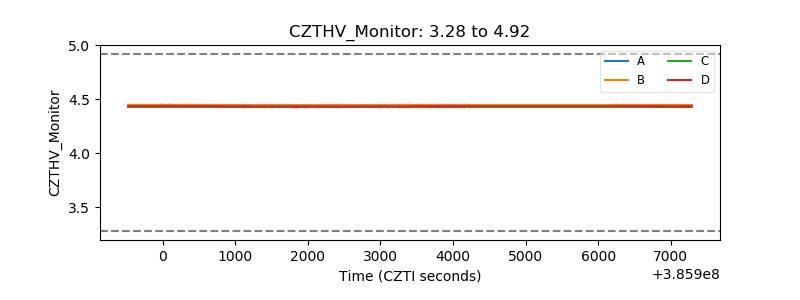 |
| D_VDD | 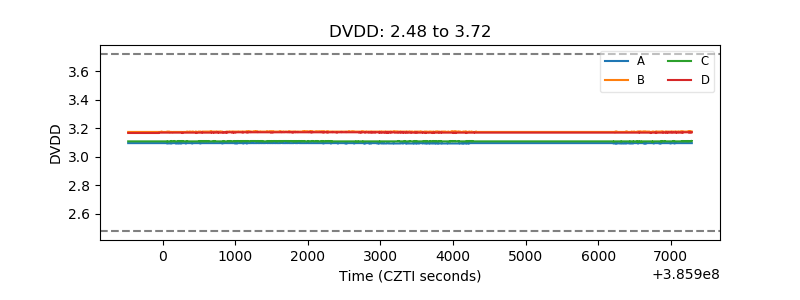 |
| Temperature 1 | 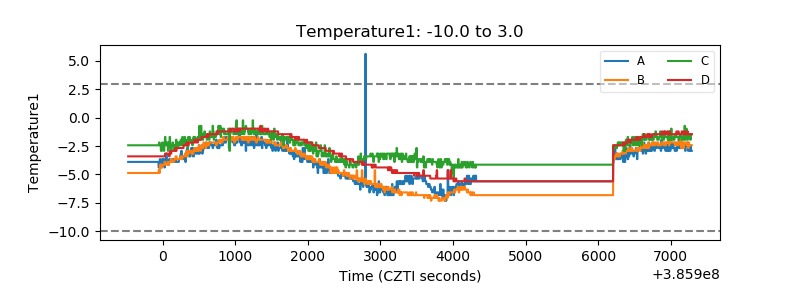 |
| Veto HV Monitor | 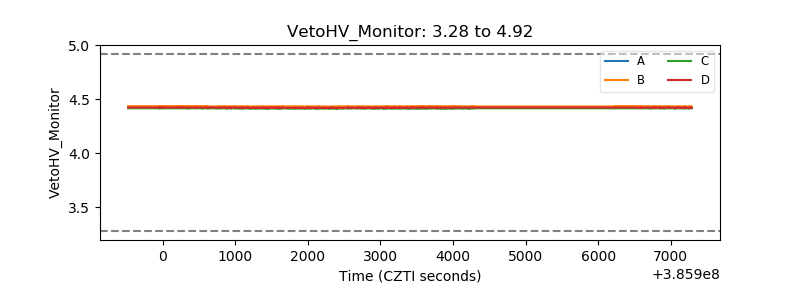 |
| Veto LLD | 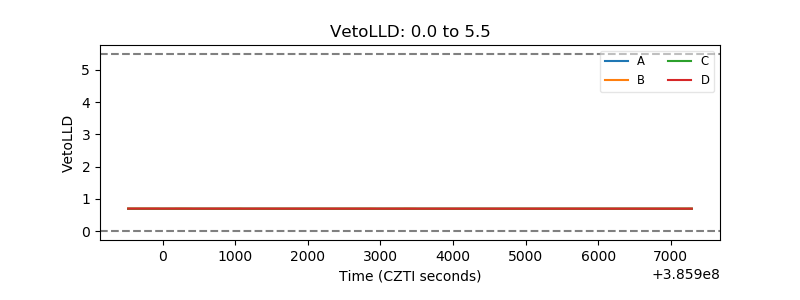 |
| Alpha Counter | 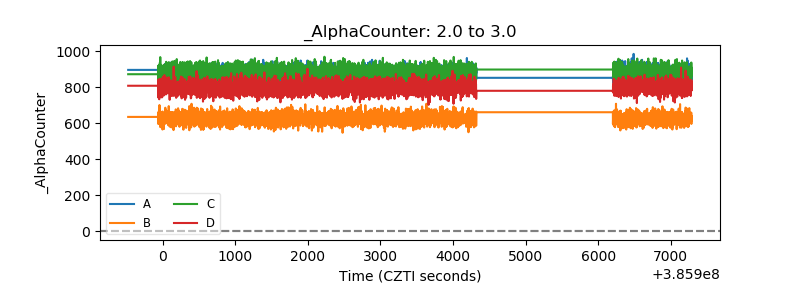 |
| _CPM_Rate | 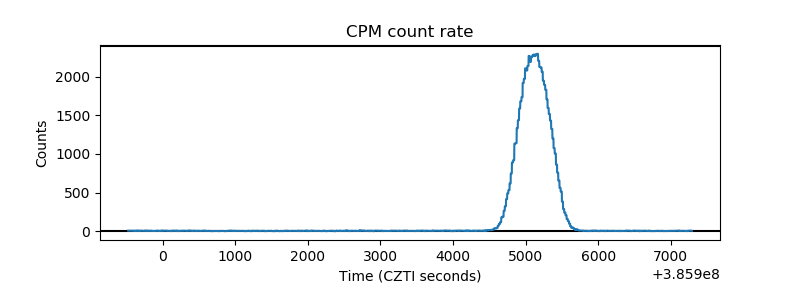 |
| CZT Counter | 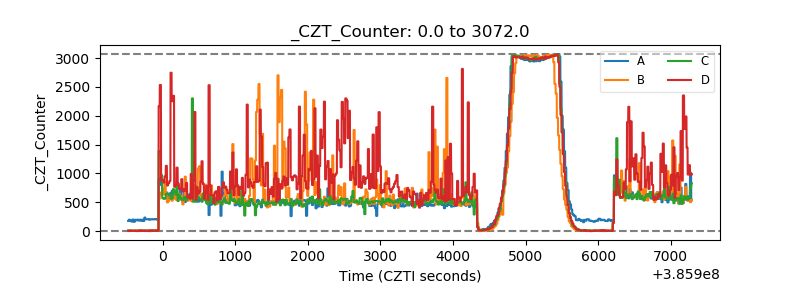 |
| +2.5 Volts monitor | 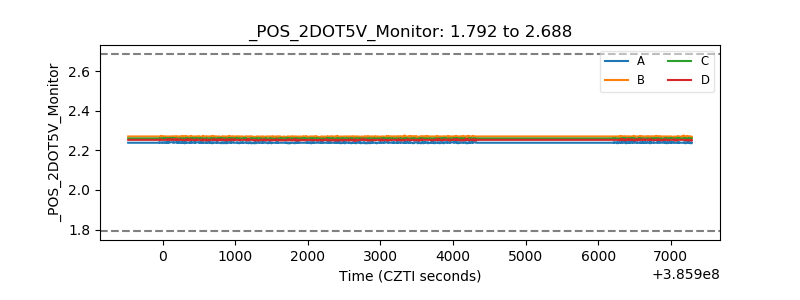 |
| +5 Volts monitor | 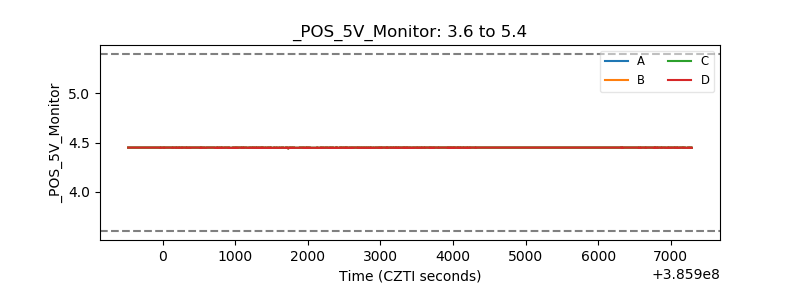 |
| _ROLL_ROT | 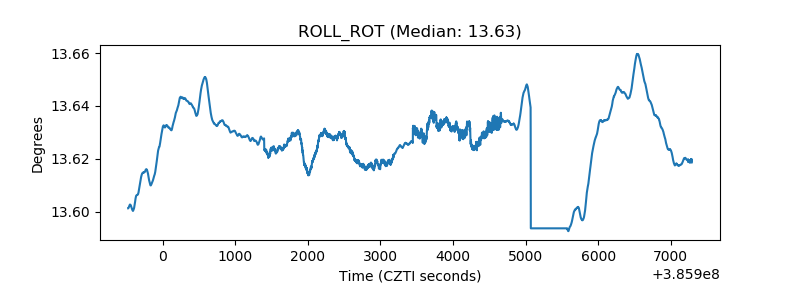 |
| _Roll_DEC | 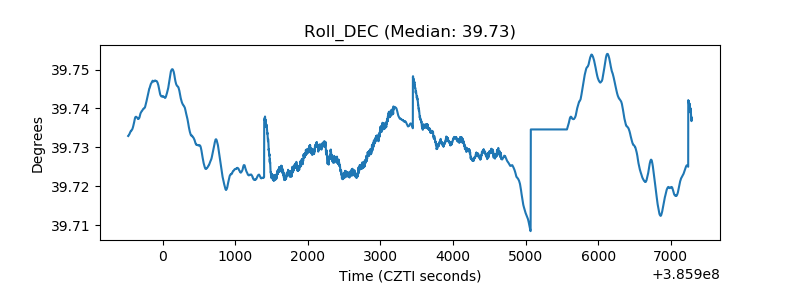 |
| _Roll_RA | 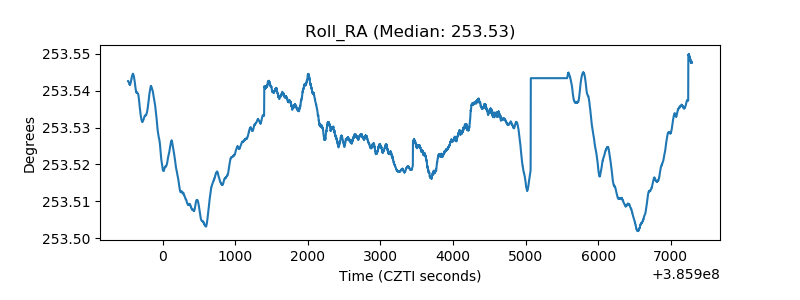 |
| Veto Counter | 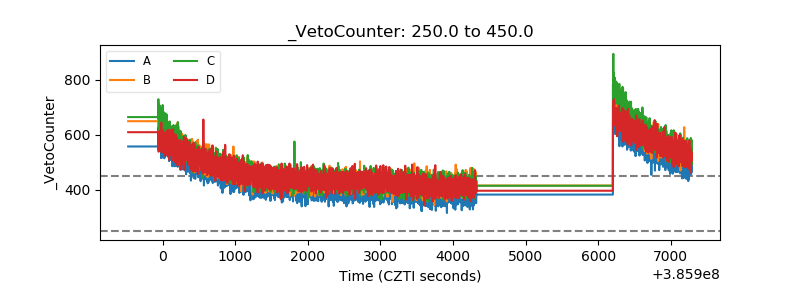 |