| Param | Original file | Final file |
|---|---|---|
| Filename | modeM0/AS1T05_015T01_9000005026_35083cztM0_level2.evt | modeM0/AS1T05_015T01_9000005026_35083cztM0_level2_quad_clean.evt |
| Size (bytes) | 557,527,680 | 67,343,040 |
| Size | 531.7 MB | 64.2 MB |
| Events in quadrant A | 2,732,606 | 421,667 |
| Events in quadrant B | 3,323,940 | 429,740 |
| Events in quadrant C | 2,861,239 | 425,046 |
| Events in quadrant D | 7,591,138 | 373,946 |
| Mode SS | |||
|---|---|---|---|
| Quadrant | BADHDUFLAG | Total packets | Discarded packets |
| A | 0 | 114 | 0 |
| B | 0 | 114 | 0 |
| C | 0 | 114 | 0 |
| D | 0 | 114 | 0 |
| Mode M9 | |||
|---|---|---|---|
| Quadrant | BADHDUFLAG | Total packets | Discarded packets |
| A | 0 | 19 | 0 |
| B | 0 | 19 | 0 |
| C | 0 | 19 | 0 |
| D | 0 | 20 | 0 |
| Mode M0 | |||
|---|---|---|---|
| Quadrant | BADHDUFLAG | Total packets | Discarded packets |
| A | 0 | 11579 | 3 |
| B | 0 | 13303 | 2 |
| C | 0 | 11619 | 2 |
| D | 0 | 26503 | 2 |
| Quadrant | Total seconds | Saturated seconds | Saturation percentage |
|---|---|---|---|
| A | 5547 | 20 | 0.360555% |
| B | 5547 | 144 | 2.595998% |
| C | 5547 | 32 | 0.576888% |
| D | 5547 | 1110 | 20.010817% |
Noise dominated data is calculated using 1-second bins in cleaned event files. If a bin has >2000 counts, and if more than 50% of those come from <1% of pixels, then it is considered to be noise-dominated and hence unusable.
| Quadrant | # 1 sec bins | Bins with >0 counts | Bins with >2000 counts | High rate bins dominated by noise | Noise dominated (total time) | Noise dominated (detector-on time) | Marked lightcurve |
|---|---|---|---|---|---|---|---|
| A | 7159 | 5548 | 15 | 15 | 0.21% | 0.27% | 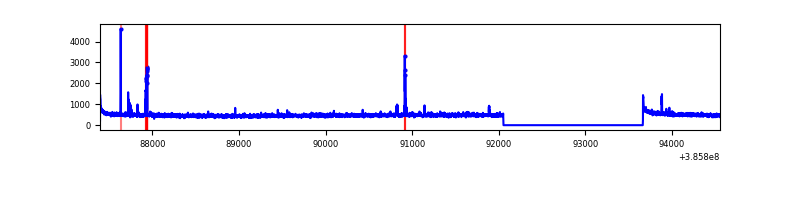 |
| B | 7159 | 5548 | 92 | 92 | 1.29% | 1.66% | 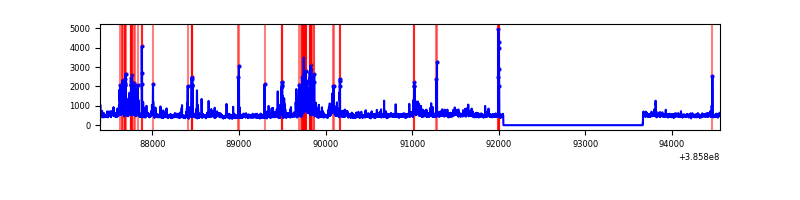 |
| C | 7159 | 5548 | 22 | 22 | 0.31% | 0.40% | 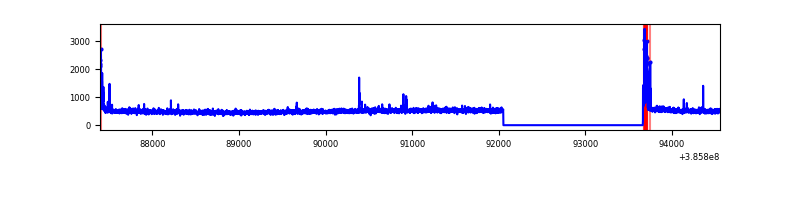 |
| D | 7159 | 5548 | 986 | 986 | 13.77% | 17.77% | 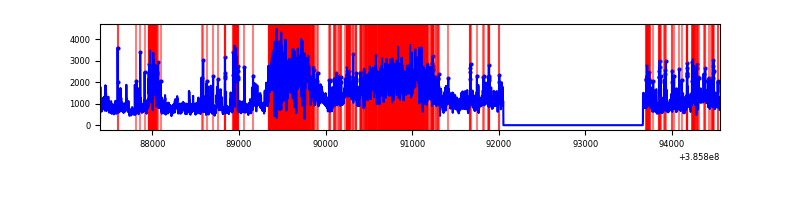 |
Top three noisy pixels from each quadrant. If the there are fewer than three noisy pixels in the level2.evt file, extra rows are filled as -1
| Pixel properties | Quadrant properties | ||||||
|---|---|---|---|---|---|---|---|
| Quadrant | DetID | PixID | Counts | Sigma | Mean | Median | Sigma |
| A | 10 | 83 | 81022 | 600.82 | 660 | 646 | 133.8 |
| A | 15 | 17 | 52312 | 386.21 | 660 | 646 | 133.8 |
| A | 7 | 16 | 25358 | 184.72 | 660 | 646 | 133.8 |
| B | 5 | 172 | 535642 | 4291.84 | 650 | 634 | 124.7 |
| B | 0 | 189 | 100175 | 798.52 | 650 | 634 | 124.7 |
| B | 5 | 255 | 78108 | 621.5 | 650 | 634 | 124.7 |
| C | 15 | 214 | 233112 | 1580.05 | 637 | 642 | 147.1 |
| C | 0 | 10 | 111071 | 750.56 | 637 | 642 | 147.1 |
| C | 12 | 250 | 16818 | 109.94 | 637 | 642 | 147.1 |
| D | 8 | 195 | 2623115 | 17806.24 | 592 | 575 | 147.3 |
| D | 2 | 250 | 2084029 | 14146.01 | 592 | 575 | 147.3 |
| D | 7 | 80 | 200166 | 1355.16 | 592 | 575 | 147.3 |
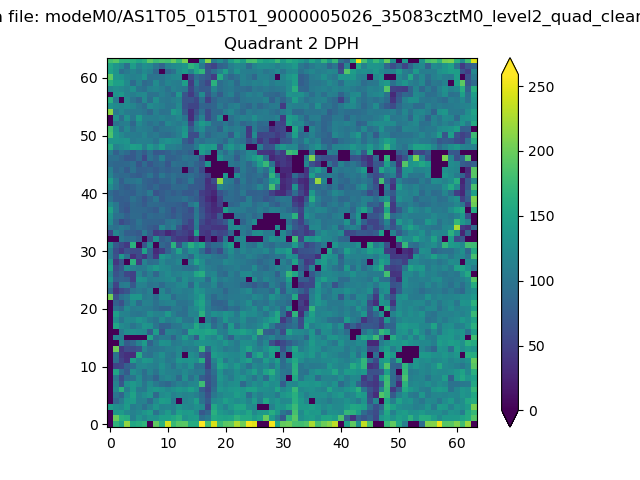
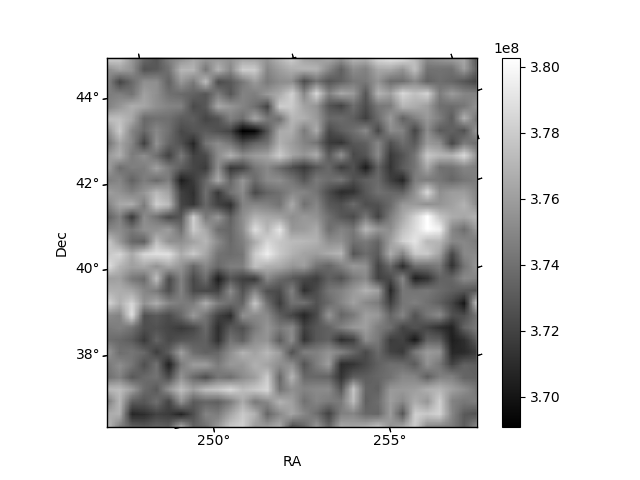
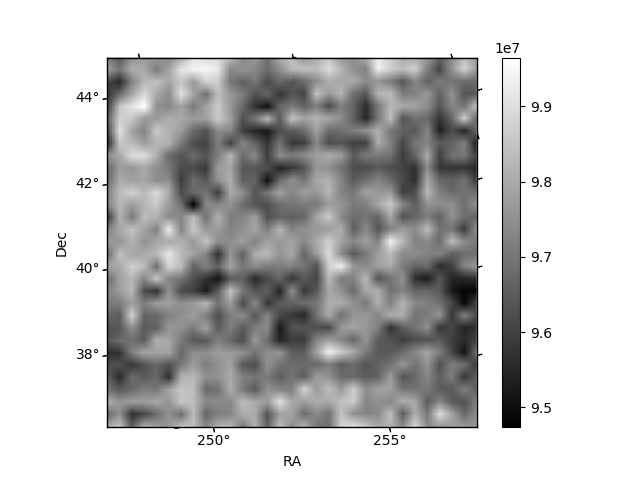
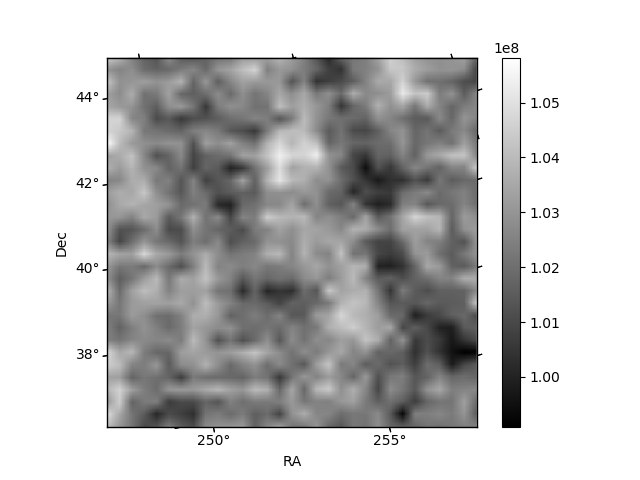
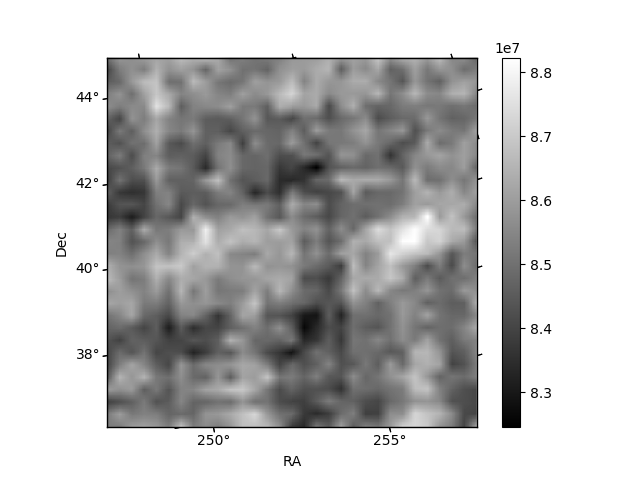
Histogram calculated using DETX and DETY for each event in the final _common_clean file
| Quadrant A | 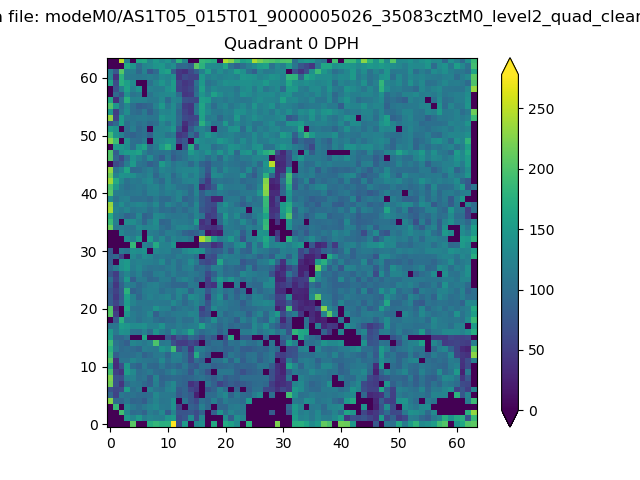 |
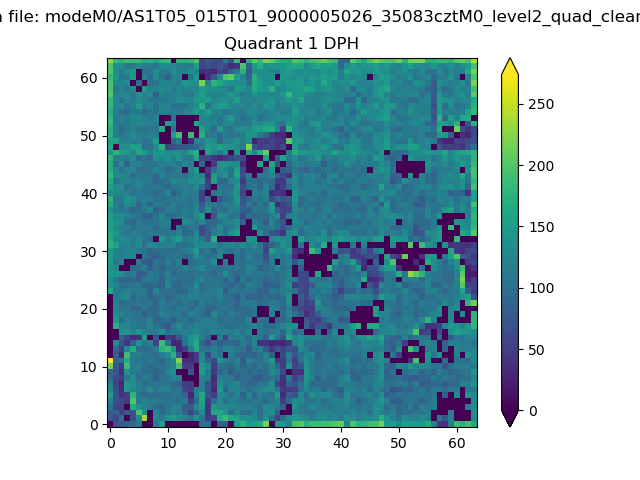 |
Quadrant B |
|---|---|---|---|
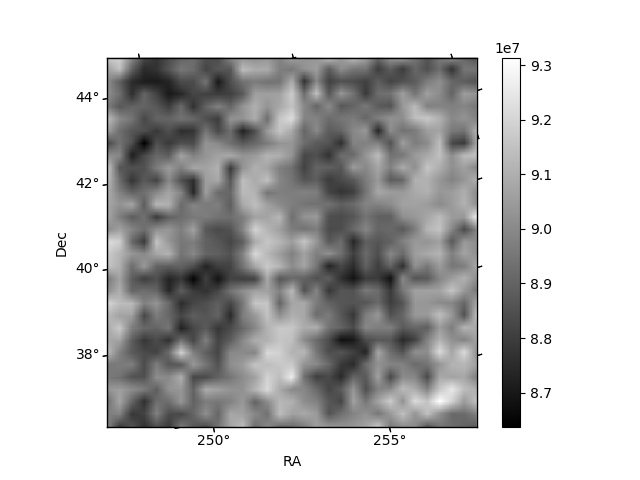
| Quadrant D | 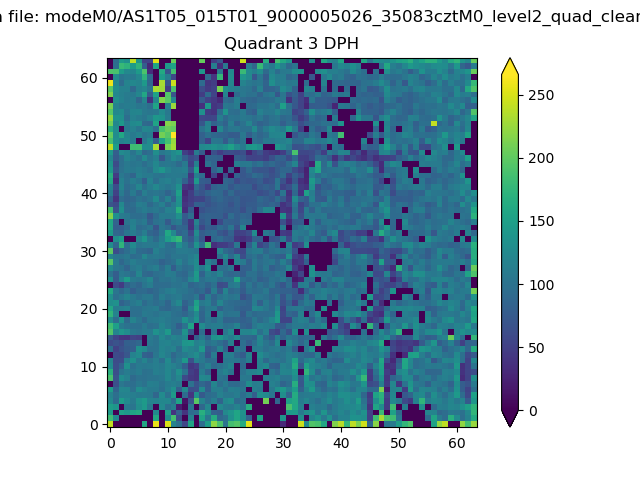 |
 |
Quadrant C |
| Plot type | Count rate plots | Images |
|---|---|---|
| Comparison with Poisson distribution Blue bars denote a histogram of data divided into 1 sec bins. Red curve is a Poisson curve with rate = median count rate of data. |
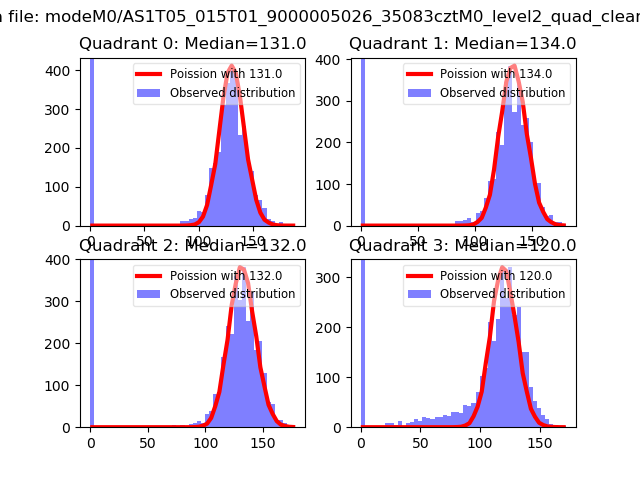 |
 |
| Quadrant-wise count rates Data is divided into 100 sec bins |
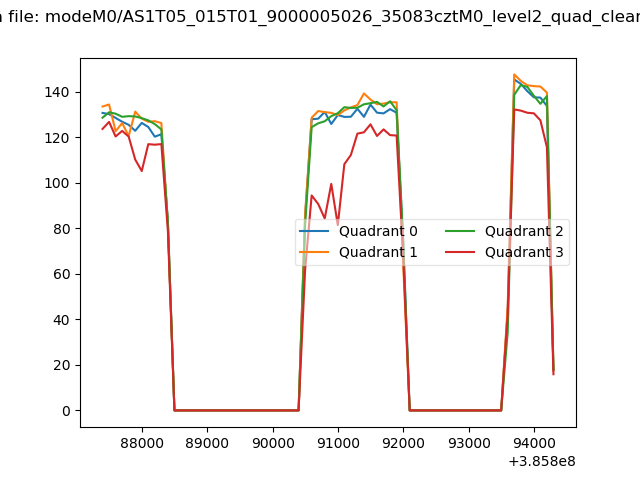 |
|
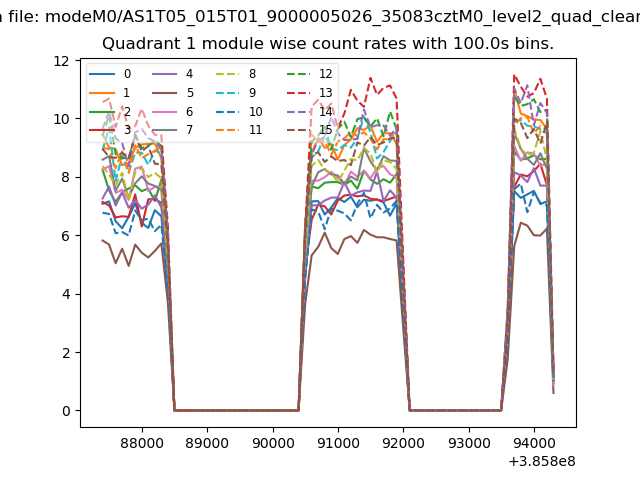
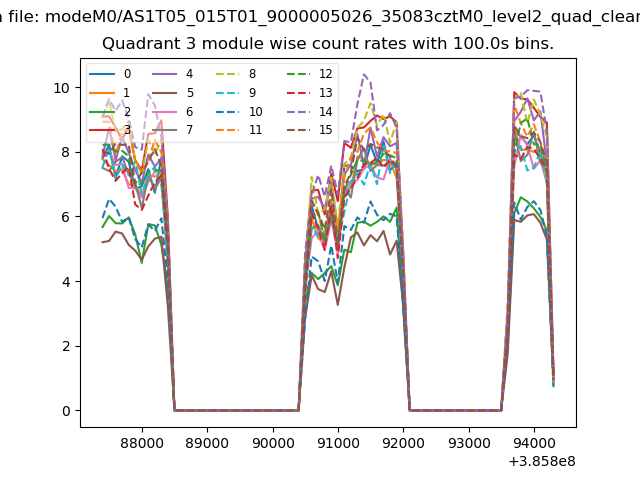
| Module-wise count rates for Quadrant A Data is divided into 100 sec bins |
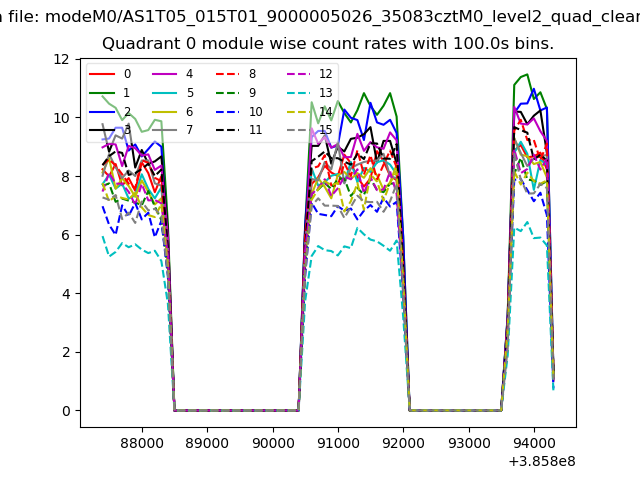 |
 |
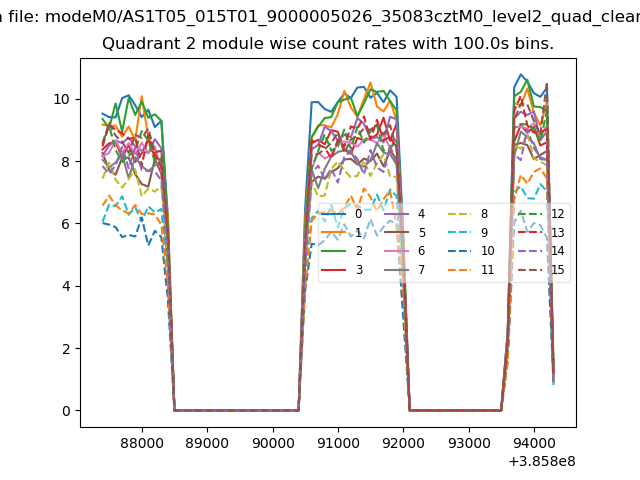
| Module-wise count rates for Quadrant B Data is divided into 100 sec bins |
 |
 |
| Module-wise count rates for Quadrant C Data is divided into 100 sec bins |
 |
 |
| Module-wise count rates for Quadrant D Data is divided into 100 sec bins |
 |
 |
| Parameter | Plot |
|---|---|
| CZT HV Monitor | 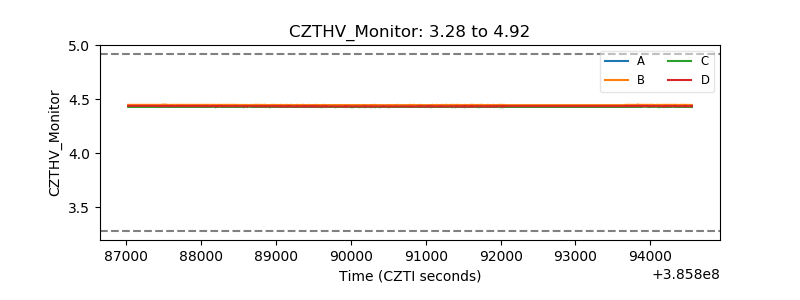 |
| D_VDD | 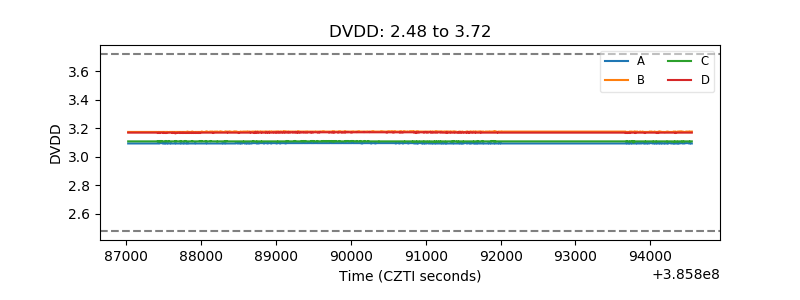 |
| Temperature 1 | 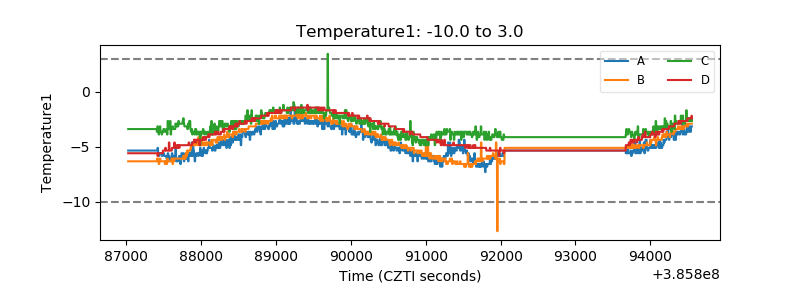 |
| Veto HV Monitor | 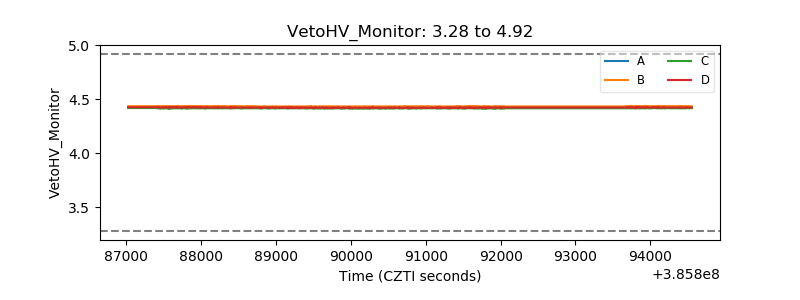 |
| Veto LLD | 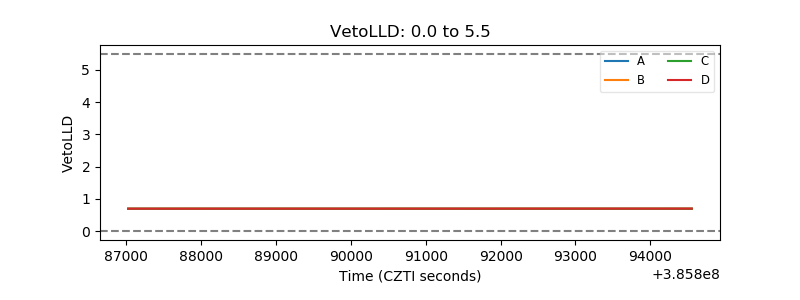 |
| Alpha Counter | 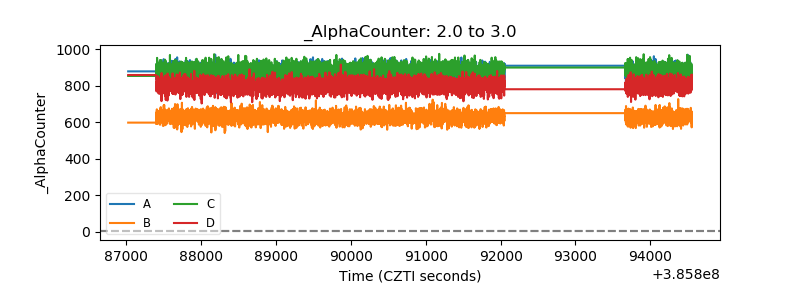 |
| _CPM_Rate | 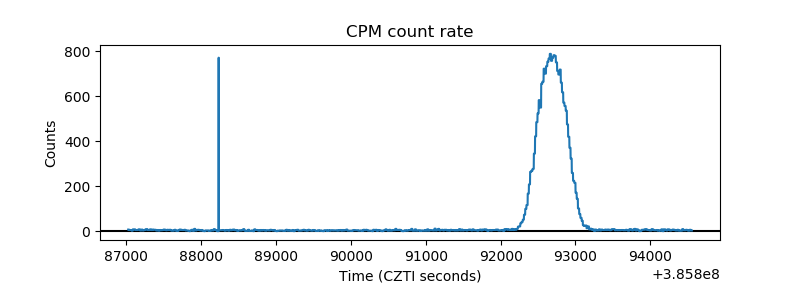 |
| CZT Counter | 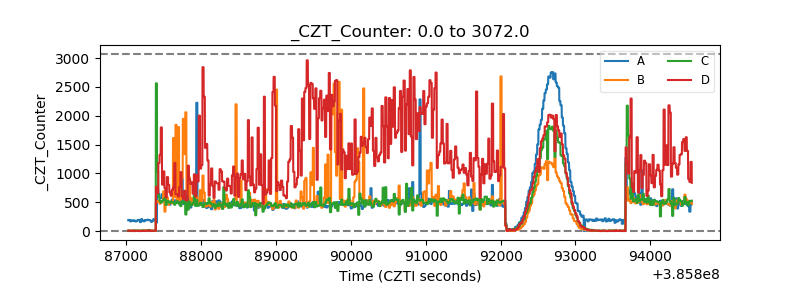 |
| +2.5 Volts monitor | 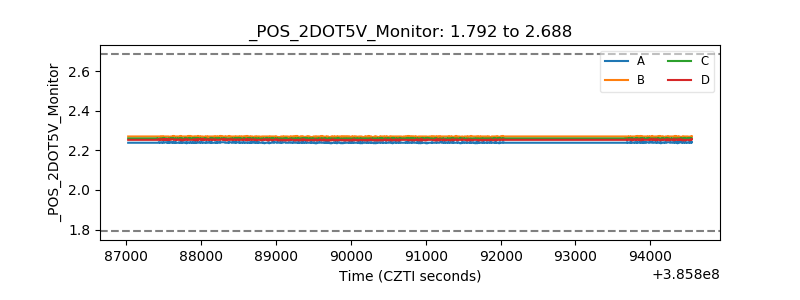 |
| +5 Volts monitor | 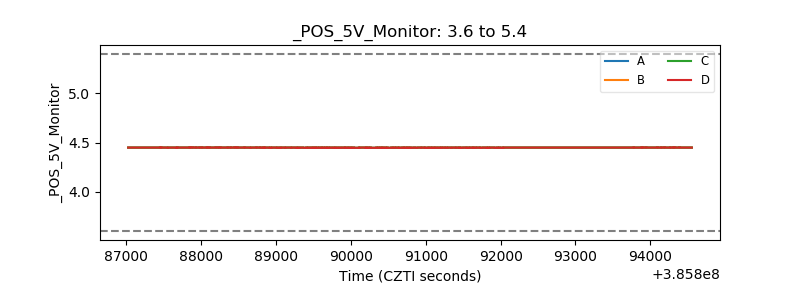 |
| _ROLL_ROT | 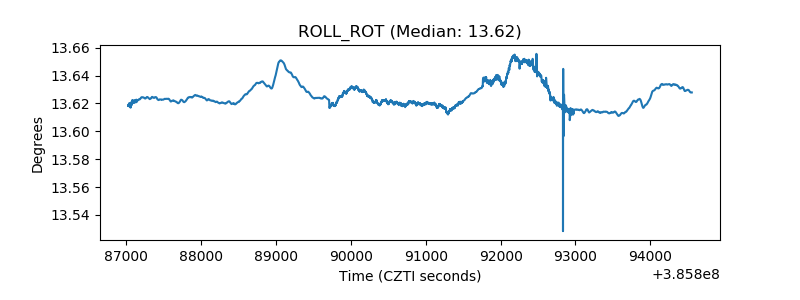 |
| _Roll_DEC | 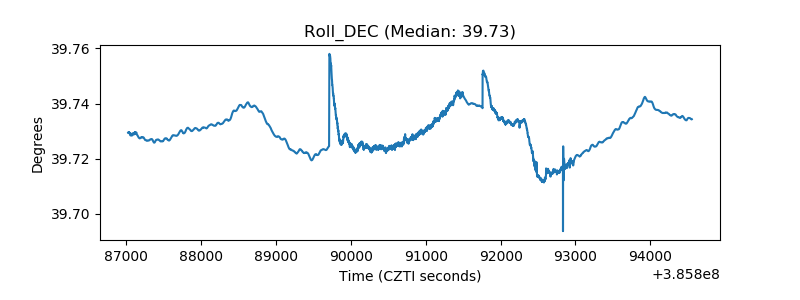 |
| _Roll_RA | 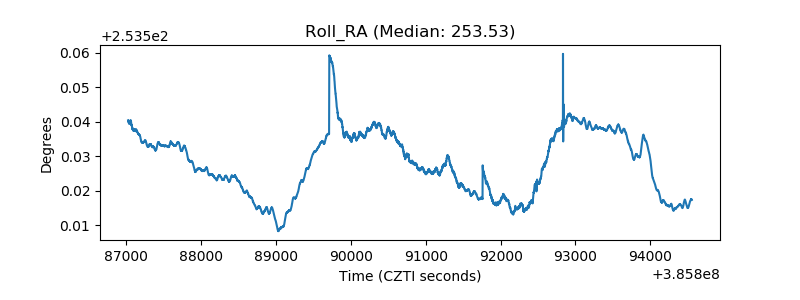 |
| Veto Counter | 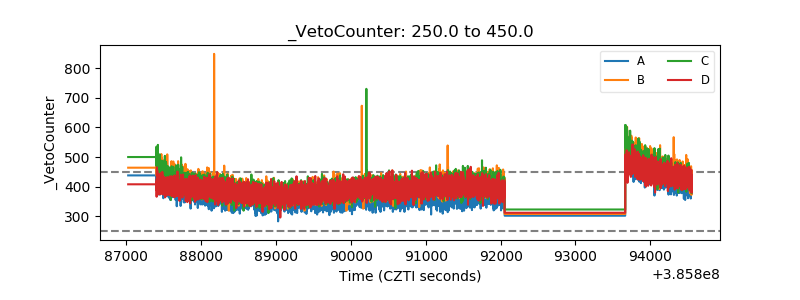 |