| Param | Original file | Final file |
|---|---|---|
| Filename | modeM0/AS1T05_015T01_9000005026_35079cztM0_level2.evt | modeM0/AS1T05_015T01_9000005026_35079cztM0_level2_quad_clean.evt |
| Size (bytes) | 629,265,600 | 74,272,320 |
| Size | 600.1 MB | 70.8 MB |
| Events in quadrant A | 2,782,307 | 477,227 |
| Events in quadrant B | 3,902,283 | 480,550 |
| Events in quadrant C | 3,312,430 | 486,497 |
| Events in quadrant D | 8,655,702 | 386,020 |
| Mode SS | |||
|---|---|---|---|
| Quadrant | BADHDUFLAG | Total packets | Discarded packets |
| A | 0 | 122 | 0 |
| B | 0 | 122 | 0 |
| C | 0 | 122 | 0 |
| D | 0 | 122 | 0 |
| Mode M9 | |||
|---|---|---|---|
| Quadrant | BADHDUFLAG | Total packets | Discarded packets |
| A | 0 | 23 | 0 |
| B | 0 | 23 | 0 |
| C | 0 | 23 | 0 |
| D | 0 | 24 | 0 |
| Mode M0 | |||
|---|---|---|---|
| Quadrant | BADHDUFLAG | Total packets | Discarded packets |
| A | 0 | 12272 | 3 |
| B | 0 | 15601 | 2 |
| C | 0 | 13655 | 2 |
| D | 0 | 29962 | 2 |
| Quadrant | Total seconds | Saturated seconds | Saturation percentage |
|---|---|---|---|
| A | 5985 | 11 | 0.183793% |
| B | 5985 | 175 | 2.923977% |
| C | 5985 | 34 | 0.568087% |
| D | 5985 | 1471 | 24.578112% |
Noise dominated data is calculated using 1-second bins in cleaned event files. If a bin has >2000 counts, and if more than 50% of those come from <1% of pixels, then it is considered to be noise-dominated and hence unusable.
| Quadrant | # 1 sec bins | Bins with >0 counts | Bins with >2000 counts | High rate bins dominated by noise | Noise dominated (total time) | Noise dominated (detector-on time) | Marked lightcurve |
|---|---|---|---|---|---|---|---|
| A | 7266 | 5986 | 2 | 2 | 0.03% | 0.03% | 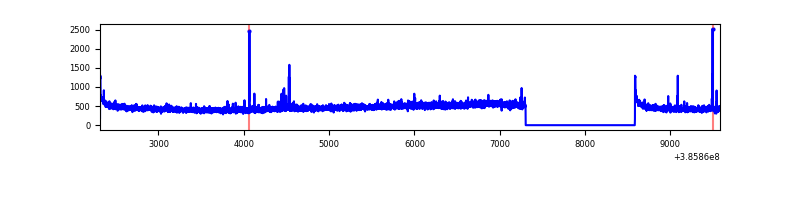 |
| B | 7266 | 5986 | 98 | 98 | 1.35% | 1.64% | 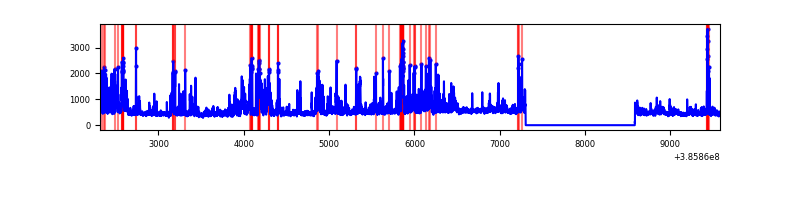 |
| C | 7266 | 5986 | 17 | 17 | 0.23% | 0.28% | 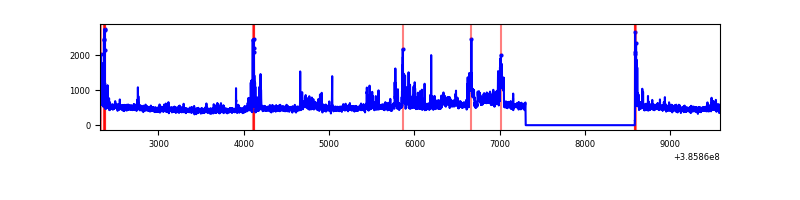 |
| D | 7266 | 5986 | 1271 | 1271 | 17.49% | 21.23% | 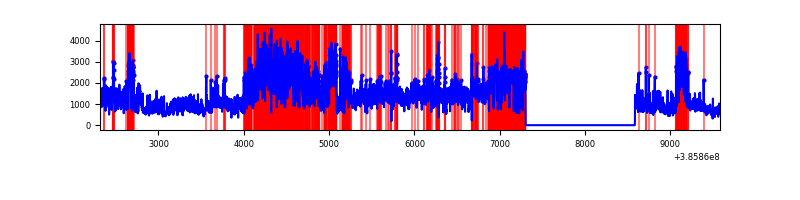 |
Top three noisy pixels from each quadrant. If the there are fewer than three noisy pixels in the level2.evt file, extra rows are filled as -1
| Pixel properties | Quadrant properties | ||||||
|---|---|---|---|---|---|---|---|
| Quadrant | DetID | PixID | Counts | Sigma | Mean | Median | Sigma |
| A | 10 | 83 | 82885 | 595.58 | 684 | 670 | 138.0 |
| A | 15 | 17 | 17107 | 119.07 | 684 | 670 | 138.0 |
| A | 7 | 16 | 16372 | 113.75 | 684 | 670 | 138.0 |
| B | 5 | 172 | 926941 | 7165.37 | 675 | 658 | 129.3 |
| B | 0 | 189 | 235049 | 1813.16 | 675 | 658 | 129.3 |
| B | 4 | 232 | 39834 | 303.05 | 675 | 658 | 129.3 |
| C | 10 | 49 | 316828 | 2053.54 | 666 | 670 | 154.0 |
| C | 15 | 214 | 249471 | 1616.04 | 666 | 670 | 154.0 |
| C | 0 | 10 | 70423 | 453.07 | 666 | 670 | 154.0 |
| D | 8 | 195 | 3819573 | 26387.92 | 588 | 572 | 144.7 |
| D | 2 | 250 | 2130093 | 14714.22 | 588 | 572 | 144.7 |
| D | 13 | 249 | 281679 | 1942.35 | 588 | 572 | 144.7 |
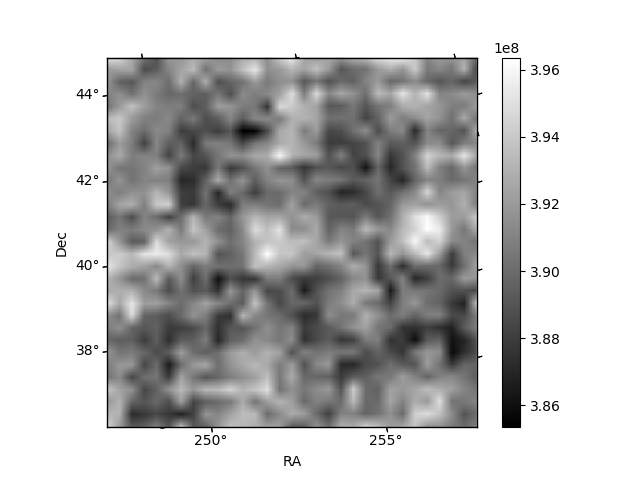
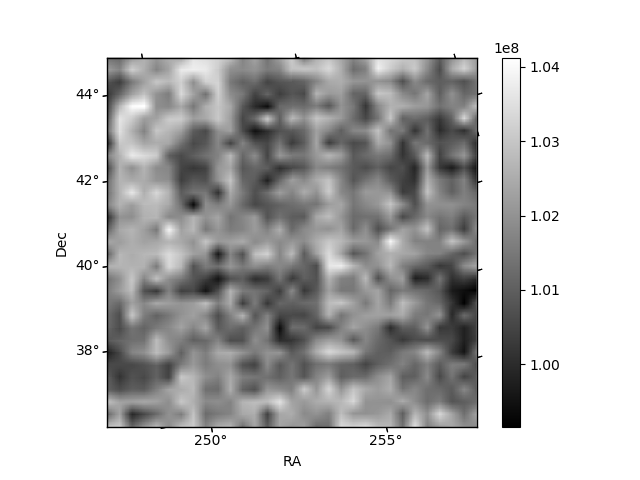
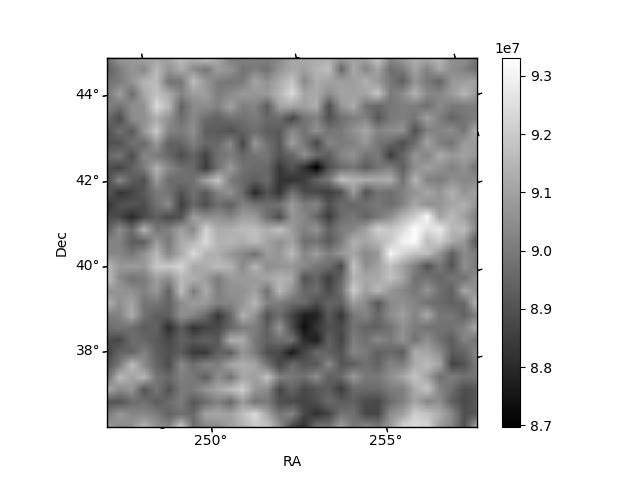
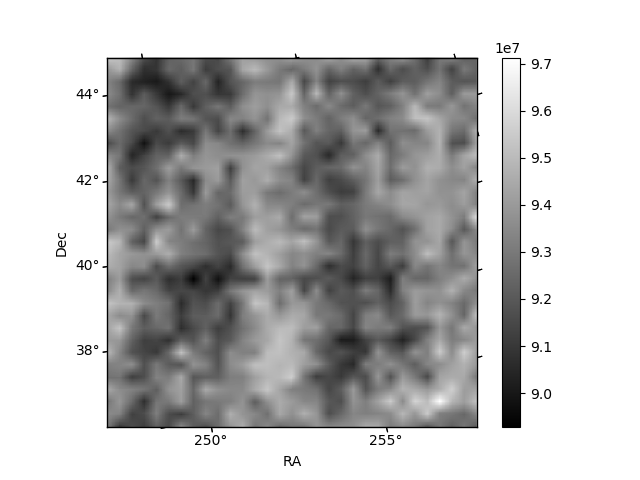
Histogram calculated using DETX and DETY for each event in the final _common_clean file
| Quadrant A | 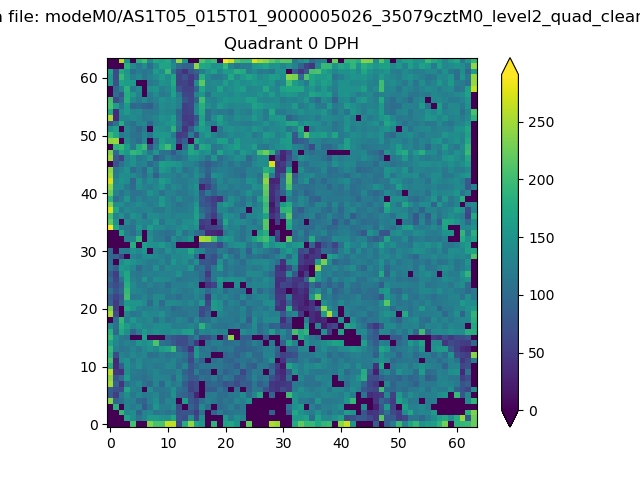 |
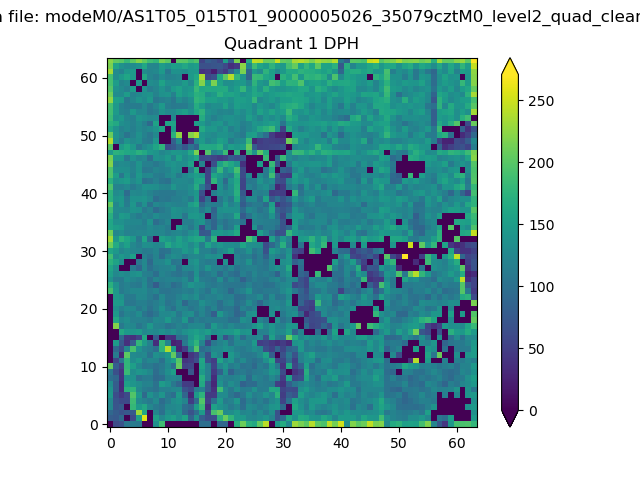 |
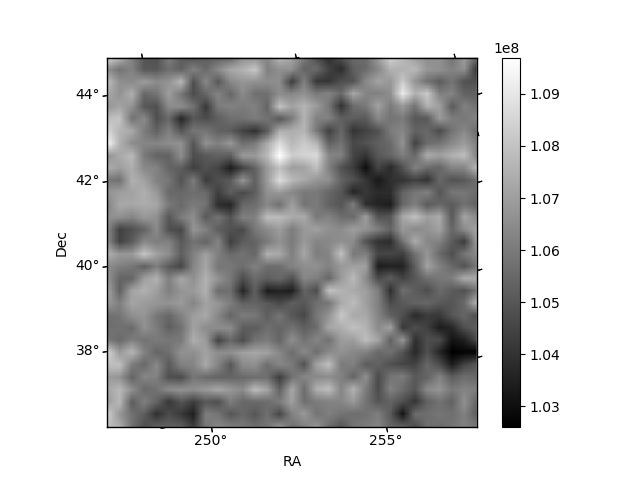
Quadrant B |
|---|---|---|---|
| Quadrant D | 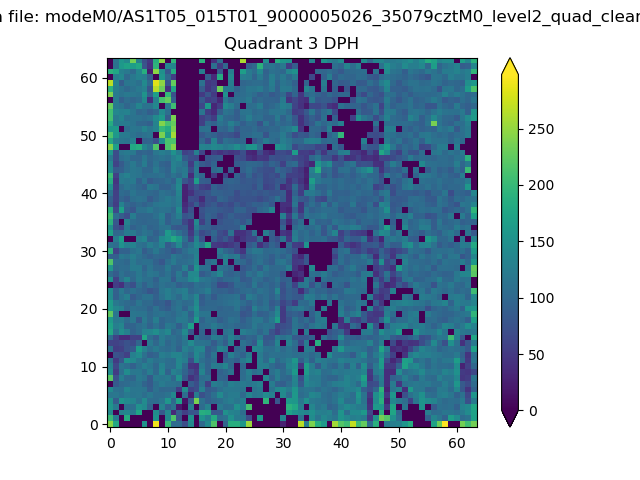 |
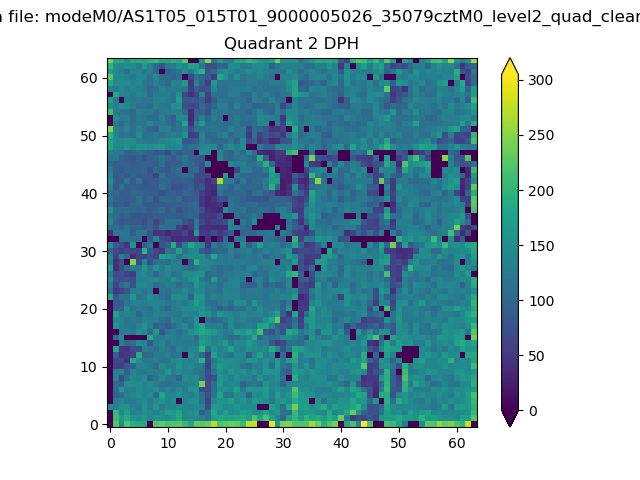 |
Quadrant C |
| Plot type | Count rate plots | Images |
|---|---|---|
| Comparison with Poisson distribution Blue bars denote a histogram of data divided into 1 sec bins. Red curve is a Poisson curve with rate = median count rate of data. |
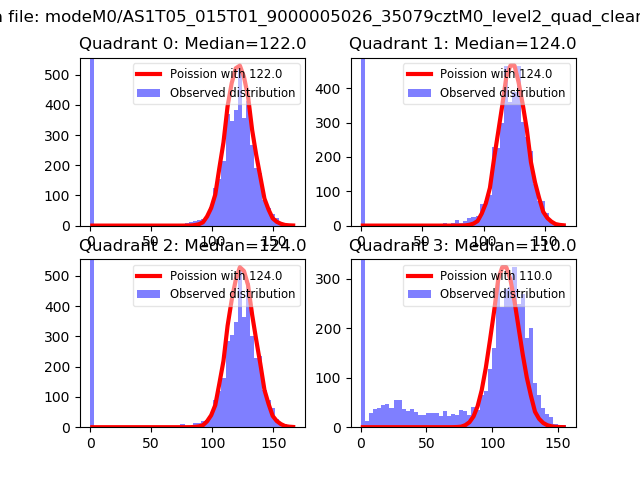 |
 |
| Quadrant-wise count rates Data is divided into 100 sec bins |
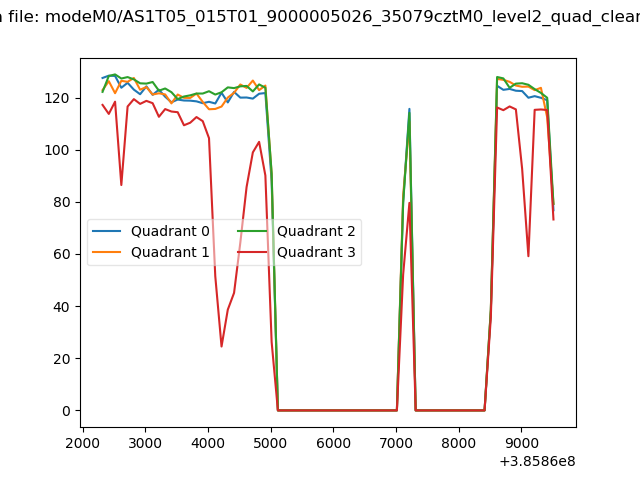 |
|
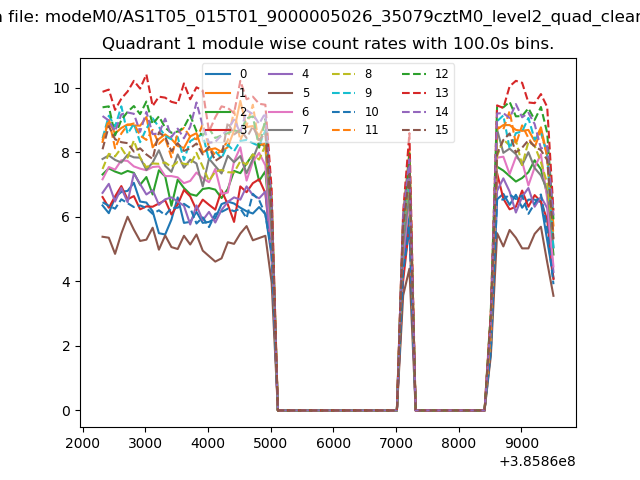
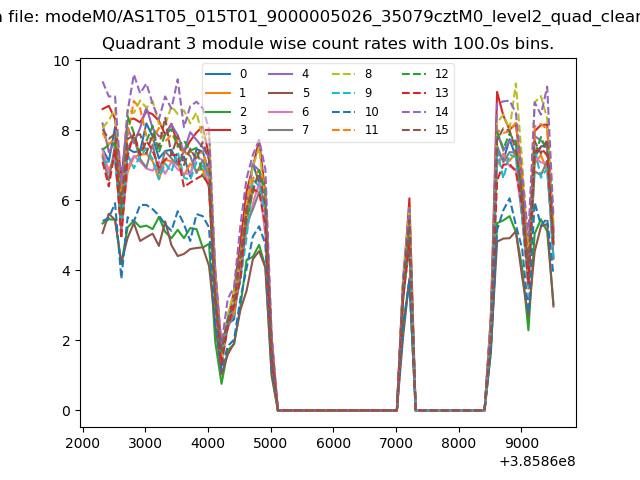
| Module-wise count rates for Quadrant A Data is divided into 100 sec bins |
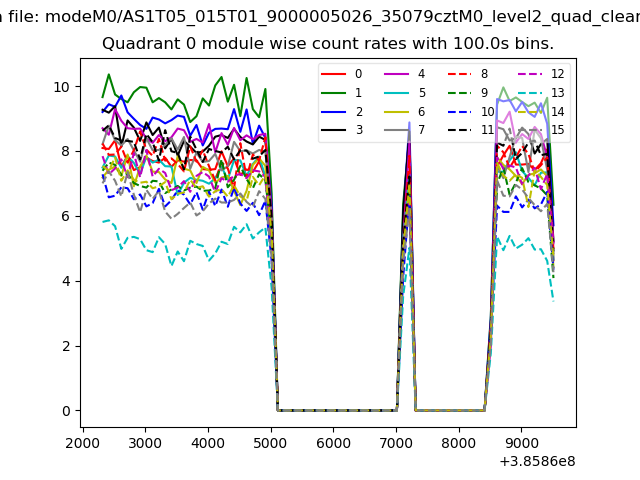 |
 |
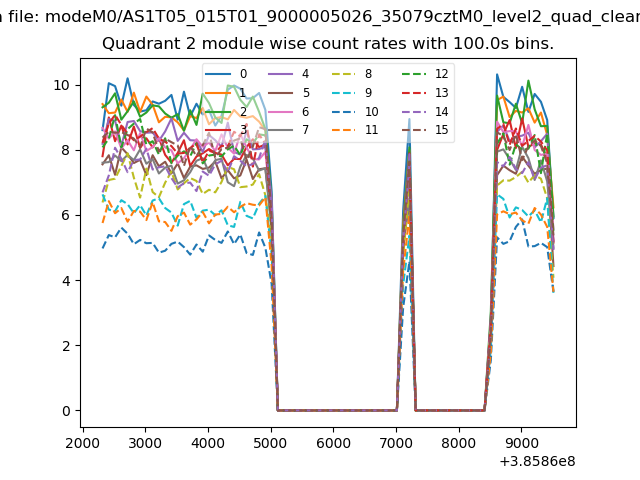
| Module-wise count rates for Quadrant B Data is divided into 100 sec bins |
 |
 |
| Module-wise count rates for Quadrant C Data is divided into 100 sec bins |
 |
 |
| Module-wise count rates for Quadrant D Data is divided into 100 sec bins |
 |
 |
| Parameter | Plot |
|---|---|
| CZT HV Monitor | 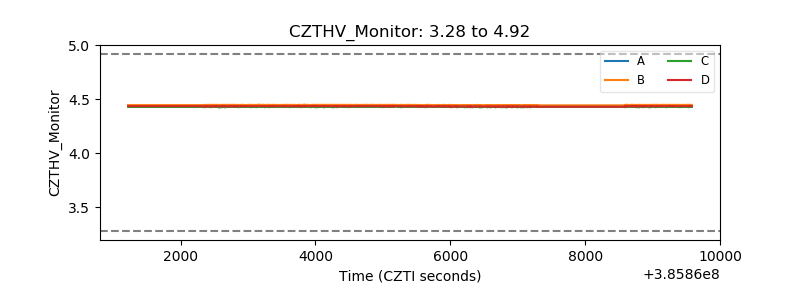 |
| D_VDD | 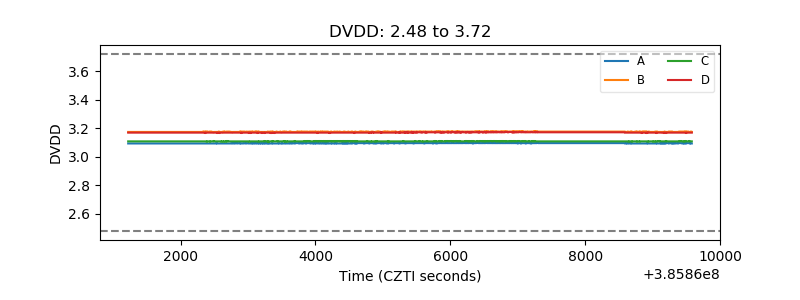 |
| Temperature 1 | 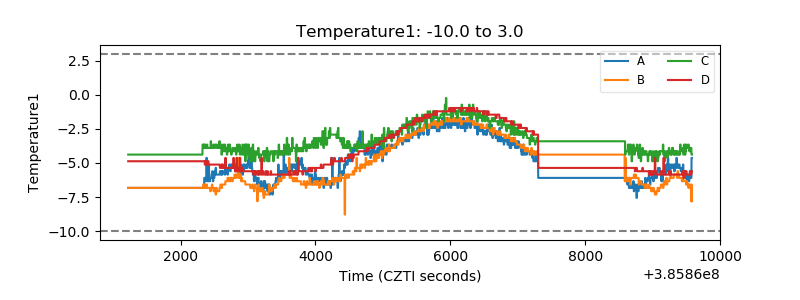 |
| Veto HV Monitor | 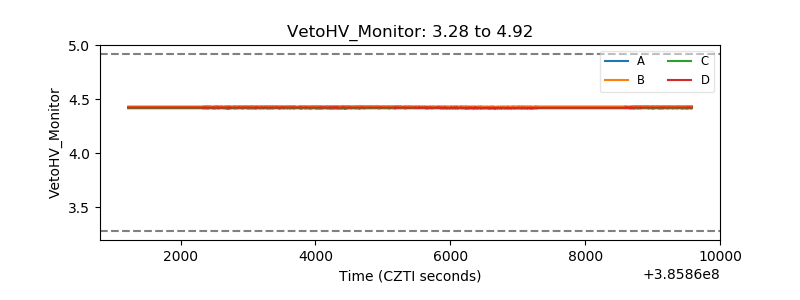 |
| Veto LLD | 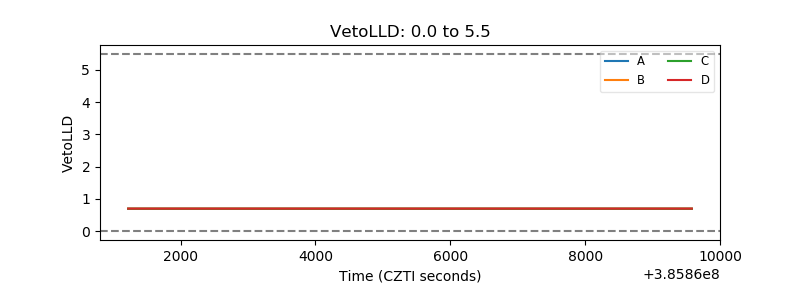 |
| Alpha Counter | 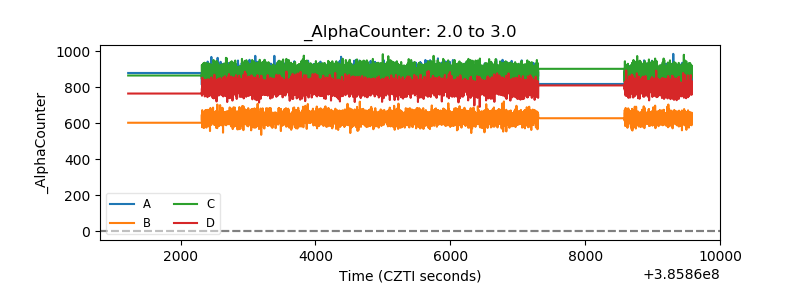 |
| _CPM_Rate | 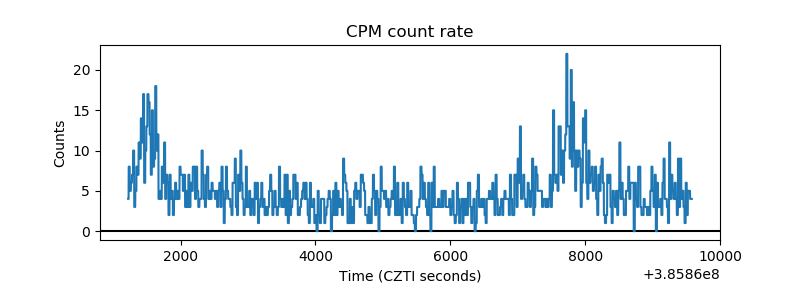 |
| CZT Counter | 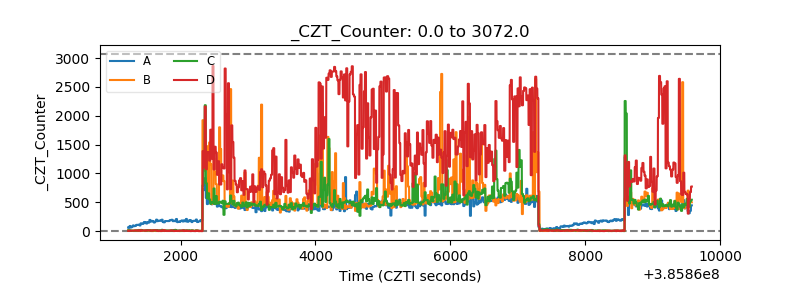 |
| +2.5 Volts monitor | 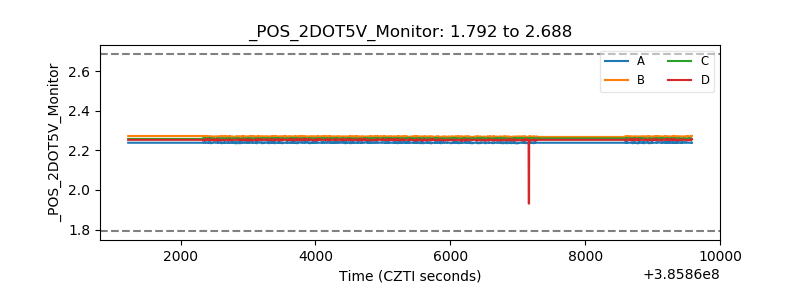 |
| +5 Volts monitor | 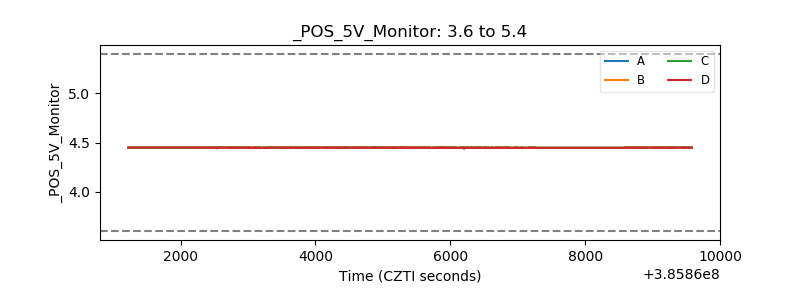 |
| _ROLL_ROT | 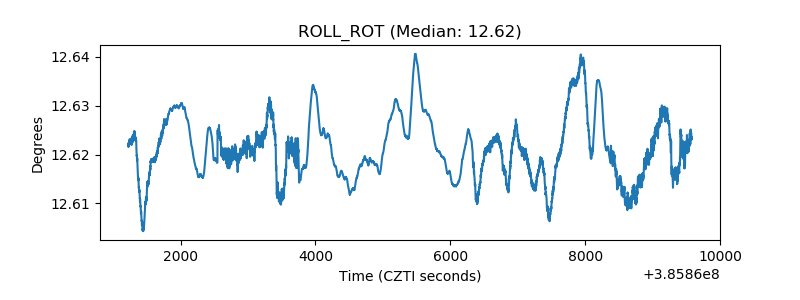 |
| _Roll_DEC | 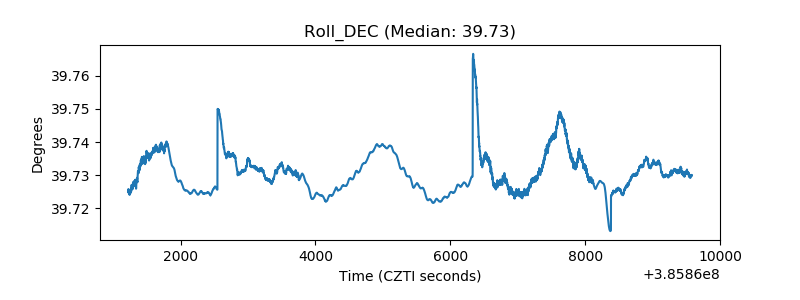 |
| _Roll_RA | 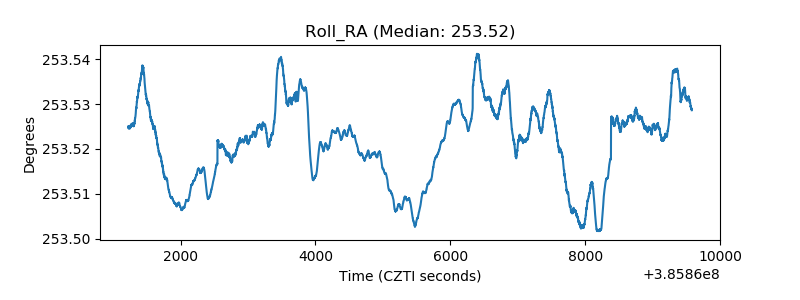 |
| Veto Counter | 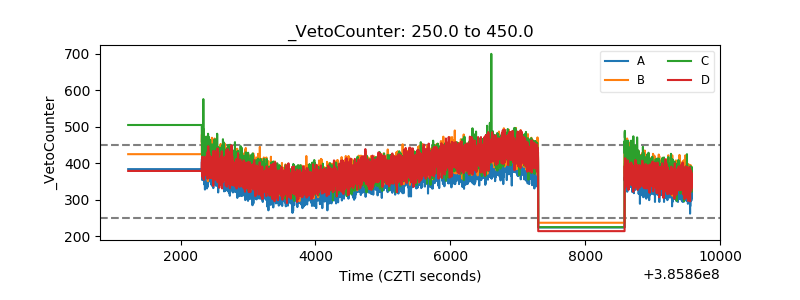 |