| Param | Original file | Final file |
|---|---|---|
| Filename | modeM0/AS1T05_015T01_9000005026_35074cztM0_level2.evt | modeM0/AS1T05_015T01_9000005026_35074cztM0_level2_quad_clean.evt |
| Size (bytes) | 466,015,680 | 74,580,480 |
| Size | 444.4 MB | 71.1 MB |
| Events in quadrant A | 2,663,792 | 481,501 |
| Events in quadrant B | 3,134,420 | 488,520 |
| Events in quadrant C | 3,038,327 | 489,373 |
| Events in quadrant D | 4,938,932 | 449,196 |
| Mode SS | |||
|---|---|---|---|
| Quadrant | BADHDUFLAG | Total packets | Discarded packets |
| A | 0 | 102 | 0 |
| B | 0 | 102 | 0 |
| C | 0 | 102 | 0 |
| D | 0 | 102 | 0 |
| Mode M9 | |||
|---|---|---|---|
| Quadrant | BADHDUFLAG | Total packets | Discarded packets |
| A | 0 | 37 | 0 |
| B | 0 | 37 | 0 |
| C | 0 | 37 | 0 |
| D | 0 | 38 | 0 |
| Mode M0 | |||
|---|---|---|---|
| Quadrant | BADHDUFLAG | Total packets | Discarded packets |
| A | 0 | 10994 | 3 |
| B | 0 | 12429 | 2 |
| C | 0 | 12163 | 2 |
| D | 0 | 18225 | 2 |
| Quadrant | Total seconds | Saturated seconds | Saturation percentage |
|---|---|---|---|
| A | 4986 | 7 | 0.140393% |
| B | 4986 | 78 | 1.564380% |
| C | 4986 | 88 | 1.764942% |
| D | 4986 | 291 | 5.836342% |
Noise dominated data is calculated using 1-second bins in cleaned event files. If a bin has >2000 counts, and if more than 50% of those come from <1% of pixels, then it is considered to be noise-dominated and hence unusable.
| Quadrant | # 1 sec bins | Bins with >0 counts | Bins with >2000 counts | High rate bins dominated by noise | Noise dominated (total time) | Noise dominated (detector-on time) | Marked lightcurve |
|---|---|---|---|---|---|---|---|
| A | 7108 | 4987 | 0 | 0 | 0.00% | 0.00% | 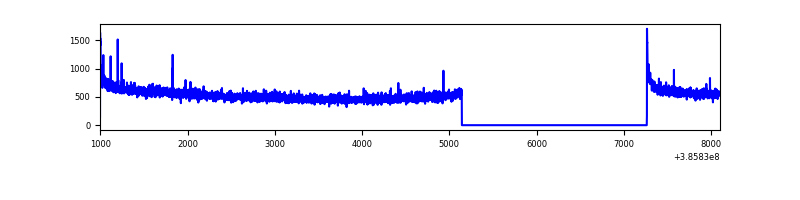 |
| B | 7108 | 4987 | 44 | 44 | 0.62% | 0.88% | 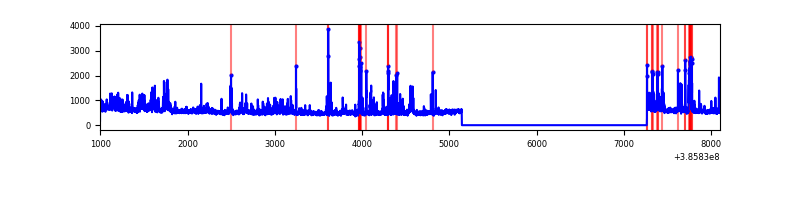 |
| C | 7108 | 4987 | 62 | 62 | 0.87% | 1.24% | 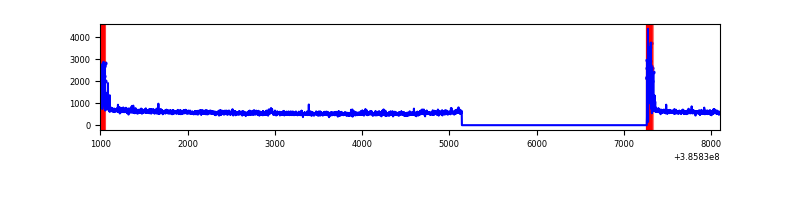 |
| D | 7108 | 4987 | 227 | 227 | 3.19% | 4.55% | 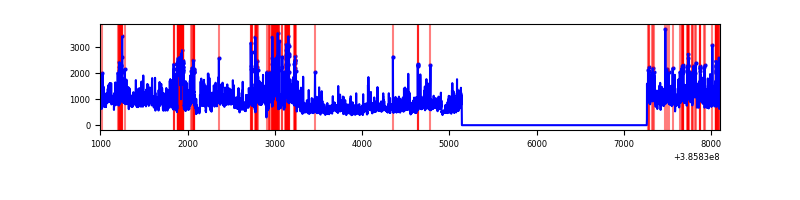 |
Top three noisy pixels from each quadrant. If the there are fewer than three noisy pixels in the level2.evt file, extra rows are filled as -1
| Pixel properties | Quadrant properties | ||||||
|---|---|---|---|---|---|---|---|
| Quadrant | DetID | PixID | Counts | Sigma | Mean | Median | Sigma |
| A | 10 | 83 | 80647 | 610.68 | 665 | 654 | 131.0 |
| A | 13 | 6 | 9040 | 64.02 | 665 | 654 | 131.0 |
| A | 13 | 254 | 8410 | 59.21 | 665 | 654 | 131.0 |
| B | 5 | 172 | 231235 | 1886.45 | 659 | 644 | 122.2 |
| B | 0 | 189 | 176890 | 1441.85 | 659 | 644 | 122.2 |
| B | 15 | 85 | 71482 | 579.52 | 659 | 644 | 122.2 |
| C | 0 | 10 | 209955 | 1412.63 | 650 | 657 | 148.2 |
| C | 15 | 214 | 207498 | 1396.05 | 650 | 657 | 148.2 |
| C | 14 | 67 | 75719 | 506.62 | 650 | 657 | 148.2 |
| D | 8 | 195 | 1738722 | 11247.49 | 641 | 626 | 154.5 |
| D | 13 | 249 | 278321 | 1797.01 | 641 | 626 | 154.5 |
| D | 10 | 118 | 225512 | 1455.27 | 641 | 626 | 154.5 |
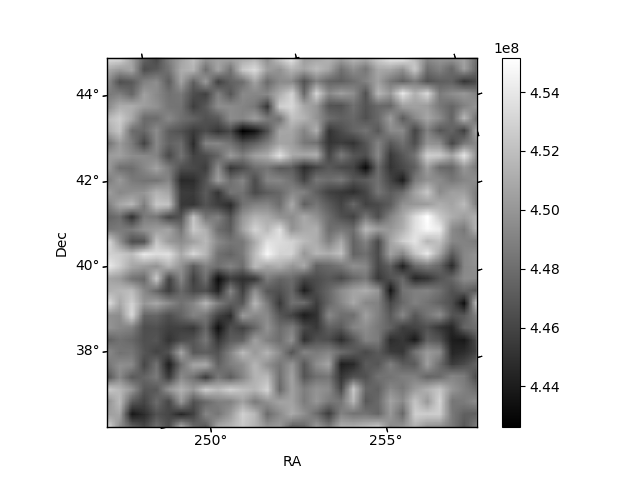
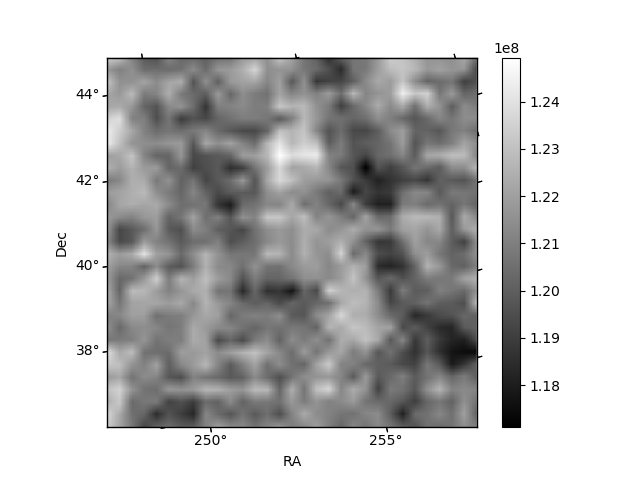
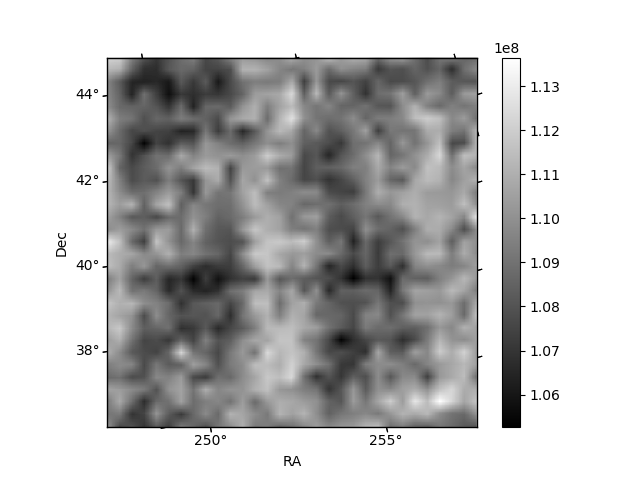
Histogram calculated using DETX and DETY for each event in the final _common_clean file
| Quadrant A | 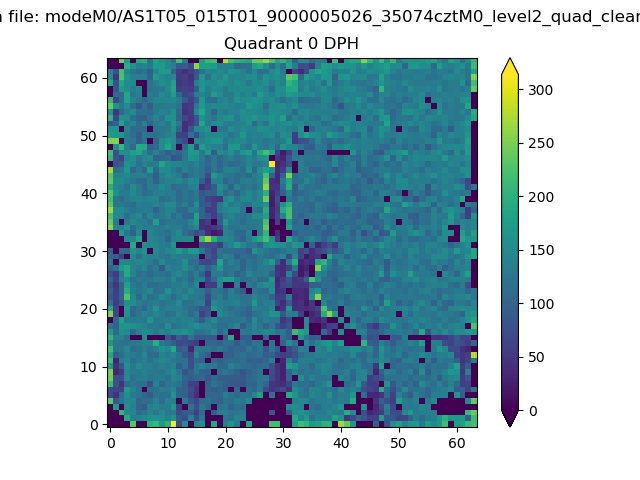 |
 |
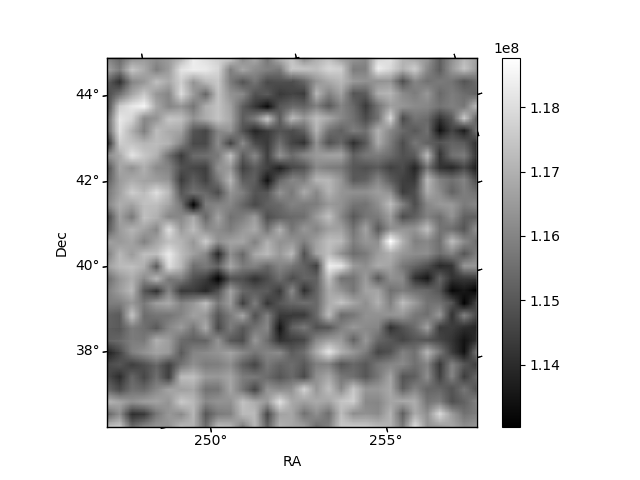
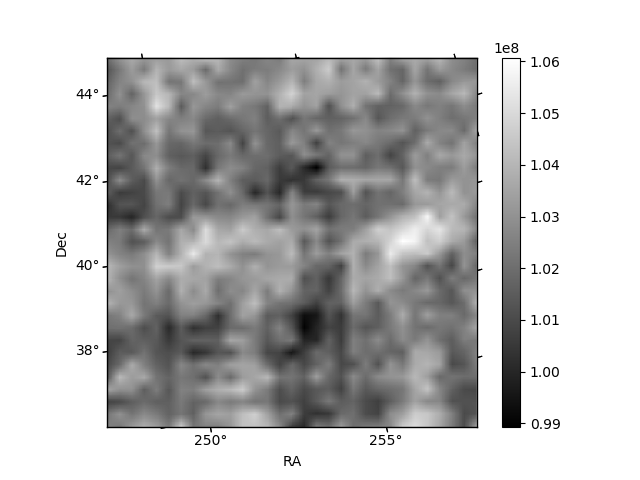
Quadrant B |
|---|---|---|---|
| Quadrant D | 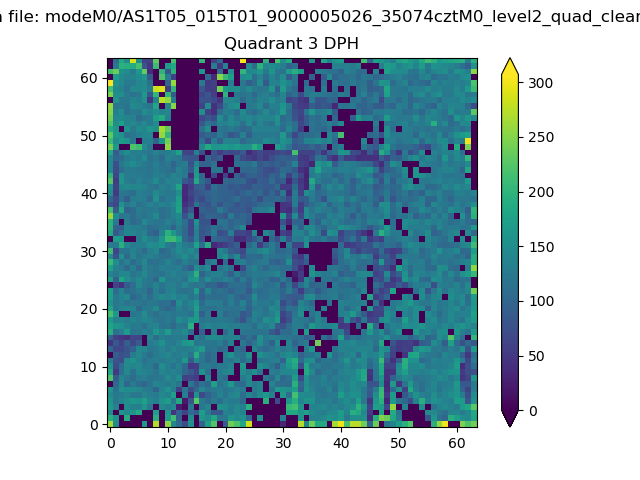 |
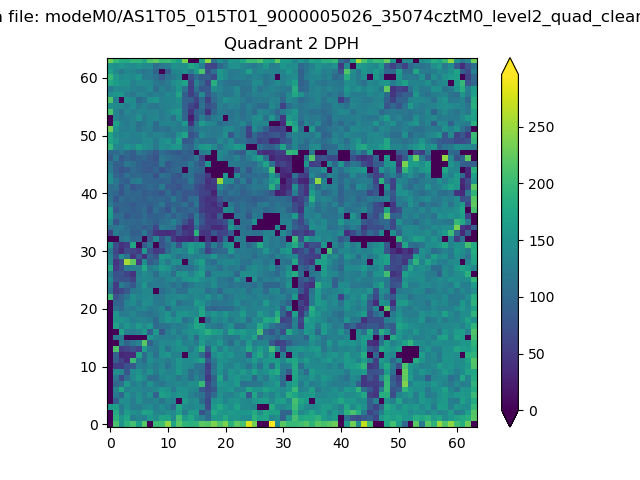 |
Quadrant C |
| Plot type | Count rate plots | Images |
|---|---|---|
| Comparison with Poisson distribution Blue bars denote a histogram of data divided into 1 sec bins. Red curve is a Poisson curve with rate = median count rate of data. |
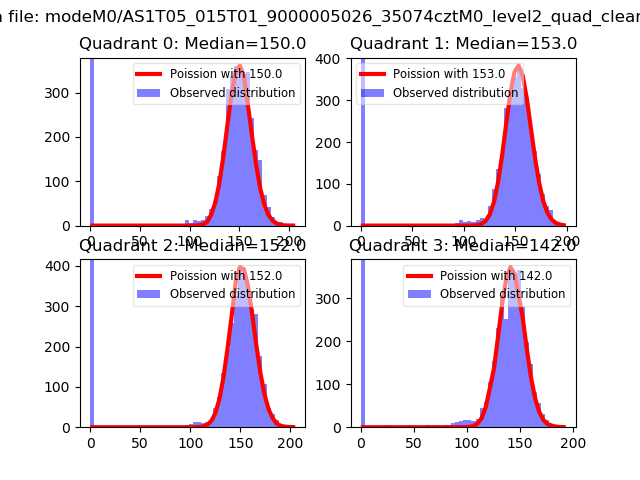 |
 |
| Quadrant-wise count rates Data is divided into 100 sec bins |
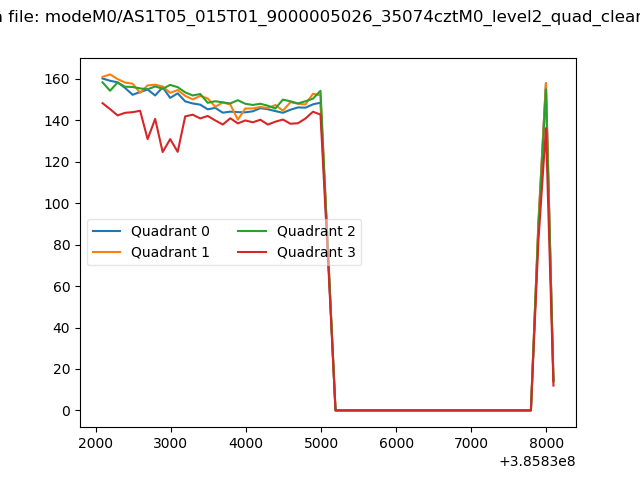 |
|
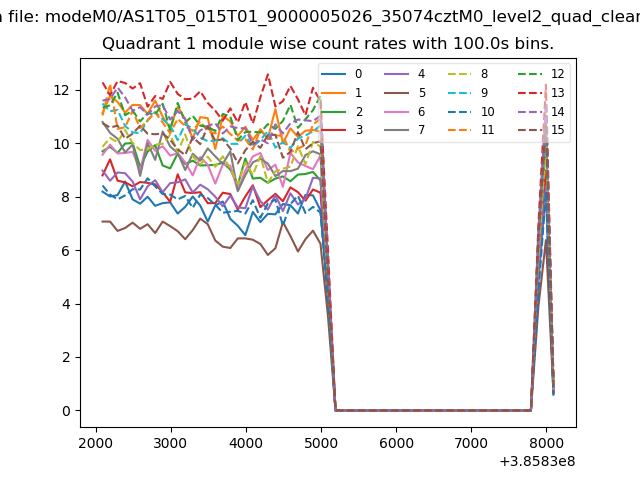
| Module-wise count rates for Quadrant A Data is divided into 100 sec bins |
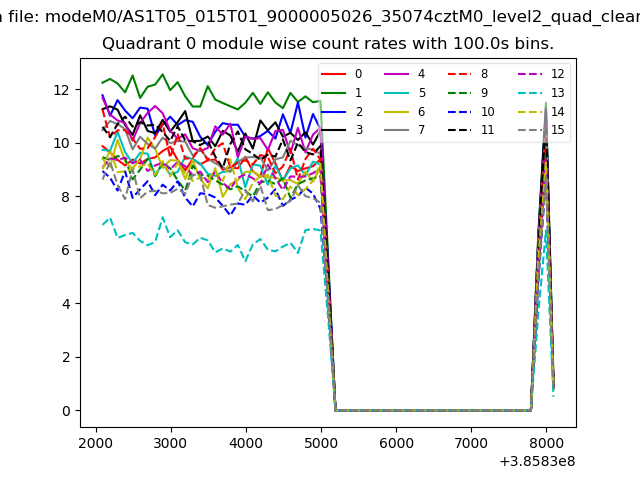 |
 |
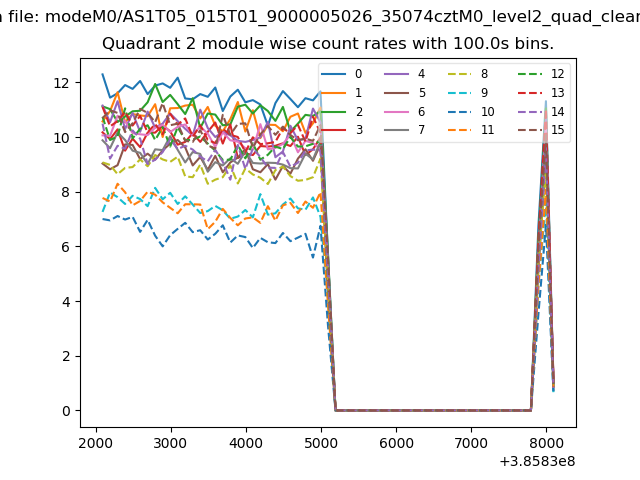
| Module-wise count rates for Quadrant B Data is divided into 100 sec bins |
 |
 |
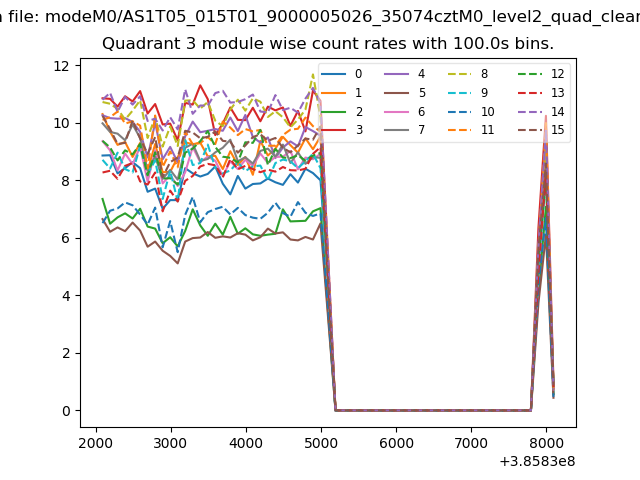
| Module-wise count rates for Quadrant C Data is divided into 100 sec bins |
 |
 |
| Module-wise count rates for Quadrant D Data is divided into 100 sec bins |
 |
 |
| Parameter | Plot |
|---|---|
| CZT HV Monitor | 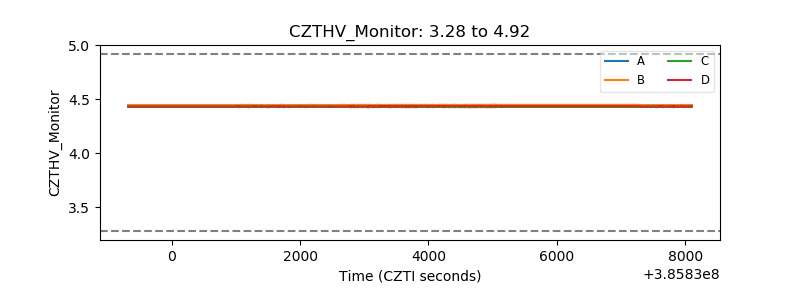 |
| D_VDD | 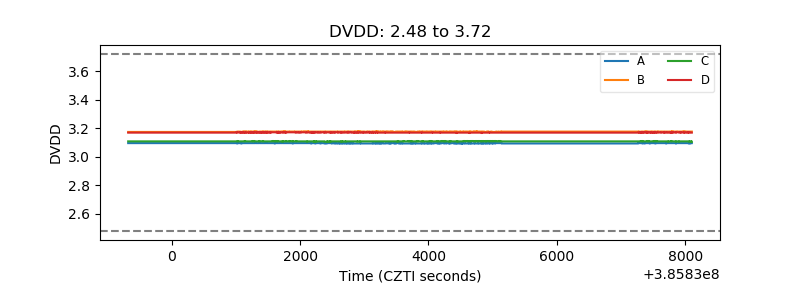 |
| Temperature 1 | 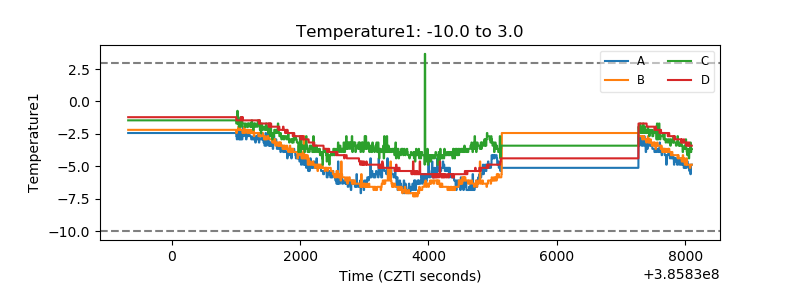 |
| Veto HV Monitor | 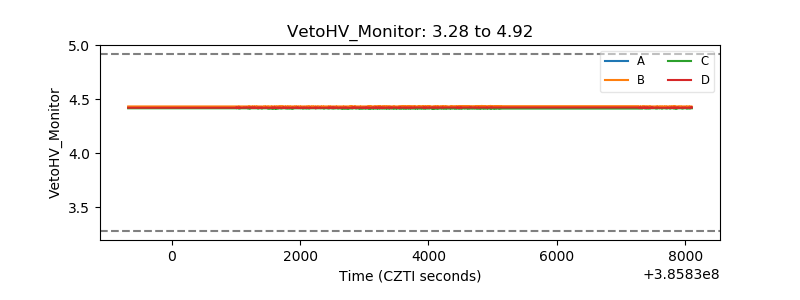 |
| Veto LLD | 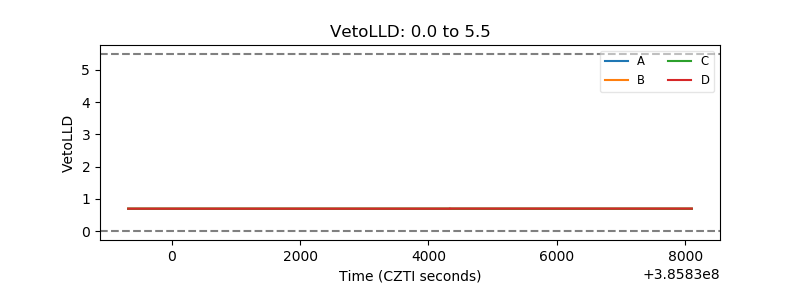 |
| Alpha Counter | 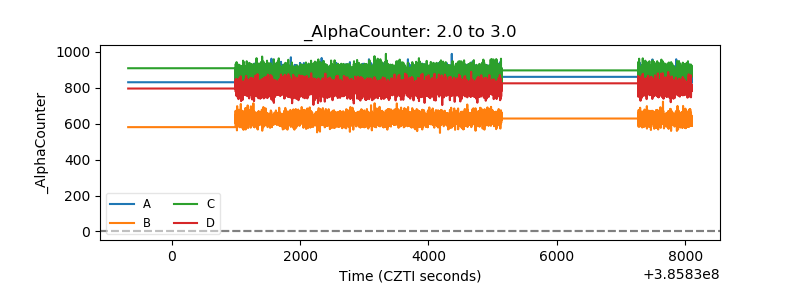 |
| _CPM_Rate | 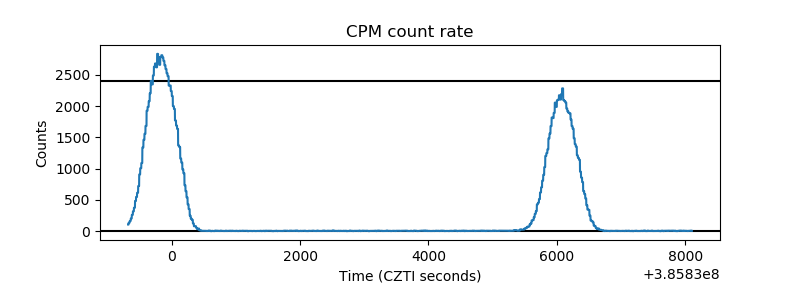 |
| CZT Counter | 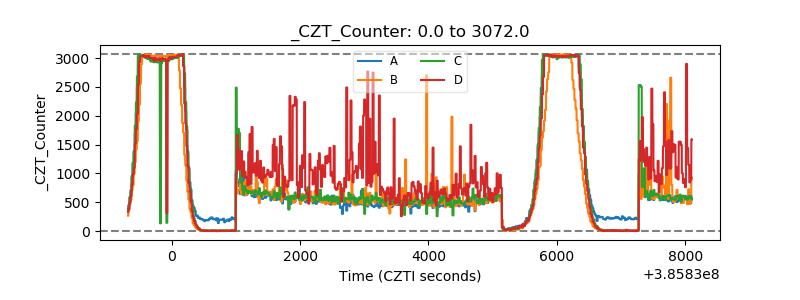 |
| +2.5 Volts monitor |  |
| +5 Volts monitor | 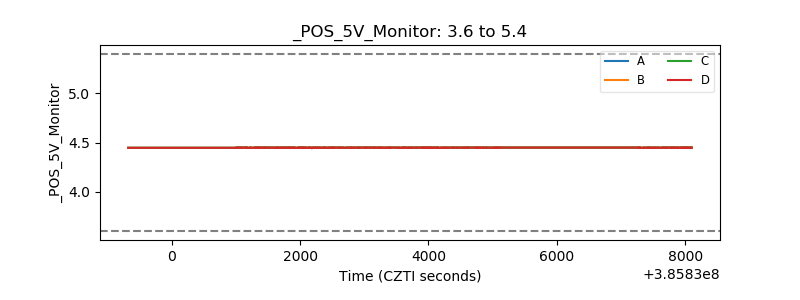 |
| _ROLL_ROT | 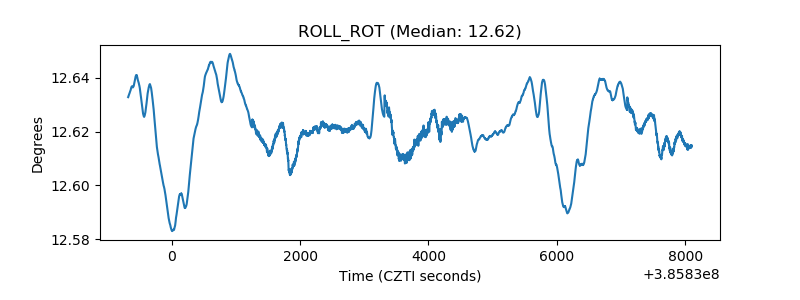 |
| _Roll_DEC | 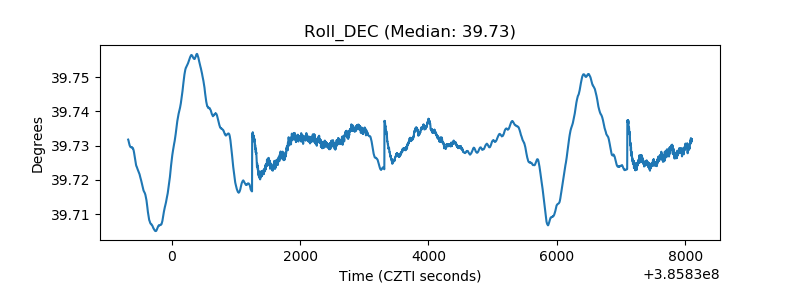 |
| _Roll_RA | 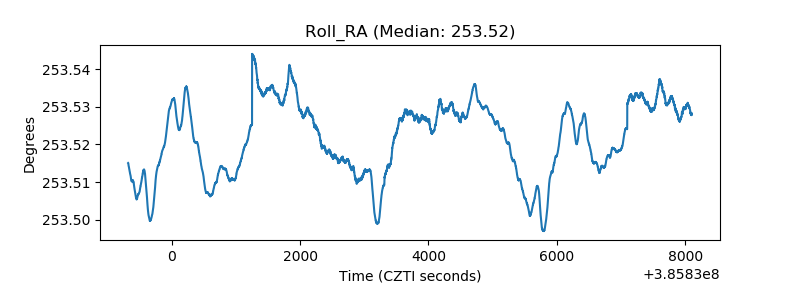 |
| Veto Counter | 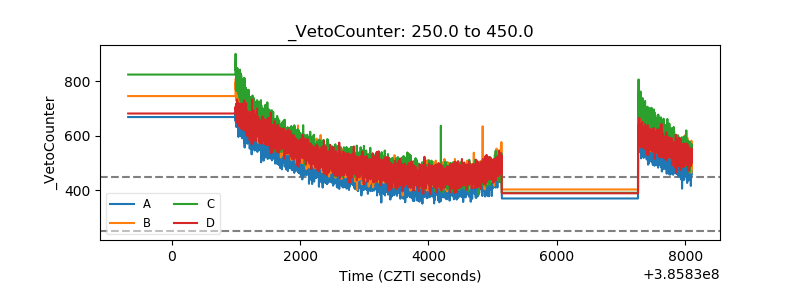 |