| Param | Original file | Final file |
|---|---|---|
| Filename | modeM0/AS1T05_015T01_9000005026_35072cztM0_level2.evt | modeM0/AS1T05_015T01_9000005026_35072cztM0_level2_quad_clean.evt |
| Size (bytes) | 474,900,480 | 55,975,680 |
| Size | 452.9 MB | 53.4 MB |
| Events in quadrant A | 2,864,993 | 333,086 |
| Events in quadrant B | 3,859,420 | 335,961 |
| Events in quadrant C | 3,206,822 | 332,700 |
| Events in quadrant D | 4,086,382 | 316,158 |
| Mode SS | |||
|---|---|---|---|
| Quadrant | BADHDUFLAG | Total packets | Discarded packets |
| A | 0 | 108 | 0 |
| B | 0 | 108 | 0 |
| C | 0 | 108 | 0 |
| D | 0 | 108 | 0 |
| Mode M9 | |||
|---|---|---|---|
| Quadrant | BADHDUFLAG | Total packets | Discarded packets |
| A | 0 | 24 | 0 |
| B | 0 | 24 | 0 |
| C | 0 | 24 | 0 |
| D | 0 | 25 | 0 |
| Mode M0 | |||
|---|---|---|---|
| Quadrant | BADHDUFLAG | Total packets | Discarded packets |
| A | 0 | 11841 | 3 |
| B | 0 | 14921 | 2 |
| C | 0 | 12725 | 2 |
| D | 0 | 16012 | 2 |
| Quadrant | Total seconds | Saturated seconds | Saturation percentage |
|---|---|---|---|
| A | 5387 | 13 | 0.241322% |
| B | 5387 | 231 | 4.288101% |
| C | 5387 | 64 | 1.188045% |
| D | 5387 | 189 | 3.508446% |
Noise dominated data is calculated using 1-second bins in cleaned event files. If a bin has >2000 counts, and if more than 50% of those come from <1% of pixels, then it is considered to be noise-dominated and hence unusable.
| Quadrant | # 1 sec bins | Bins with >0 counts | Bins with >2000 counts | High rate bins dominated by noise | Noise dominated (total time) | Noise dominated (detector-on time) | Marked lightcurve |
|---|---|---|---|---|---|---|---|
| A | 7331 | 5388 | 3 | 3 | 0.04% | 0.06% | 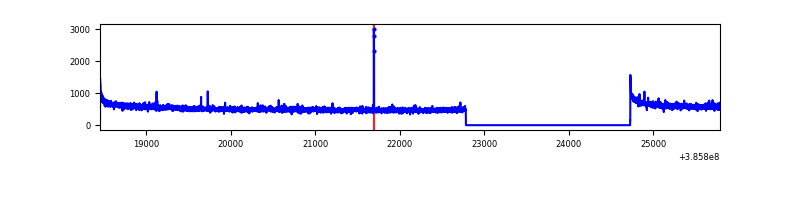 |
| B | 7331 | 5388 | 128 | 128 | 1.75% | 2.38% | 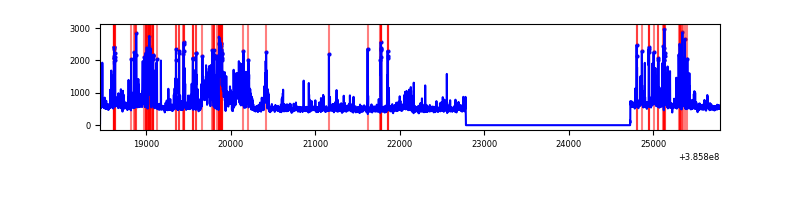 |
| C | 7331 | 5388 | 57 | 57 | 0.78% | 1.06% | 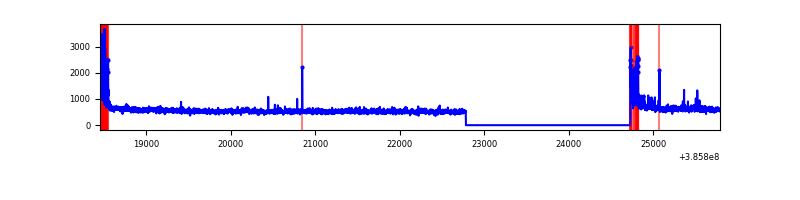 |
| D | 7331 | 5388 | 144 | 144 | 1.96% | 2.67% | 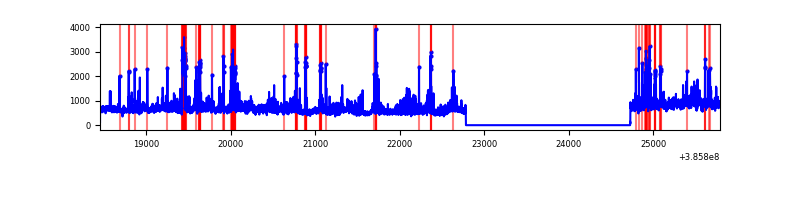 |
Top three noisy pixels from each quadrant. If the there are fewer than three noisy pixels in the level2.evt file, extra rows are filled as -1
| Pixel properties | Quadrant properties | ||||||
|---|---|---|---|---|---|---|---|
| Quadrant | DetID | PixID | Counts | Sigma | Mean | Median | Sigma |
| A | 10 | 83 | 80740 | 562.01 | 715 | 704 | 142.4 |
| A | 9 | 143 | 11807 | 77.96 | 715 | 704 | 142.4 |
| A | 13 | 6 | 9580 | 62.33 | 715 | 704 | 142.4 |
| B | 5 | 172 | 915145 | 7012.87 | 696 | 679 | 130.4 |
| B | 0 | 189 | 73857 | 561.19 | 696 | 679 | 130.4 |
| B | 0 | 190 | 56777 | 430.21 | 696 | 679 | 130.4 |
| C | 15 | 214 | 226061 | 1430.06 | 688 | 695 | 157.6 |
| C | 0 | 10 | 204156 | 1291.06 | 688 | 695 | 157.6 |
| C | 14 | 67 | 54784 | 343.22 | 688 | 695 | 157.6 |
| D | 8 | 195 | 696676 | 4201.38 | 686 | 670 | 165.7 |
| D | 2 | 250 | 156255 | 939.17 | 686 | 670 | 165.7 |
| D | 13 | 249 | 146647 | 881.18 | 686 | 670 | 165.7 |
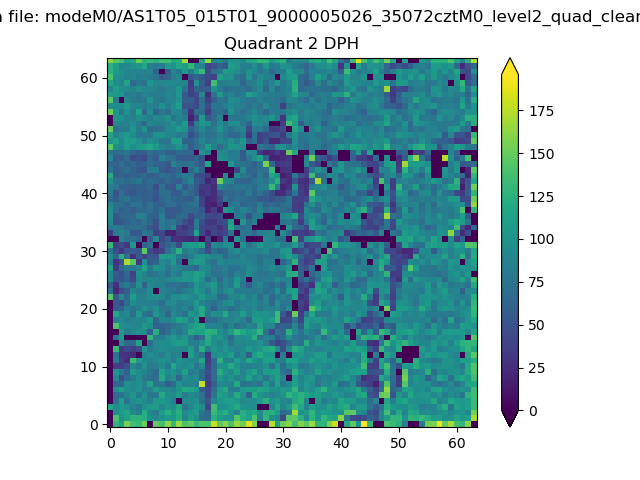
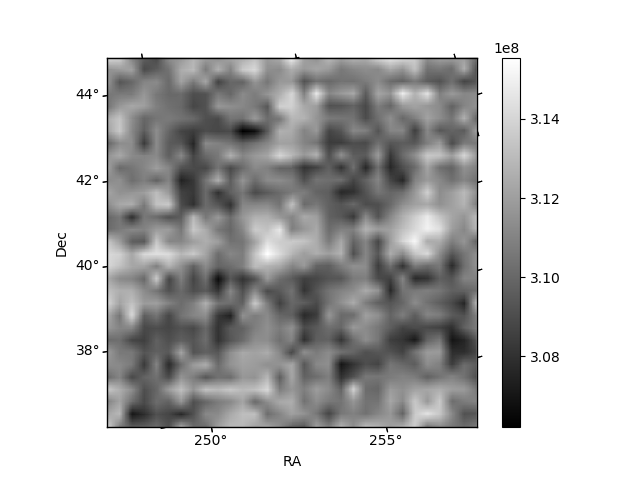
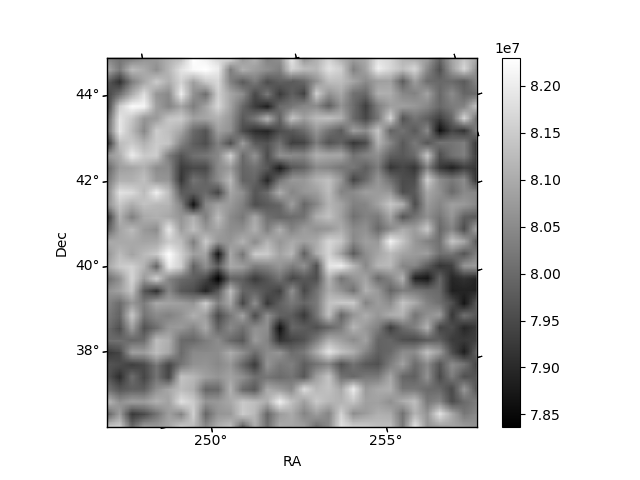
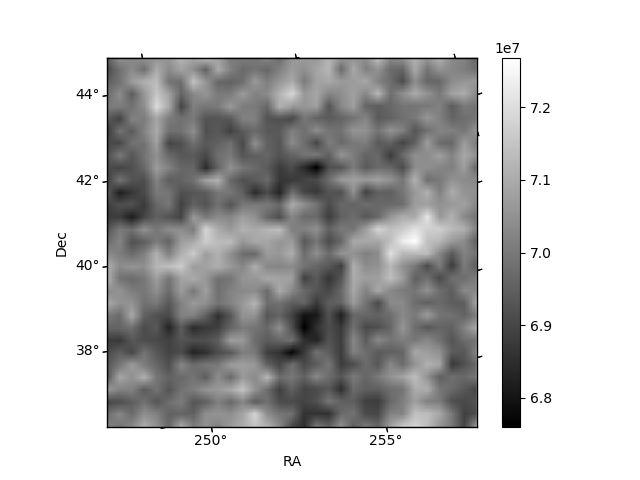
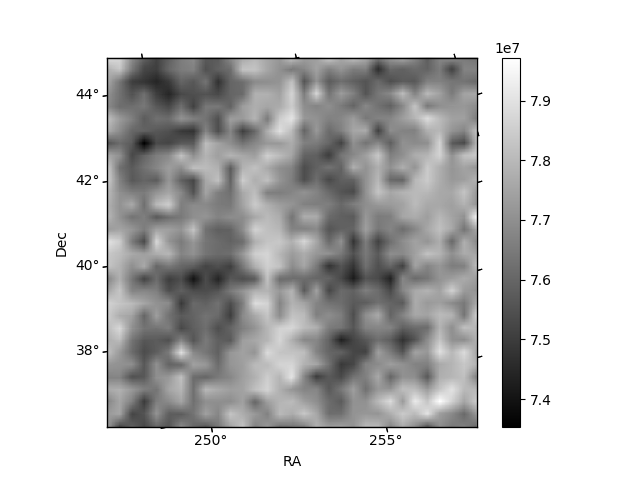
Histogram calculated using DETX and DETY for each event in the final _common_clean file
| Quadrant A | 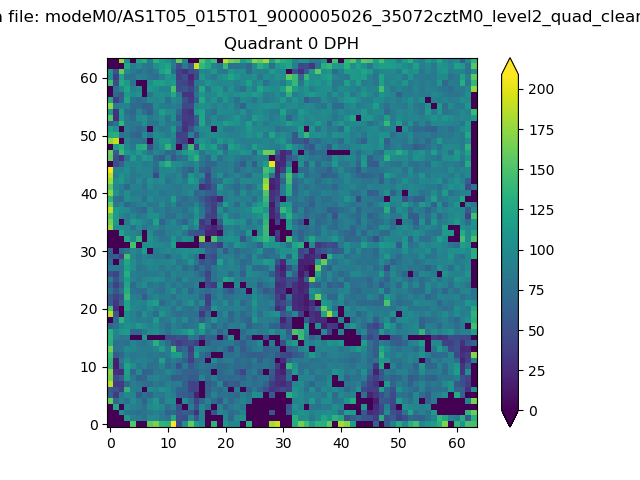 |
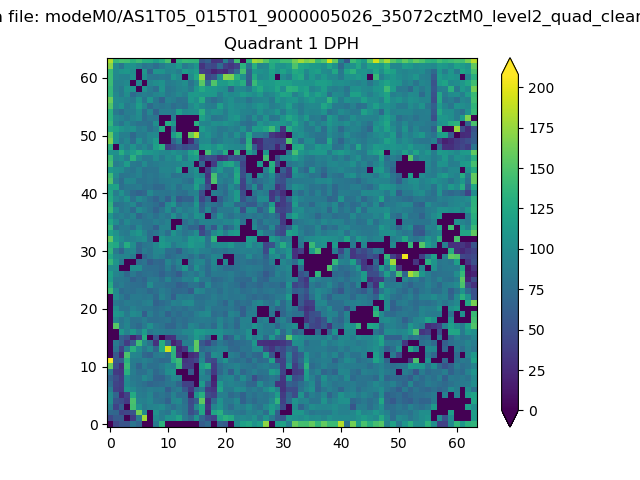 |
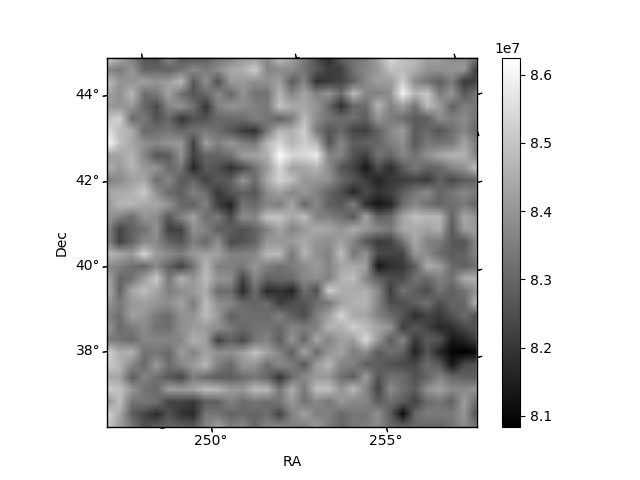
Quadrant B |
|---|---|---|---|
| Quadrant D | 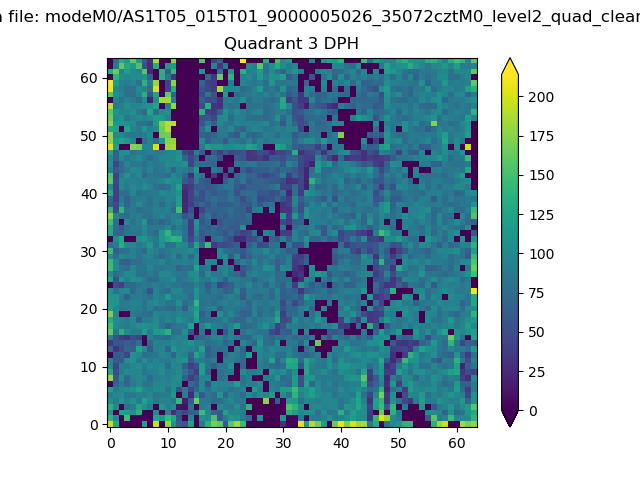 |
 |
Quadrant C |
| Plot type | Count rate plots | Images |
|---|---|---|
| Comparison with Poisson distribution Blue bars denote a histogram of data divided into 1 sec bins. Red curve is a Poisson curve with rate = median count rate of data. |
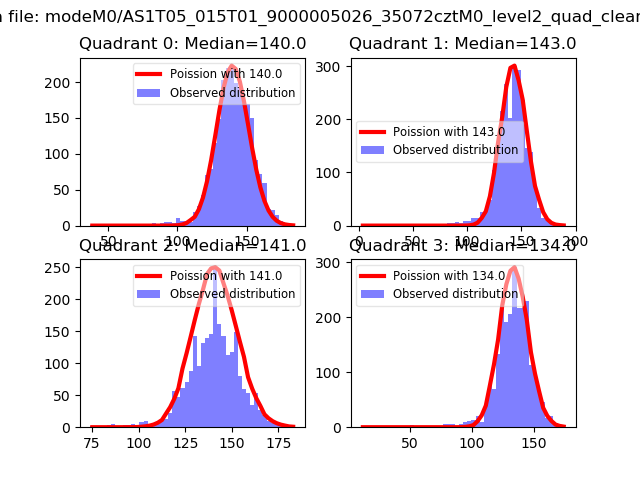 |
 |
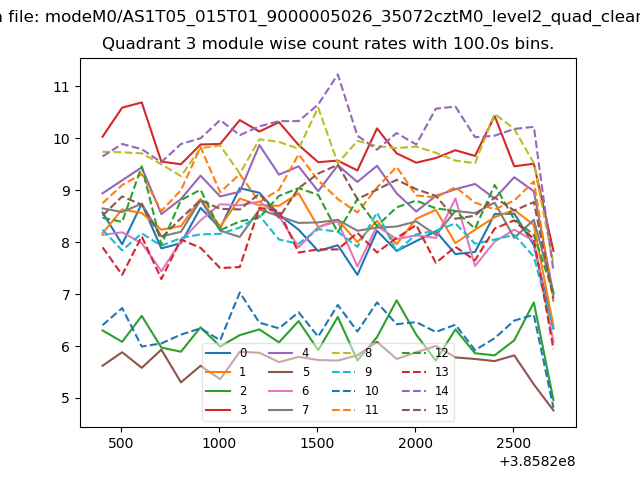
| Quadrant-wise count rates Data is divided into 100 sec bins |
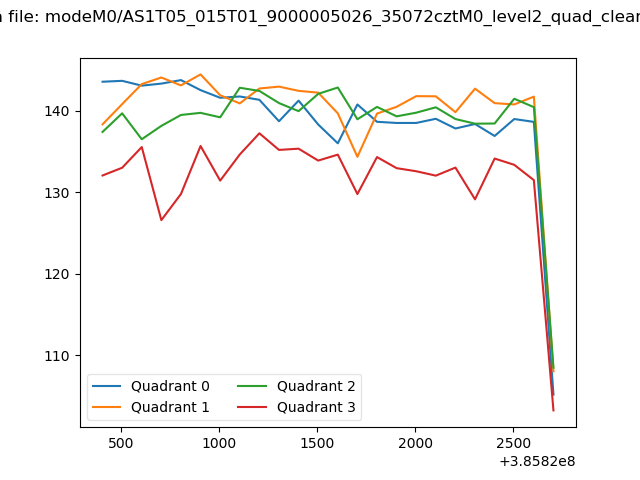 |
|
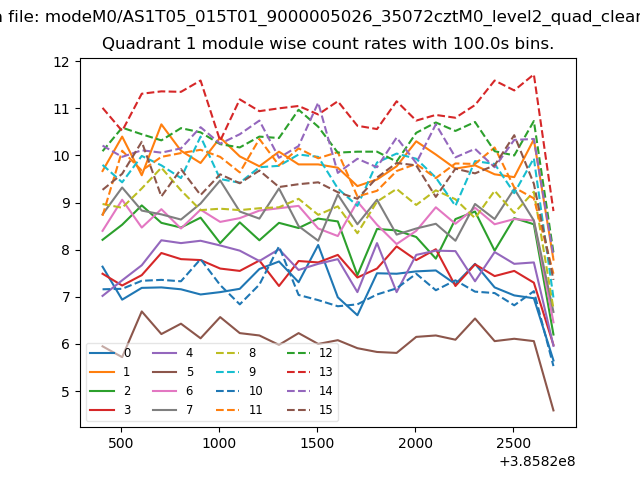
| Module-wise count rates for Quadrant A Data is divided into 100 sec bins |
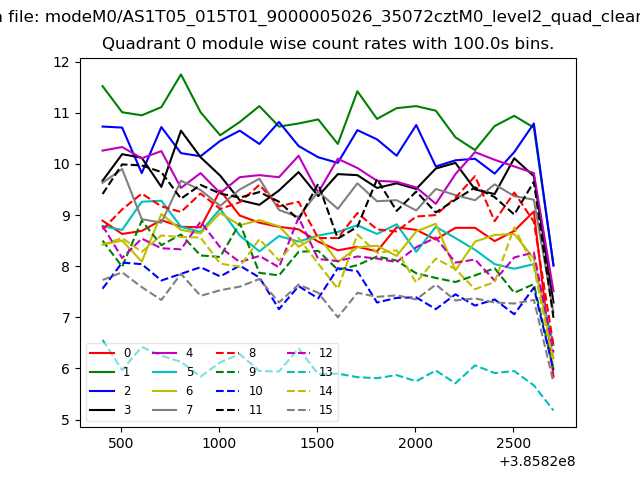 |
 |
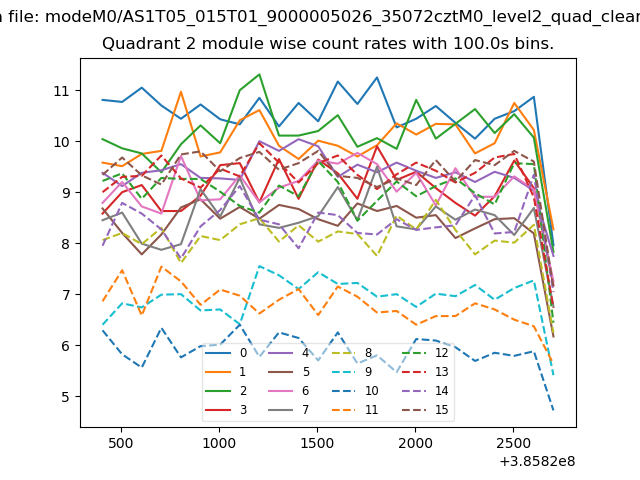
| Module-wise count rates for Quadrant B Data is divided into 100 sec bins |
 |
 |
| Module-wise count rates for Quadrant C Data is divided into 100 sec bins |
 |
 |
| Module-wise count rates for Quadrant D Data is divided into 100 sec bins |
 |
 |
| Parameter | Plot |
|---|---|
| CZT HV Monitor | 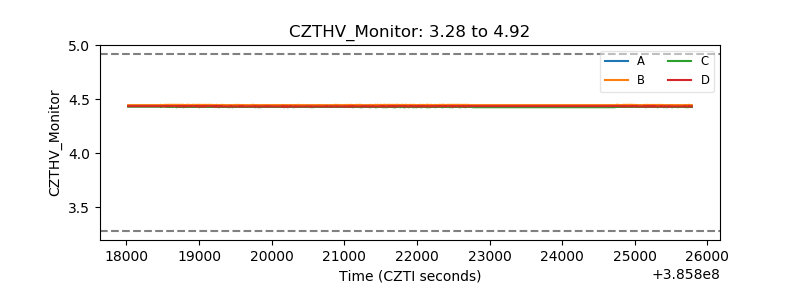 |
| D_VDD | 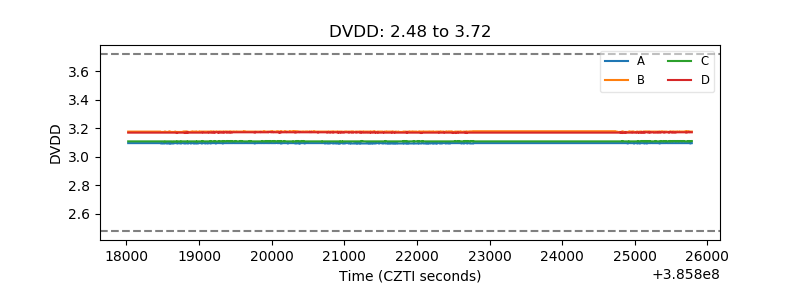 |
| Temperature 1 | 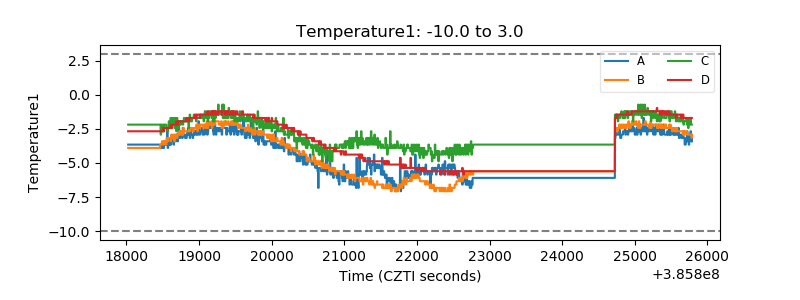 |
| Veto HV Monitor | 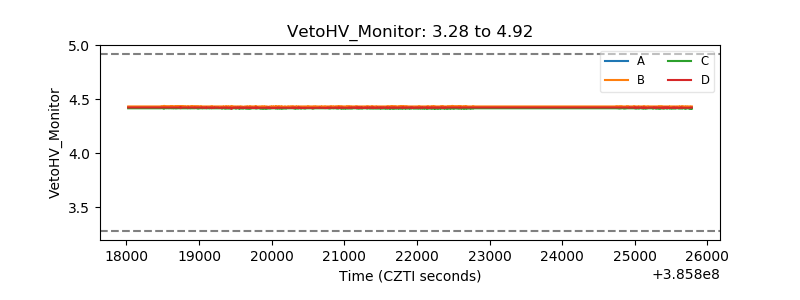 |
| Veto LLD | 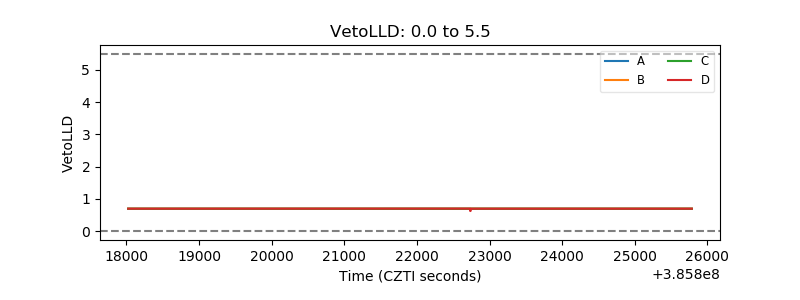 |
| Alpha Counter | 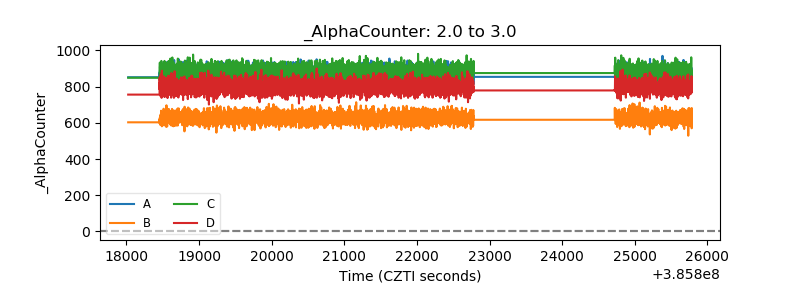 |
| _CPM_Rate | 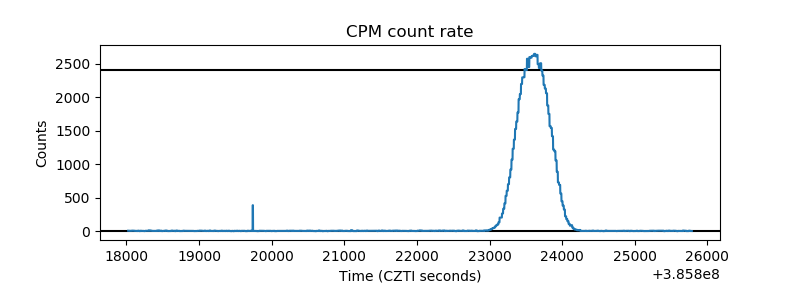 |
| CZT Counter | 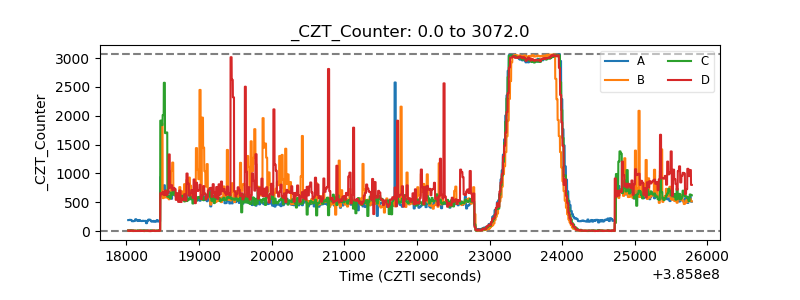 |
| +2.5 Volts monitor | 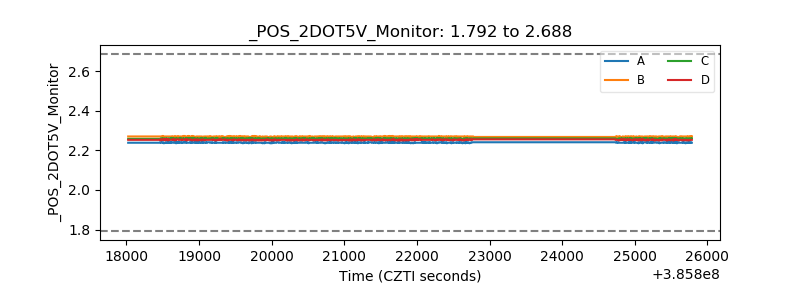 |
| +5 Volts monitor | 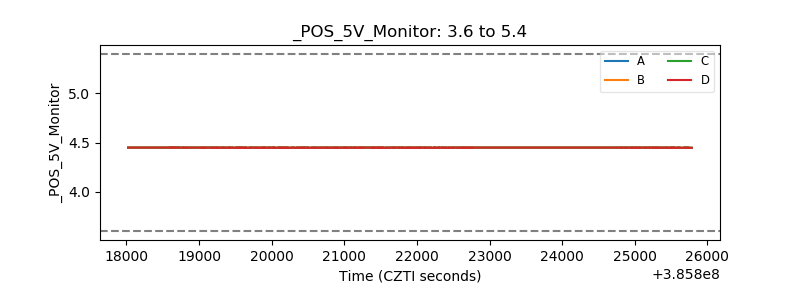 |
| _ROLL_ROT | 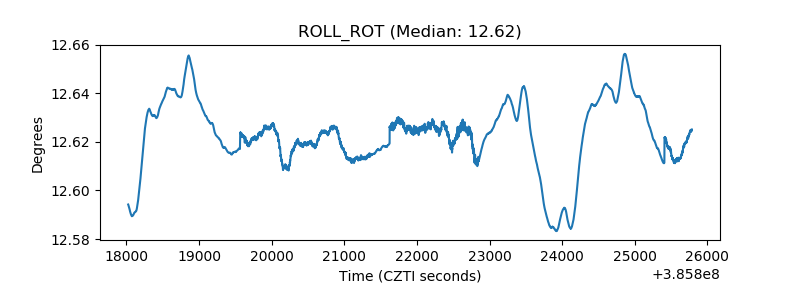 |
| _Roll_DEC | 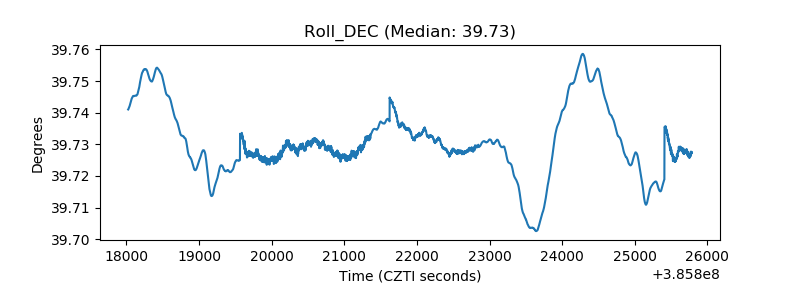 |
| _Roll_RA | 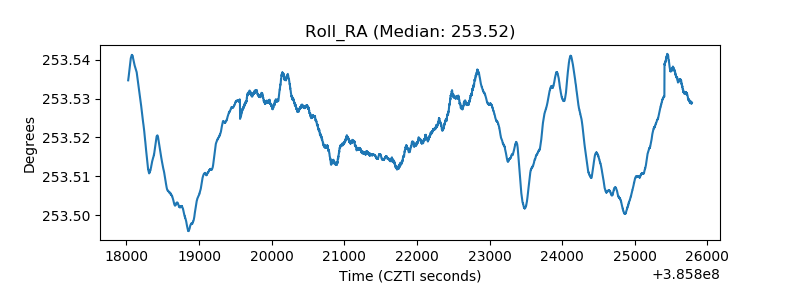 |
| Veto Counter | 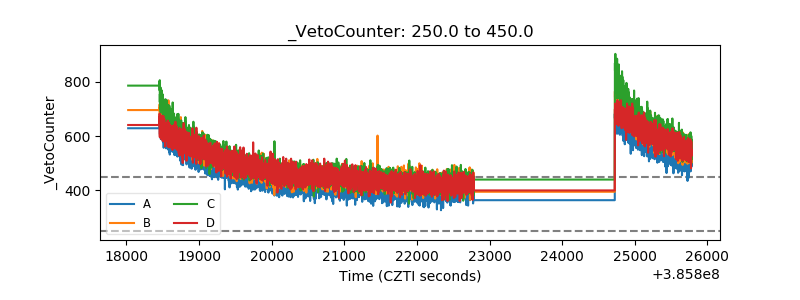 |