| Param | Original file | Final file |
|---|---|---|
| Filename | modeM0/AS1T05_015T01_9000005026_35068cztM0_level2.evt | modeM0/AS1T05_015T01_9000005026_35068cztM0_level2_quad_clean.evt |
| Size (bytes) | 515,041,920 | 64,016,640 |
| Size | 491.2 MB | 61.1 MB |
| Events in quadrant A | 2,667,600 | 395,629 |
| Events in quadrant B | 3,763,335 | 405,266 |
| Events in quadrant C | 2,758,819 | 400,114 |
| Events in quadrant D | 6,041,395 | 358,118 |
| Mode SS | |||
|---|---|---|---|
| Quadrant | BADHDUFLAG | Total packets | Discarded packets |
| A | 0 | 112 | 0 |
| B | 0 | 112 | 0 |
| C | 0 | 112 | 0 |
| D | 0 | 112 | 0 |
| Mode M9 | |||
|---|---|---|---|
| Quadrant | BADHDUFLAG | Total packets | Discarded packets |
| A | 0 | 15 | 0 |
| B | 0 | 15 | 0 |
| C | 0 | 15 | 0 |
| D | 0 | 15 | 0 |
| Mode M0 | |||
|---|---|---|---|
| Quadrant | BADHDUFLAG | Total packets | Discarded packets |
| A | 0 | 11307 | 2 |
| B | 0 | 14588 | 1 |
| C | 0 | 11238 | 1 |
| D | 0 | 21861 | 1 |
| Quadrant | Total seconds | Saturated seconds | Saturation percentage |
|---|---|---|---|
| A | 5408 | 40 | 0.739645% |
| B | 5408 | 436 | 8.062130% |
| C | 5408 | 23 | 0.425296% |
| D | 5408 | 522 | 9.652367% |
Noise dominated data is calculated using 1-second bins in cleaned event files. If a bin has >2000 counts, and if more than 50% of those come from <1% of pixels, then it is considered to be noise-dominated and hence unusable.
| Quadrant | # 1 sec bins | Bins with >0 counts | Bins with >2000 counts | High rate bins dominated by noise | Noise dominated (total time) | Noise dominated (detector-on time) | Marked lightcurve |
|---|---|---|---|---|---|---|---|
| A | 6961 | 5409 | 33 | 33 | 0.47% | 0.61% | 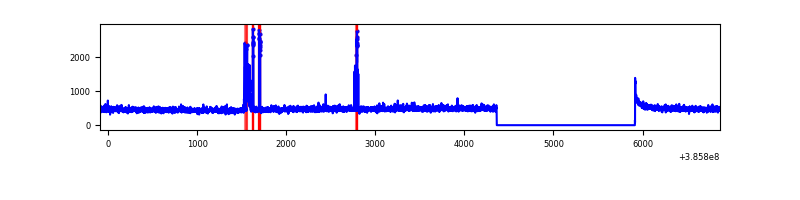 |
| B | 6961 | 5409 | 341 | 341 | 4.90% | 6.30% | 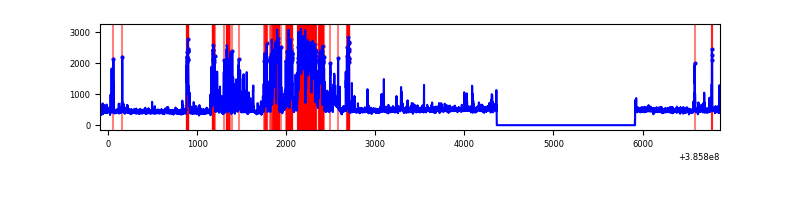 |
| C | 6961 | 5409 | 20 | 20 | 0.29% | 0.37% | 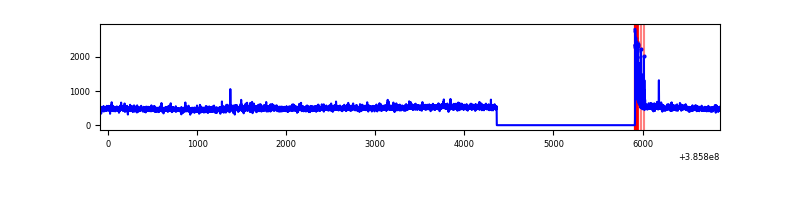 |
| D | 6961 | 5409 | 480 | 480 | 6.90% | 8.87% | 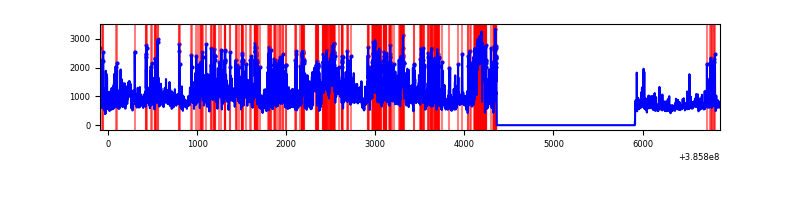 |
Top three noisy pixels from each quadrant. If the there are fewer than three noisy pixels in the level2.evt file, extra rows are filled as -1
| Pixel properties | Quadrant properties | ||||||
|---|---|---|---|---|---|---|---|
| Quadrant | DetID | PixID | Counts | Sigma | Mean | Median | Sigma |
| A | 15 | 174 | 99952 | 769.35 | 635 | 621 | 129.1 |
| A | 10 | 83 | 55631 | 426.07 | 635 | 621 | 129.1 |
| A | 9 | 143 | 34969 | 266.03 | 635 | 621 | 129.1 |
| B | 5 | 172 | 1291198 | 10874.95 | 611 | 594 | 118.7 |
| B | 4 | 232 | 19063 | 155.62 | 611 | 594 | 118.7 |
| B | 0 | 190 | 18188 | 148.25 | 611 | 594 | 118.7 |
| C | 15 | 214 | 225849 | 1563.75 | 615 | 618 | 144.0 |
| C | 0 | 10 | 78165 | 538.4 | 615 | 618 | 144.0 |
| C | 14 | 67 | 49550 | 339.73 | 615 | 618 | 144.0 |
| D | 8 | 195 | 1876129 | 12829.65 | 597 | 581 | 146.2 |
| D | 2 | 250 | 806886 | 5515.51 | 597 | 581 | 146.2 |
| D | 1 | 47 | 370783 | 2532.36 | 597 | 581 | 146.2 |
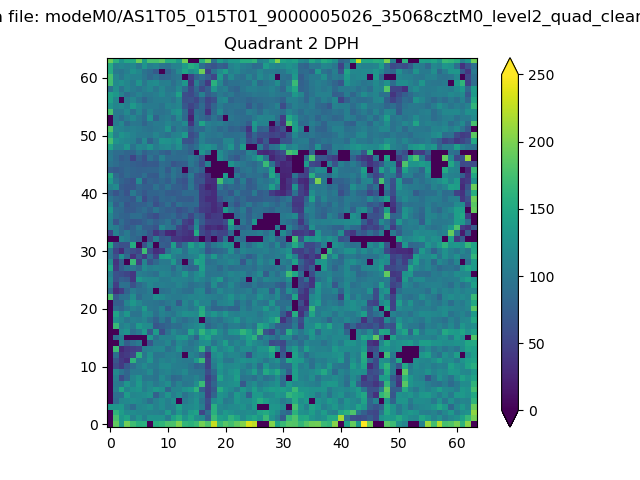
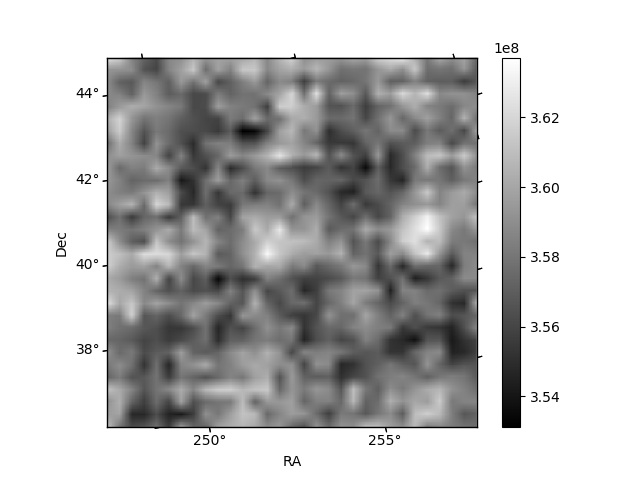
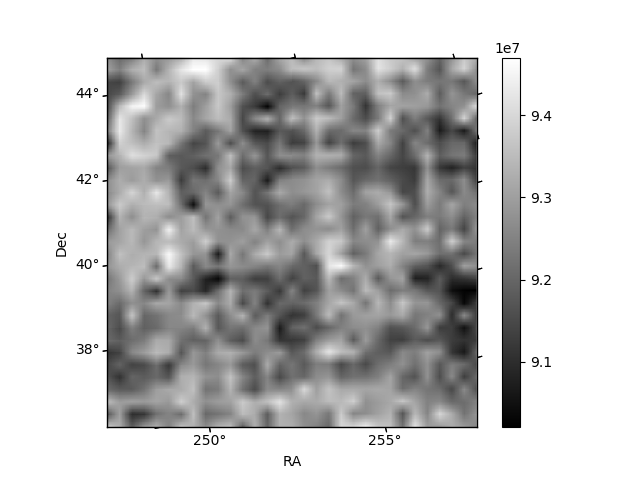
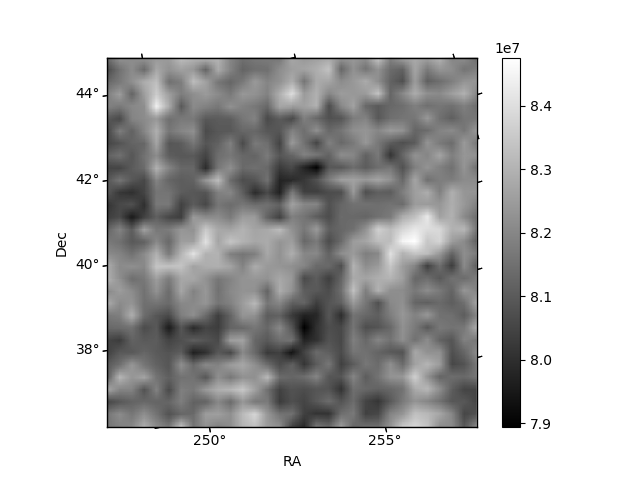
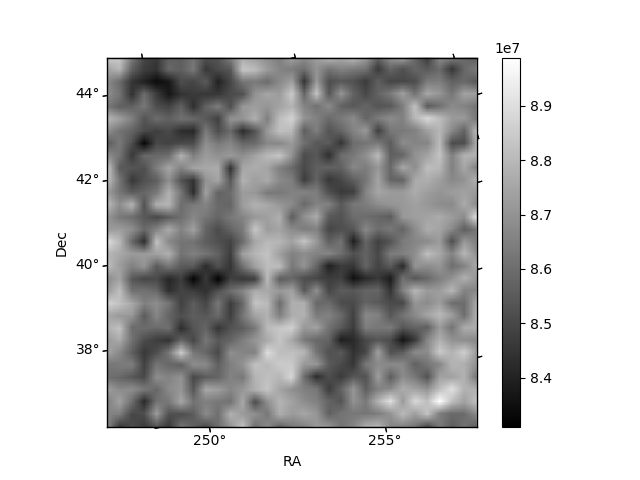
Histogram calculated using DETX and DETY for each event in the final _common_clean file
| Quadrant A | 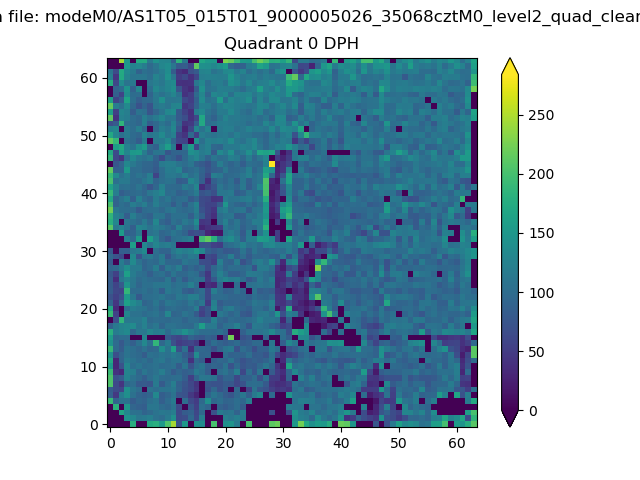 |
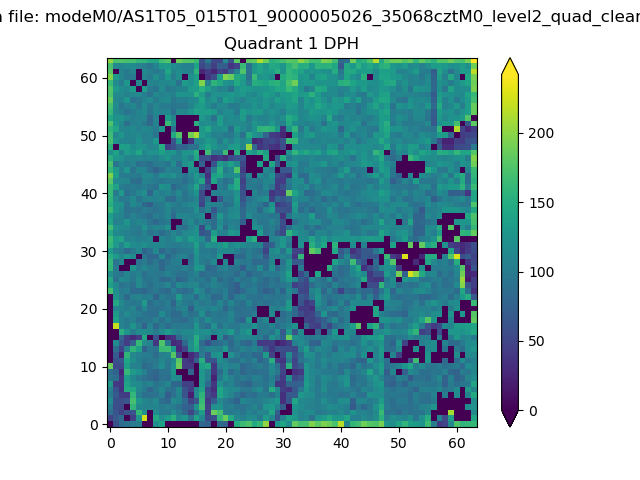 |
Quadrant B |
|---|---|---|---|
| Quadrant D | 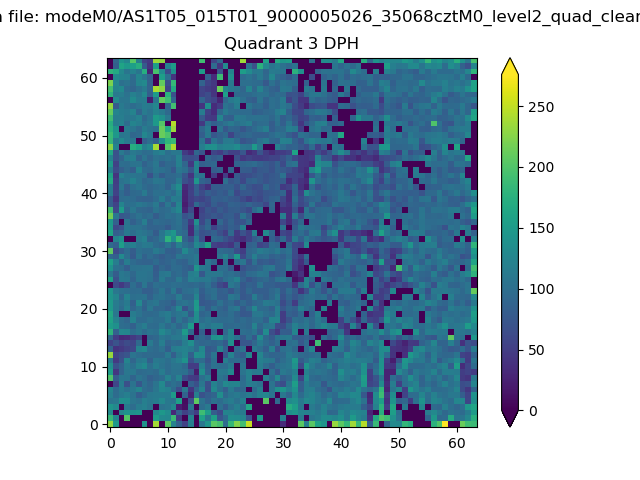 |
 |
Quadrant C |
| Plot type | Count rate plots | Images |
|---|---|---|
| Comparison with Poisson distribution Blue bars denote a histogram of data divided into 1 sec bins. Red curve is a Poisson curve with rate = median count rate of data. |
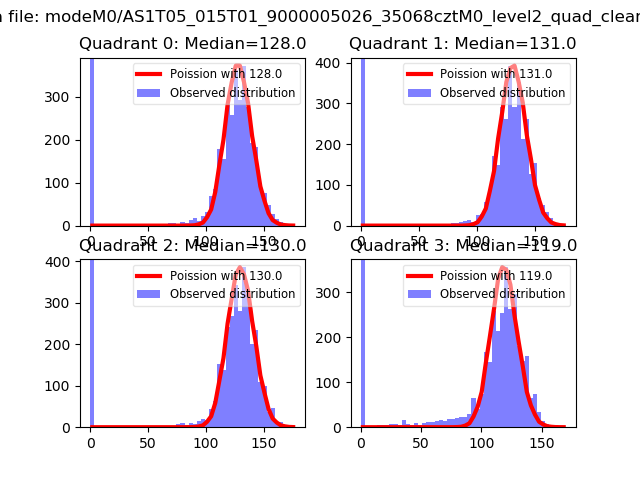 |
 |
| Quadrant-wise count rates Data is divided into 100 sec bins |
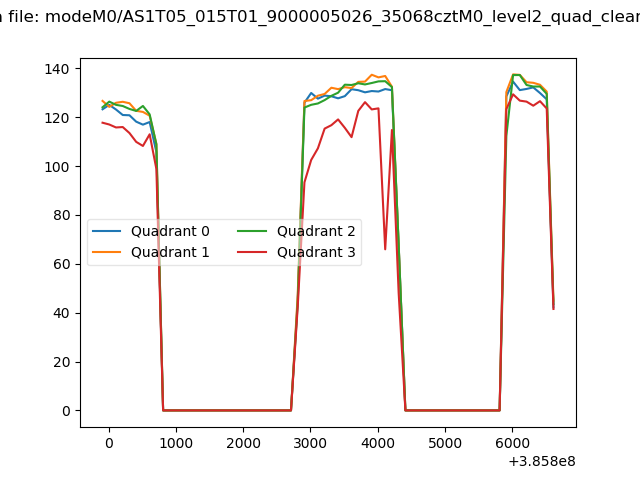 |
|
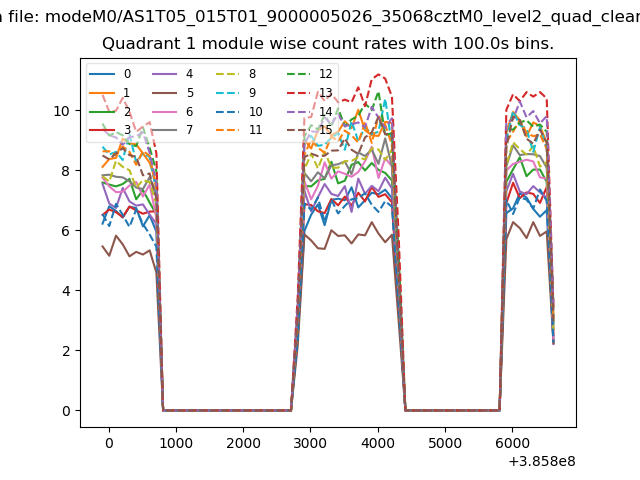
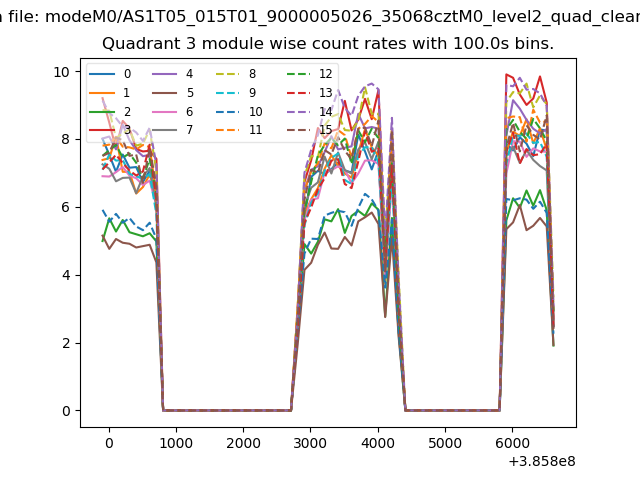
| Module-wise count rates for Quadrant A Data is divided into 100 sec bins |
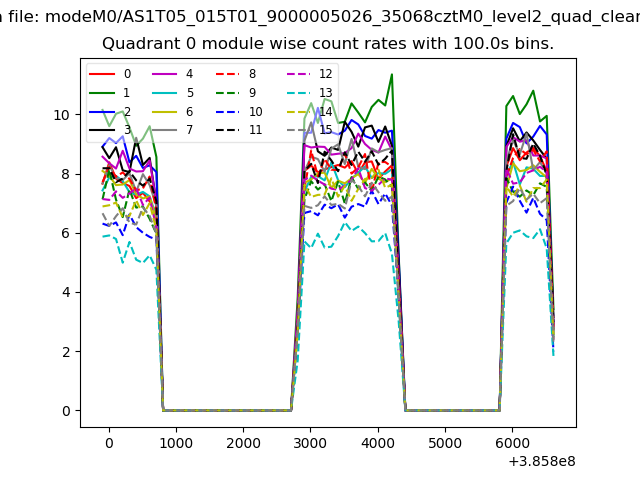 |
 |
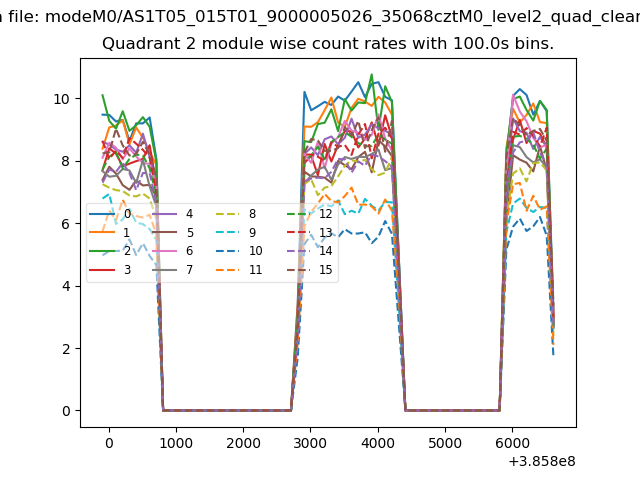
| Module-wise count rates for Quadrant B Data is divided into 100 sec bins |
 |
 |
| Module-wise count rates for Quadrant C Data is divided into 100 sec bins |
 |
 |
| Module-wise count rates for Quadrant D Data is divided into 100 sec bins |
 |
 |
| Parameter | Plot |
|---|---|
| CZT HV Monitor | 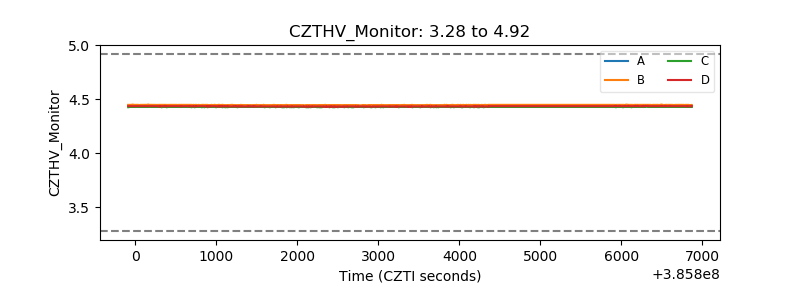 |
| D_VDD | 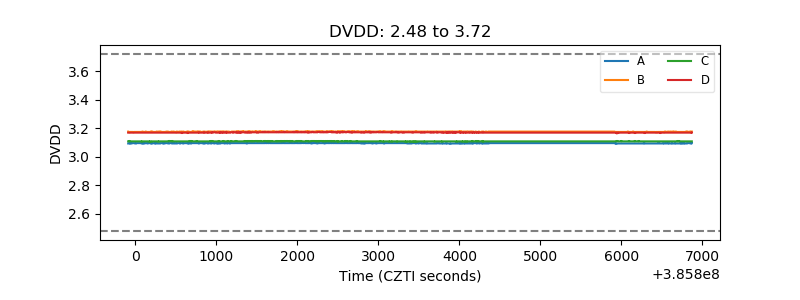 |
| Temperature 1 | 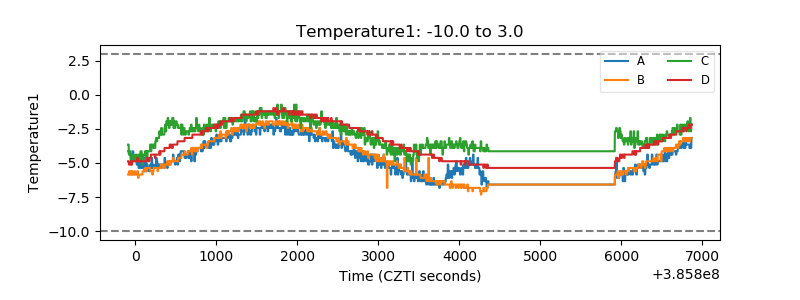 |
| Veto HV Monitor | 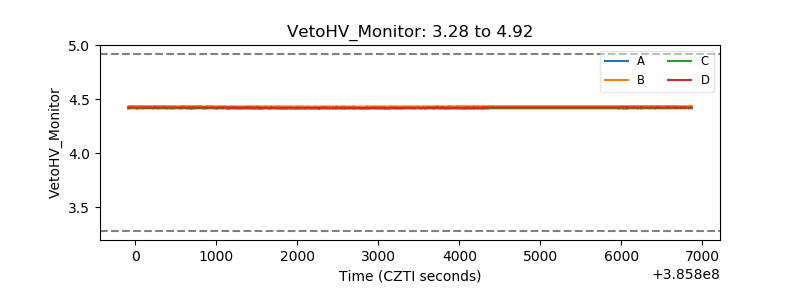 |
| Veto LLD |  |
| Alpha Counter | 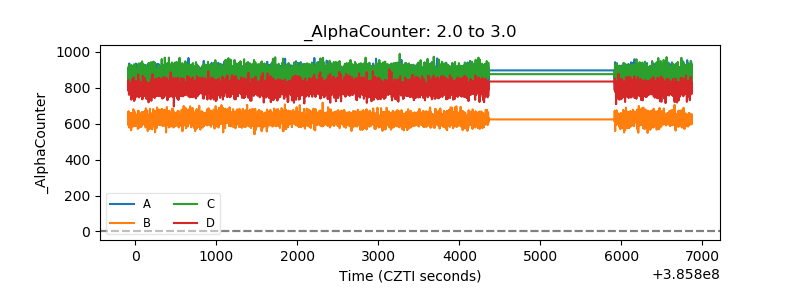 |
| _CPM_Rate | 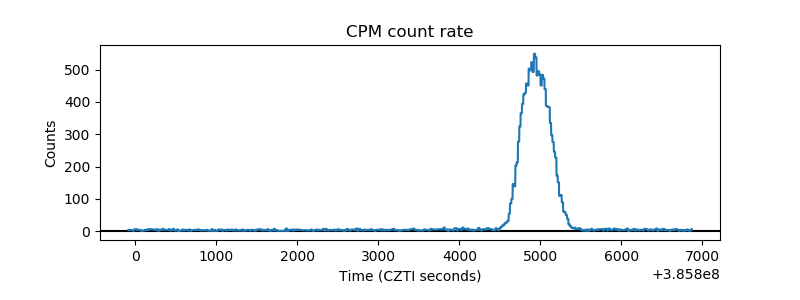 |
| CZT Counter |  |
| +2.5 Volts monitor | 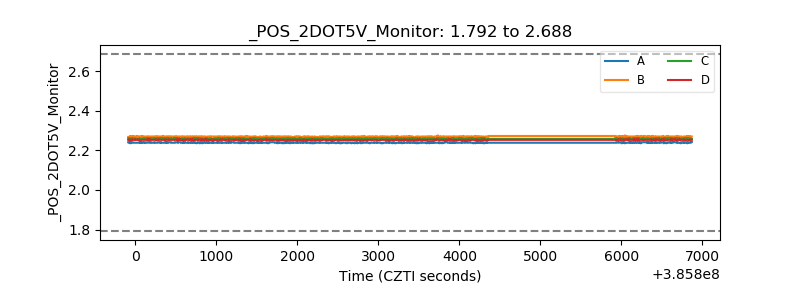 |
| +5 Volts monitor | 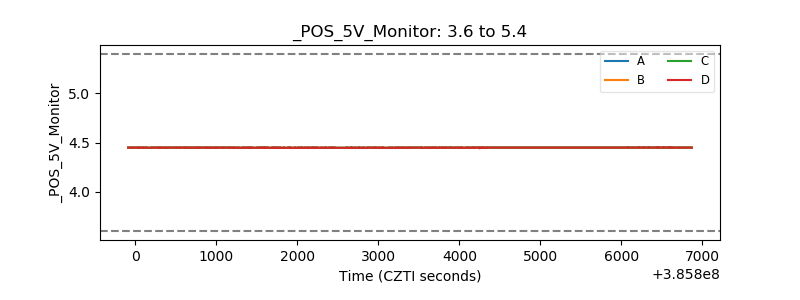 |
| _ROLL_ROT | 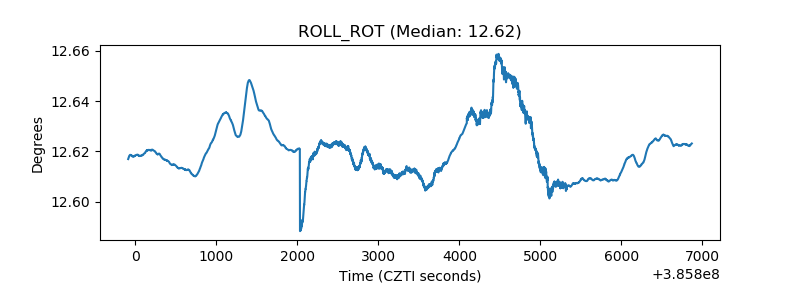 |
| _Roll_DEC | 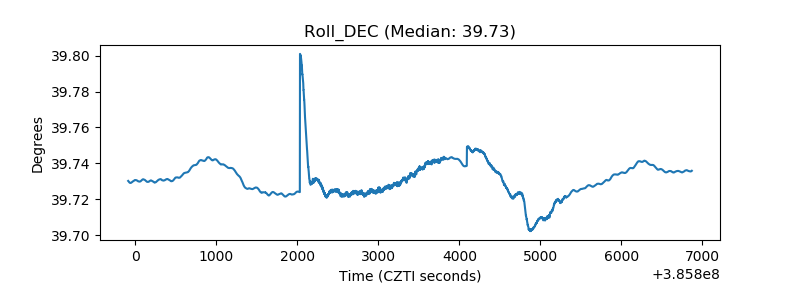 |
| _Roll_RA | 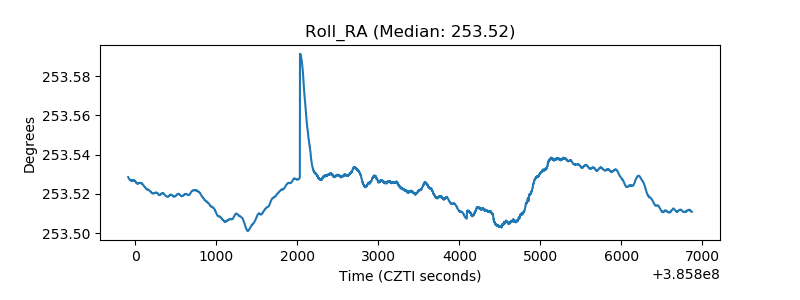 |
| Veto Counter | 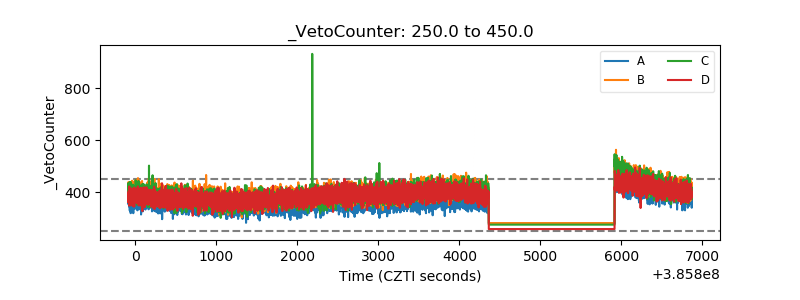 |