| Param | Original file | Final file |
|---|---|---|
| Filename | modeM0/AS1T05_015T01_9000005026_35067cztM0_level2.evt | modeM0/AS1T05_015T01_9000005026_35067cztM0_level2_quad_clean.evt |
| Size (bytes) | 122,699,520 | 26,222,400 |
| Size | 117.0 MB | 25.0 MB |
| Events in quadrant A | 679,561 | 174,445 |
| Events in quadrant B | 721,336 | 178,390 |
| Events in quadrant C | 777,078 | 175,085 |
| Events in quadrant D | 1,440,853 | 161,972 |
| Mode SS | |||
|---|---|---|---|
| Quadrant | BADHDUFLAG | Total packets | Discarded packets |
| A | 0 | 28 | 0 |
| B | 0 | 28 | 0 |
| C | 0 | 28 | 0 |
| D | 0 | 28 | 0 |
| Mode M9 | |||
|---|---|---|---|
| Quadrant | BADHDUFLAG | Total packets | Discarded packets |
| A | 0 | 15 | 0 |
| B | 0 | 15 | 0 |
| C | 0 | 15 | 0 |
| D | 0 | 15 | 0 |
| Mode M0 | |||
|---|---|---|---|
| Quadrant | BADHDUFLAG | Total packets | Discarded packets |
| A | 0 | 2877 | 2 |
| B | 0 | 3037 | 1 |
| C | 0 | 3116 | 1 |
| D | 0 | 5285 | 1 |
| Quadrant | Total seconds | Saturated seconds | Saturation percentage |
|---|---|---|---|
| A | 1397 | 2 | 0.143164% |
| B | 1397 | 11 | 0.787402% |
| C | 1397 | 29 | 2.075877% |
| D | 1397 | 59 | 4.223336% |
Noise dominated data is calculated using 1-second bins in cleaned event files. If a bin has >2000 counts, and if more than 50% of those come from <1% of pixels, then it is considered to be noise-dominated and hence unusable.
| Quadrant | # 1 sec bins | Bins with >0 counts | Bins with >2000 counts | High rate bins dominated by noise | Noise dominated (total time) | Noise dominated (detector-on time) | Marked lightcurve |
|---|---|---|---|---|---|---|---|
| A | 2829 | 1398 | 1 | 1 | 0.04% | 0.07% | 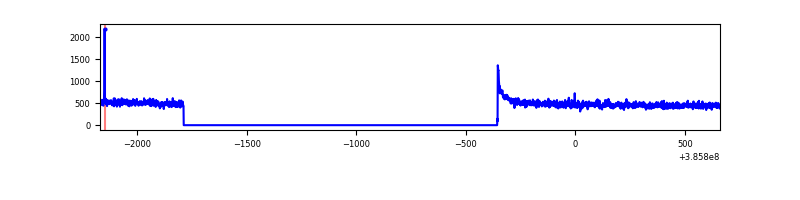 |
| B | 2829 | 1398 | 2 | 2 | 0.07% | 0.14% | 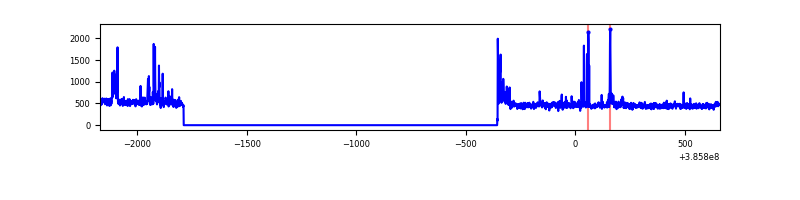 |
| C | 2829 | 1398 | 21 | 21 | 0.74% | 1.50% | 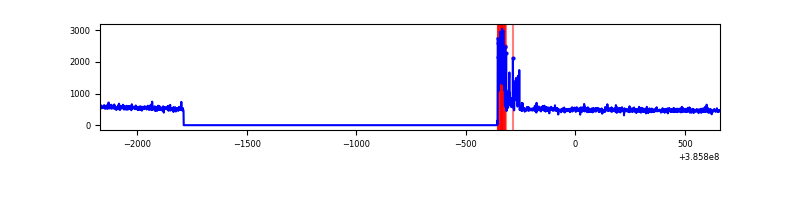 |
| D | 2829 | 1398 | 55 | 55 | 1.94% | 3.93% | 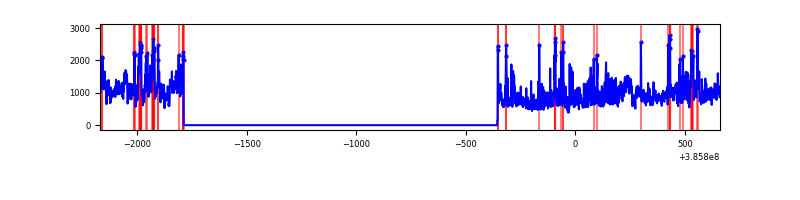 |
Top three noisy pixels from each quadrant. If the there are fewer than three noisy pixels in the level2.evt file, extra rows are filled as -1
| Pixel properties | Quadrant properties | ||||||
|---|---|---|---|---|---|---|---|
| Quadrant | DetID | PixID | Counts | Sigma | Mean | Median | Sigma |
| A | 10 | 83 | 33217 | 937.71 | 164 | 160 | 35.3 |
| A | 13 | 6 | 6202 | 171.39 | 164 | 160 | 35.3 |
| A | 15 | 174 | 2439 | 64.65 | 164 | 160 | 35.3 |
| B | 5 | 172 | 35916 | 1052.89 | 164 | 159 | 34.0 |
| B | 4 | 232 | 15651 | 456.17 | 164 | 159 | 34.0 |
| B | 15 | 85 | 15348 | 447.25 | 164 | 159 | 34.0 |
| C | 0 | 10 | 88804 | 2279.32 | 158 | 159 | 38.9 |
| C | 15 | 214 | 61815 | 1585.36 | 158 | 159 | 38.9 |
| C | 14 | 67 | 6451 | 161.79 | 158 | 159 | 38.9 |
| D | 8 | 195 | 486830 | 12130.23 | 156 | 151 | 40.1 |
| D | 2 | 153 | 99895 | 2486.07 | 156 | 151 | 40.1 |
| D | 2 | 31 | 62716 | 1559.4 | 156 | 151 | 40.1 |
Histogram calculated using DETX and DETY for each event in the final _common_clean file
| Quadrant A | 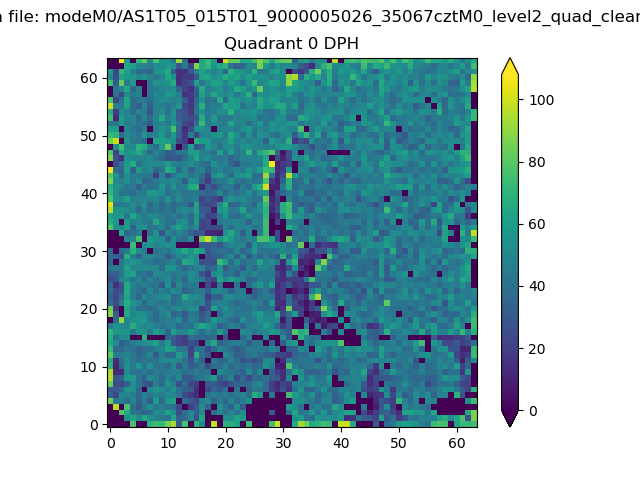 |
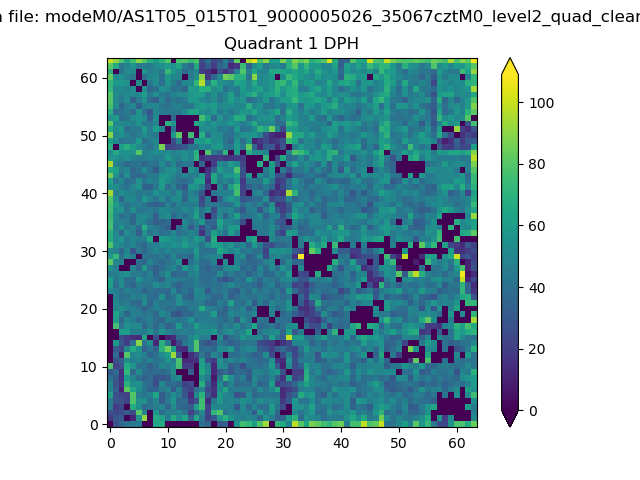 |
Quadrant B |
|---|---|---|---|
| Quadrant D | 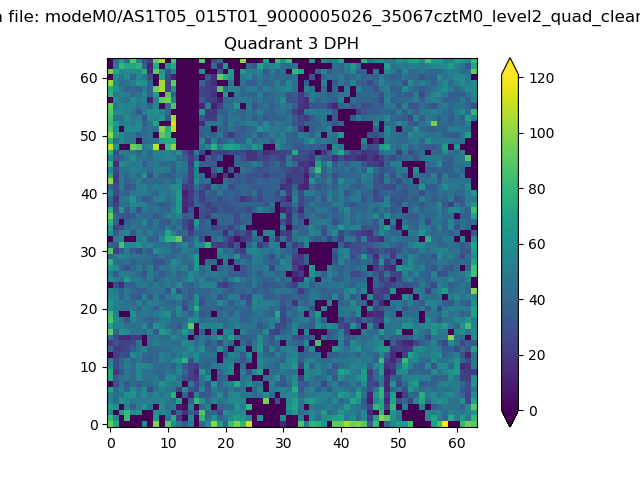 |
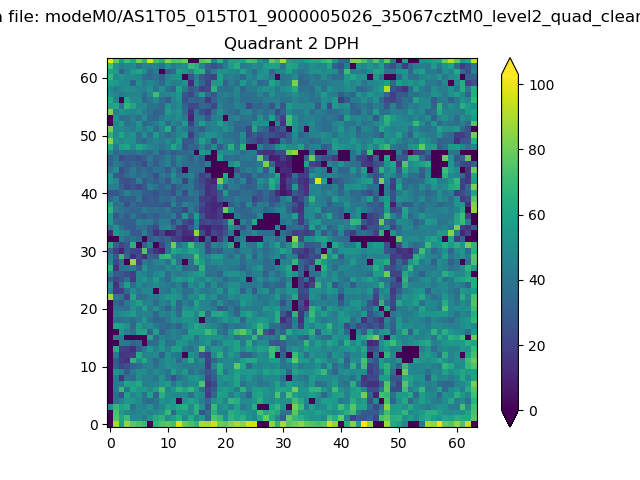 |
Quadrant C |
| Plot type | Count rate plots | Images |
|---|---|---|
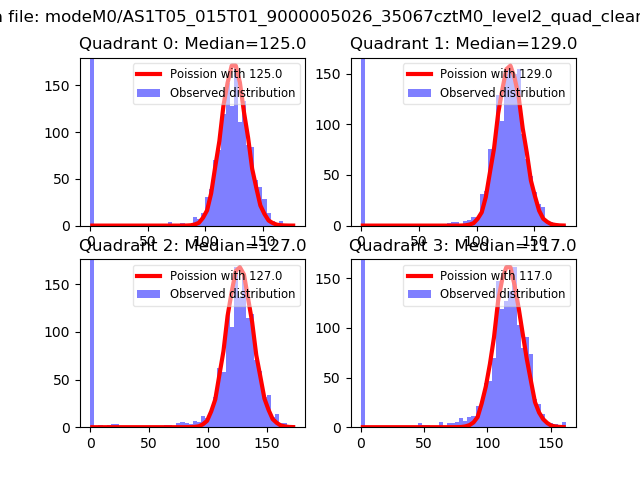
| Comparison with Poisson distribution Blue bars denote a histogram of data divided into 1 sec bins. Red curve is a Poisson curve with rate = median count rate of data. |
 |
 |
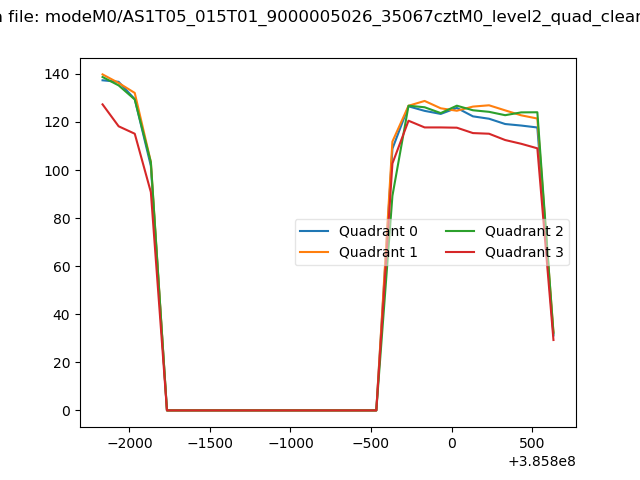
| Quadrant-wise count rates Data is divided into 100 sec bins |
 |
|
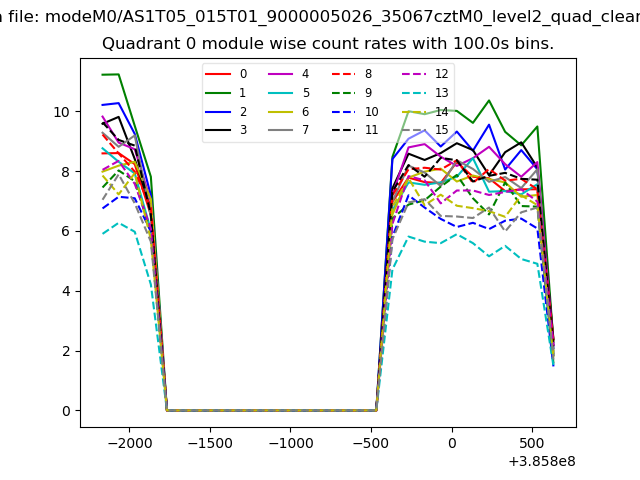
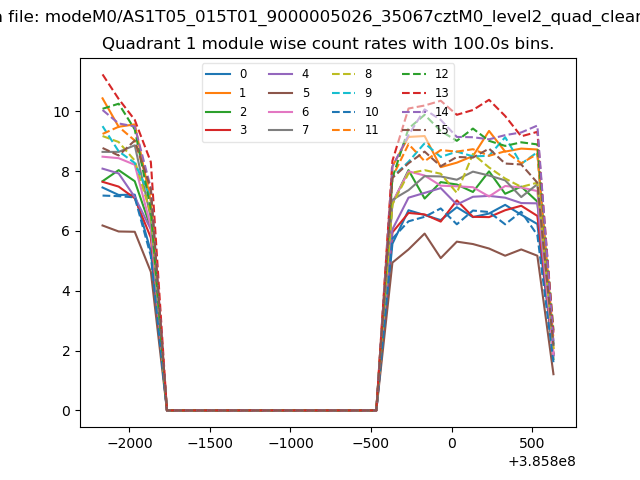
| Module-wise count rates for Quadrant A Data is divided into 100 sec bins |
 |
 |
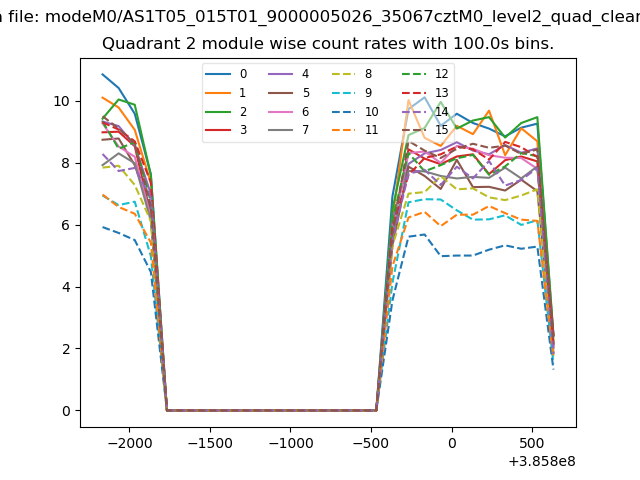
| Module-wise count rates for Quadrant B Data is divided into 100 sec bins |
 |
 |
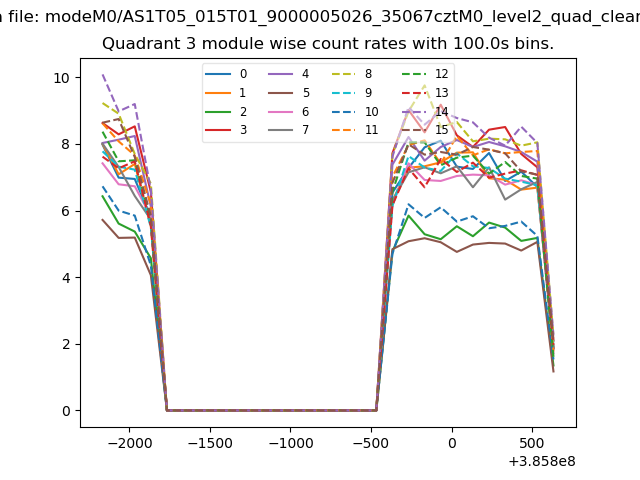
| Module-wise count rates for Quadrant C Data is divided into 100 sec bins |
 |
 |
| Module-wise count rates for Quadrant D Data is divided into 100 sec bins |
 |
 |
| Parameter | Plot |
|---|---|
| CZT HV Monitor | 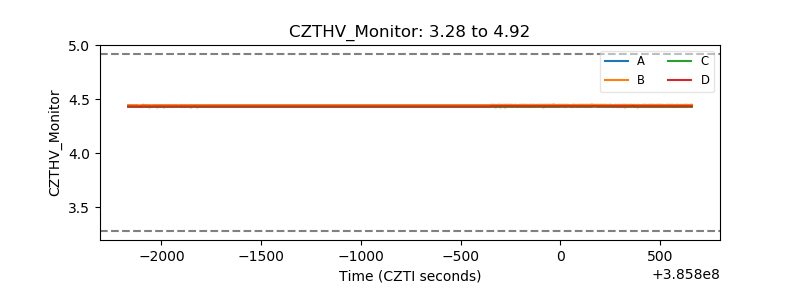 |
| D_VDD | 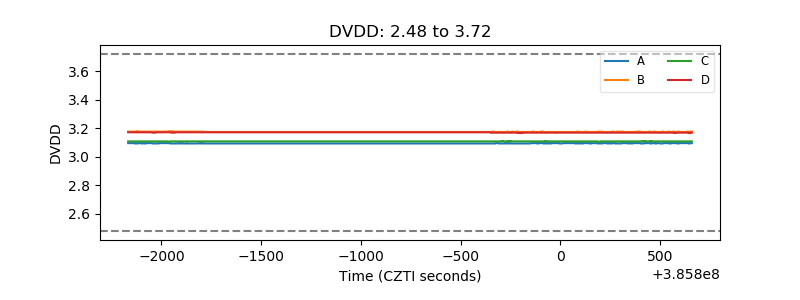 |
| Temperature 1 | 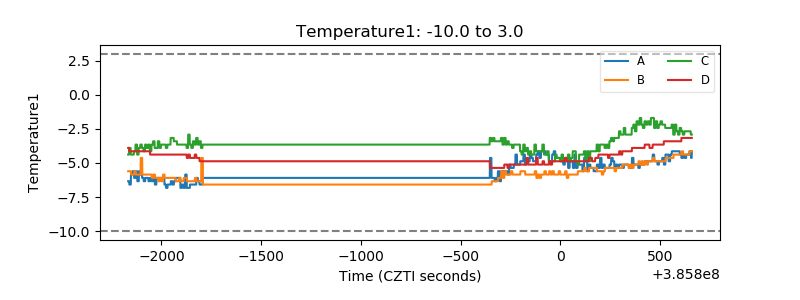 |
| Veto HV Monitor | 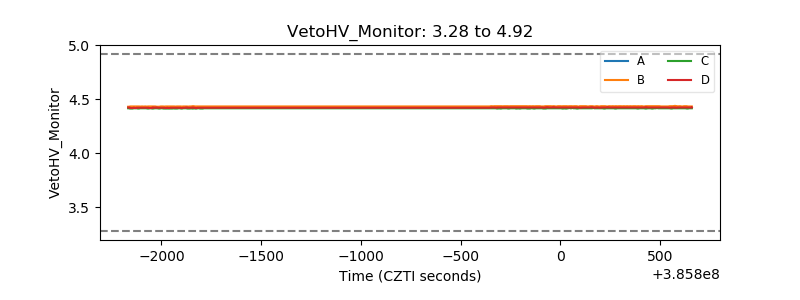 |
| Veto LLD | 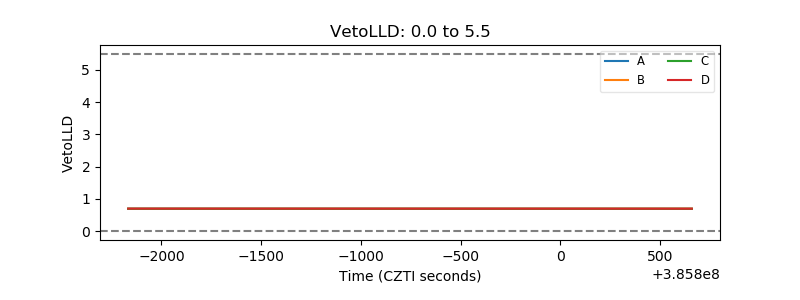 |
| Alpha Counter | 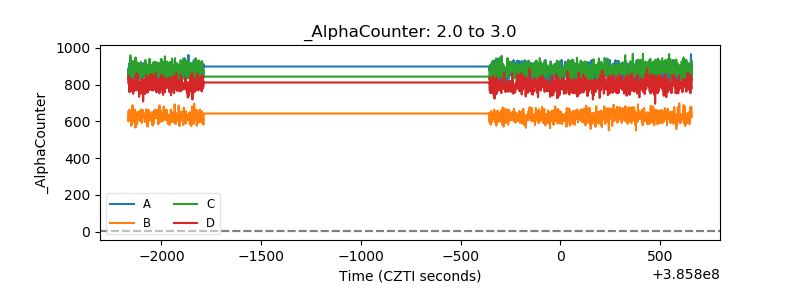 |
| _CPM_Rate | 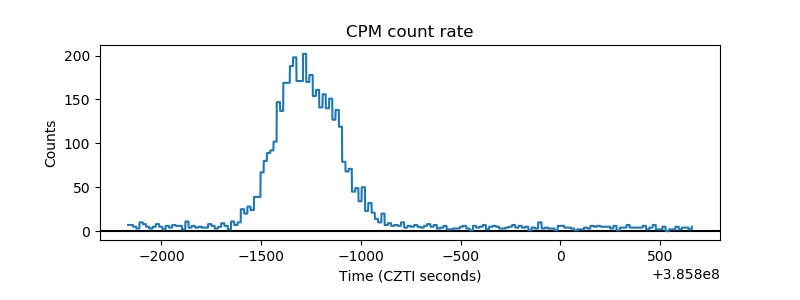 |
| CZT Counter | 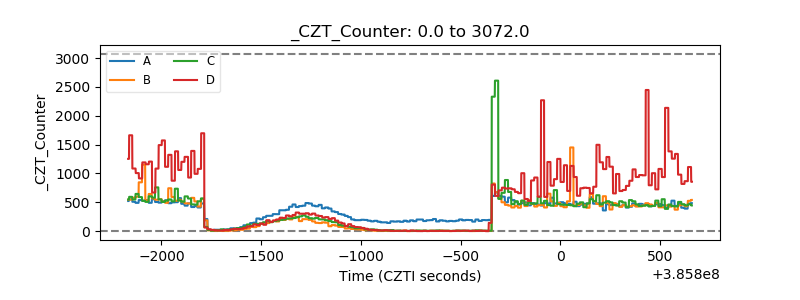 |
| +2.5 Volts monitor |  |
| +5 Volts monitor | 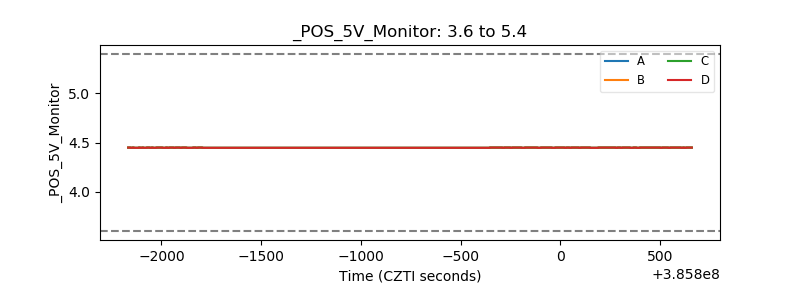 |
| _ROLL_ROT | 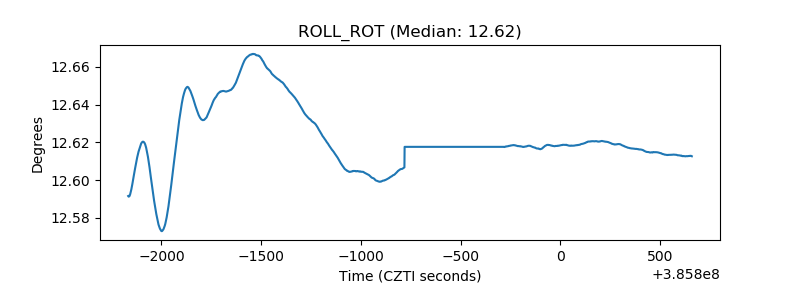 |
| _Roll_DEC | 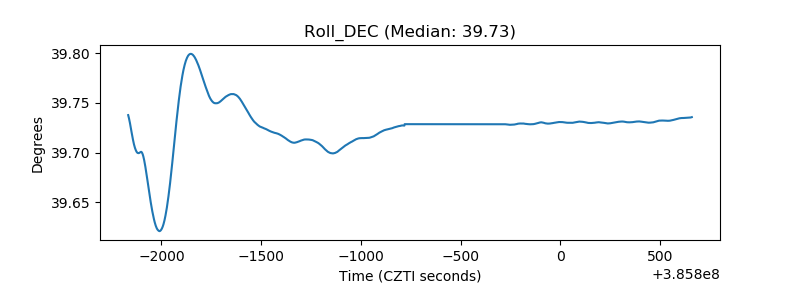 |
| _Roll_RA | 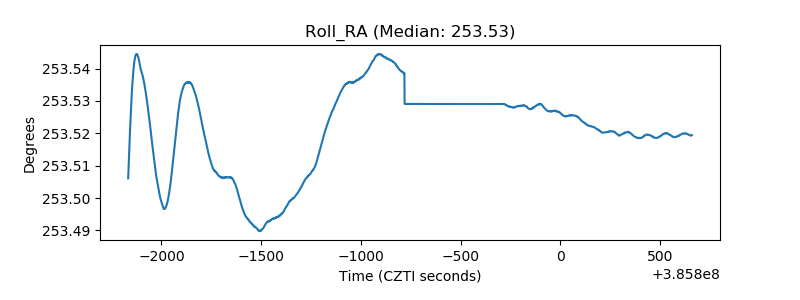 |
| Veto Counter | 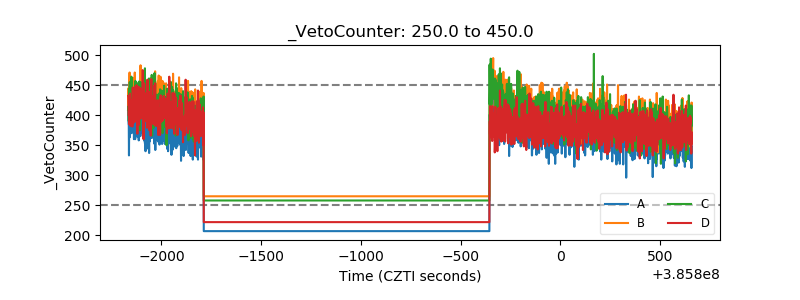 |