| Param | Original file | Final file |
|---|---|---|
| Filename | modeM0/AS1T05_015T01_9000005026cztM0_level2_bc.evt | modeM0/AS1T05_015T01_9000005026cztM0_level2_quad_clean.evt |
| Size (bytes) | 8,647,709,760 | 1,892,808,000 |
| Size | 8.1 GB | 1.8 GB |
| Events in quadrant A | 46,670,620 | 11,910,649 |
| Events in quadrant B | 48,178,112 | 12,229,665 |
| Events in quadrant C | 43,752,604 | 12,153,149 |
| Events in quadrant D | 113,486,583 | 11,120,064 |
| Mode SS | |||
|---|---|---|---|
| Quadrant | BADHDUFLAG | Total packets | Discarded packets |
| A | 0 | 2958 | 0 |
| B | 0 | 2958 | 0 |
| C | 0 | 2958 | 0 |
| D | 0 | 2958 | 0 |
| Mode M9 | |||
|---|---|---|---|
| Quadrant | BADHDUFLAG | Total packets | Discarded packets |
| A | 0 | 600 | 0 |
| B | 0 | 600 | 0 |
| C | 0 | 600 | 0 |
| D | 0 | 603 | 0 |
| Mode M0 | |||
|---|---|---|---|
| Quadrant | BADHDUFLAG | Total packets | Discarded packets |
| A | 0 | 358776 | 0 |
| B | 0 | 365561 | 0 |
| C | 0 | 329400 | 0 |
| D | 0 | 572416 | 0 |
| Quadrant | Total seconds | Saturated seconds | Saturation percentage |
|---|---|---|---|
| A | 144756 | 6149 | 4.247838% |
| B | 144756 | 5555 | 3.837492% |
| C | 144756 | 2114 | 1.460389% |
| D | 144755 | 12405 | 8.569652% |
Noise dominated data is calculated using 1-second bins in cleaned event files. If a bin has >2000 counts, and if more than 50% of those come from <1% of pixels, then it is considered to be noise-dominated and hence unusable.
| Quadrant | # 1 sec bins | Bins with >0 counts | Bins with >2000 counts | High rate bins dominated by noise | Noise dominated (total time) | Noise dominated (detector-on time) | Marked lightcurve |
|---|---|---|---|---|---|---|---|
| A | 303444 | 144757 | 329 | 329 | 0.11% | 0.23% | 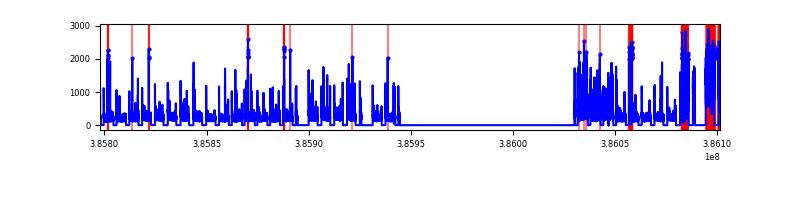 |
| B | 303444 | 144759 | 453 | 453 | 0.15% | 0.31% | 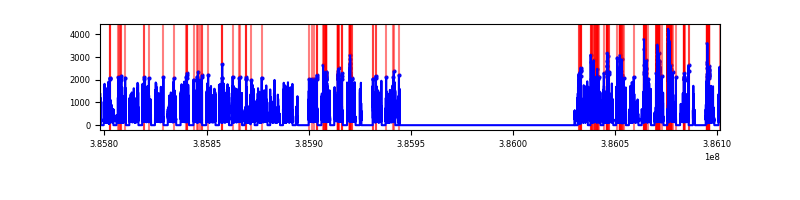 |
| C | 303444 | 144758 | 805 | 805 | 0.27% | 0.56% | 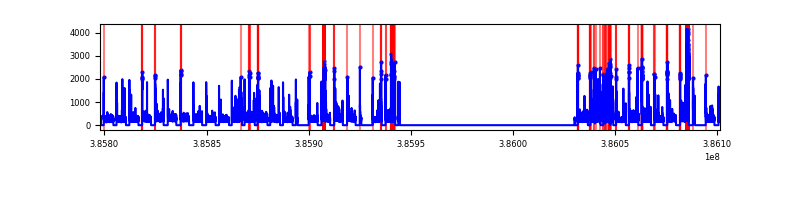 |
| D | 303444 | 144757 | 1675 | 1675 | 0.55% | 1.16% | 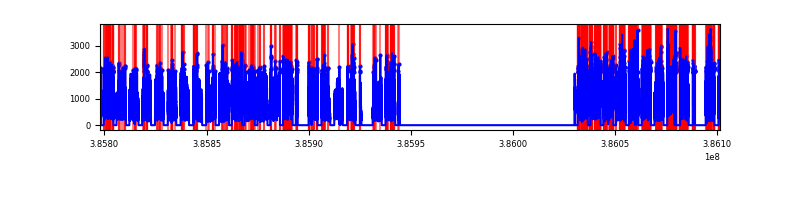 |
Top three noisy pixels from each quadrant. If the there are fewer than three noisy pixels in the level2.evt file, extra rows are filled as -1
| Pixel properties | Quadrant properties | ||||||
|---|---|---|---|---|---|---|---|
| Quadrant | DetID | PixID | Counts | Sigma | Mean | Median | Sigma |
| A | 15 | 169 | 14093098 | 8373.38 | 7734 | 7636 | 1682.2 |
| A | 10 | 83 | 1607679 | 951.18 | 7734 | 7636 | 1682.2 |
| A | 13 | 6 | 294182 | 170.34 | 7734 | 7636 | 1682.2 |
| B | 5 | 172 | 11311307 | 7470.12 | 7826 | 7679 | 1513.2 |
| B | 0 | 190 | 2204676 | 1451.91 | 7826 | 7679 | 1513.2 |
| B | 0 | 189 | 1641406 | 1079.67 | 7826 | 7679 | 1513.2 |
| C | 15 | 214 | 5687642 | 3273.82 | 7711 | 7688 | 1735.0 |
| C | 0 | 10 | 3217290 | 1849.96 | 7711 | 7688 | 1735.0 |
| C | 14 | 128 | 1636290 | 938.7 | 7711 | 7688 | 1735.0 |
| D | 8 | 195 | 63432761 | 35638.85 | 7539 | 7322 | 1779.7 |
| D | 2 | 250 | 5612533 | 3149.58 | 7539 | 7322 | 1779.7 |
| D | 13 | 249 | 3582286 | 2008.78 | 7539 | 7322 | 1779.7 |
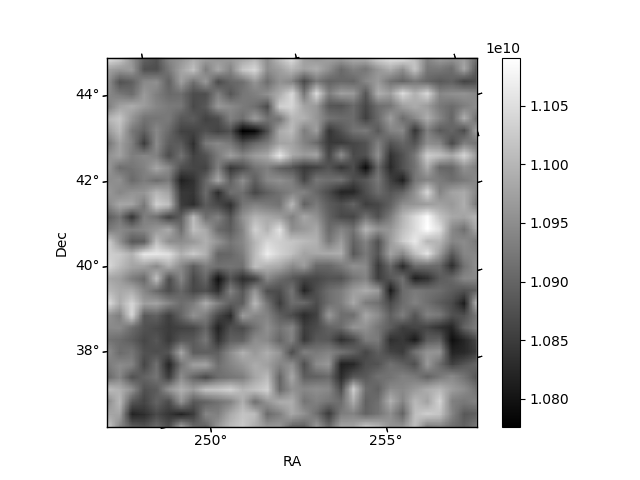
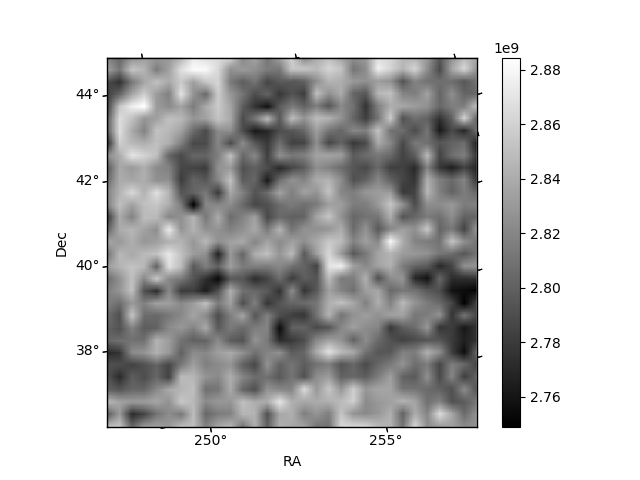
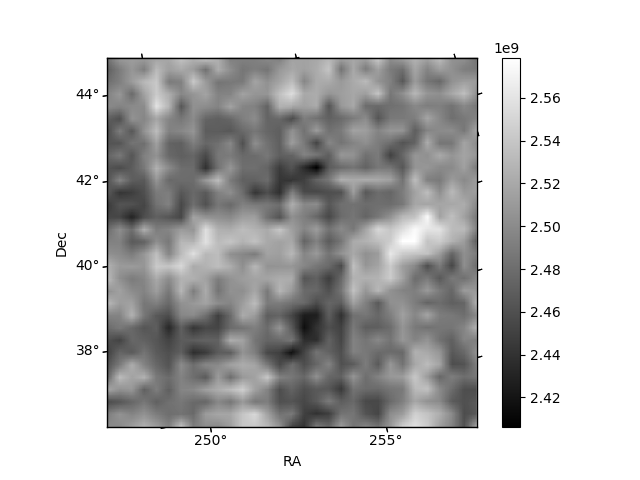
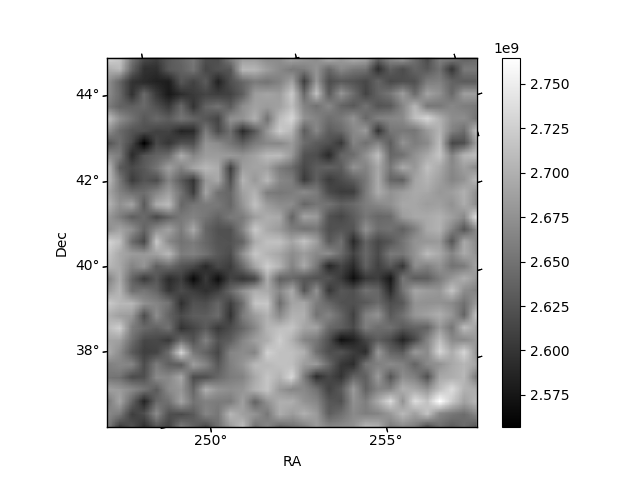
Histogram calculated using DETX and DETY for each event in the final _common_clean file
| Quadrant A | 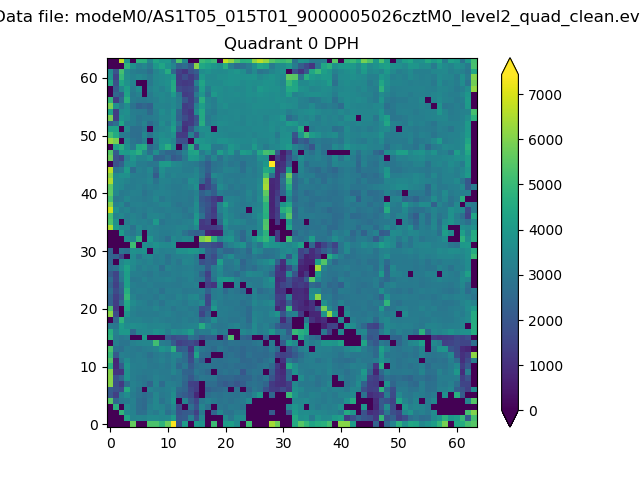 |
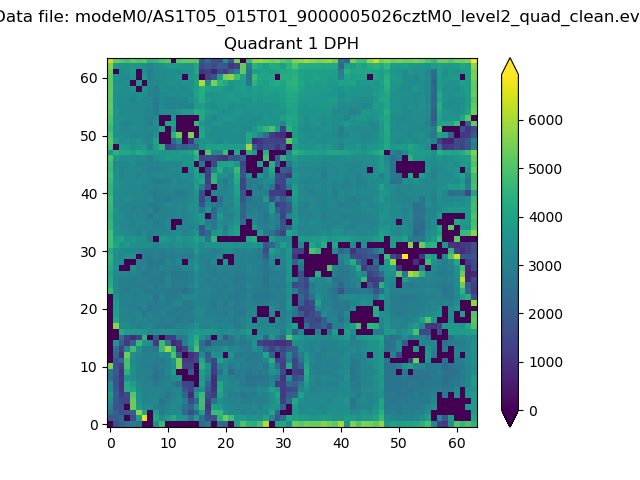 |
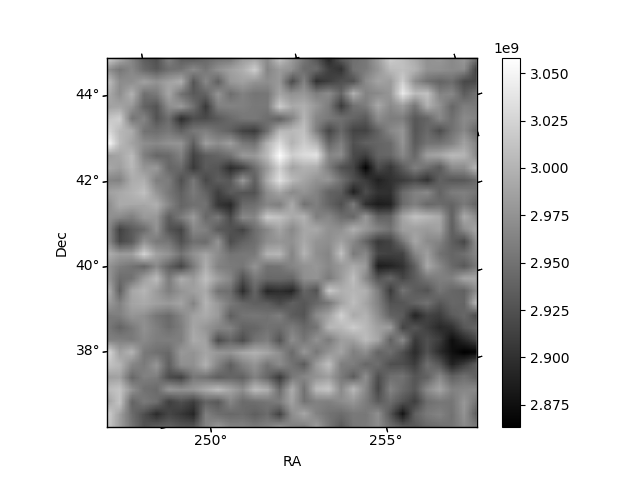
Quadrant B |
|---|---|---|---|
| Quadrant D | 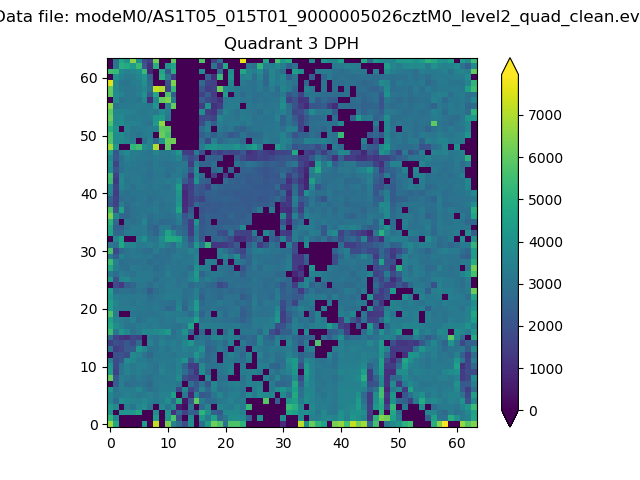 |
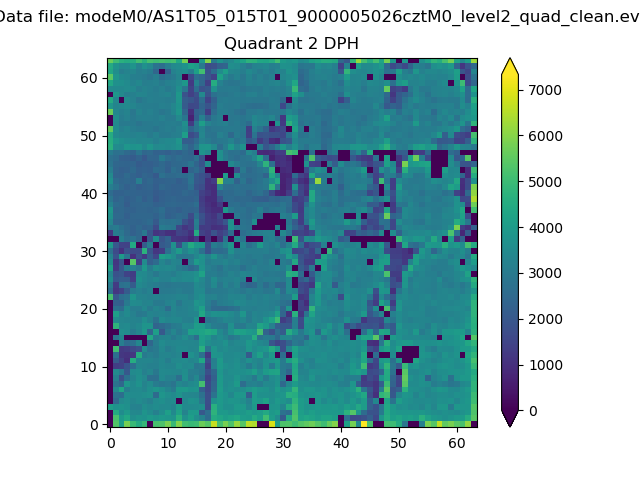 |
Quadrant C |
| Plot type | Count rate plots | Images |
|---|---|---|
| Comparison with Poisson distribution Blue bars denote a histogram of data divided into 1 sec bins. Red curve is a Poisson curve with rate = median count rate of data. |
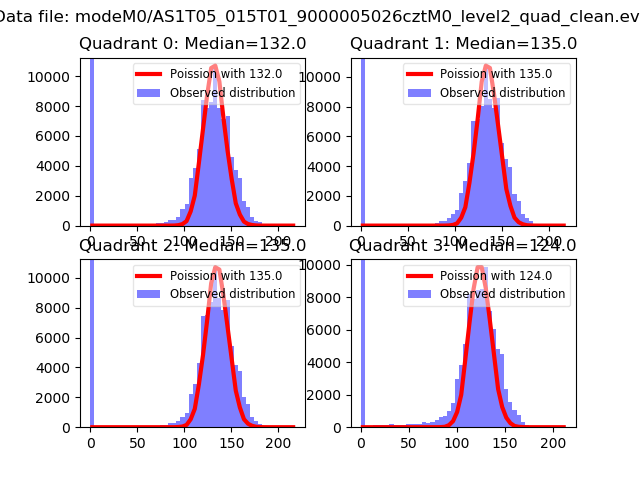 |
 |
| Quadrant-wise count rates Data is divided into 100 sec bins |
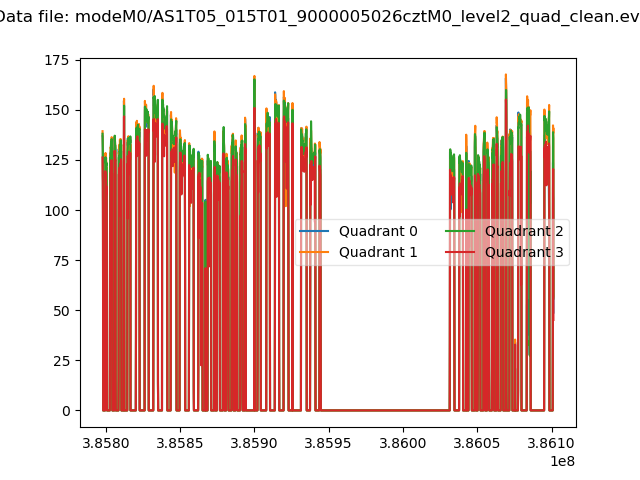 |
|
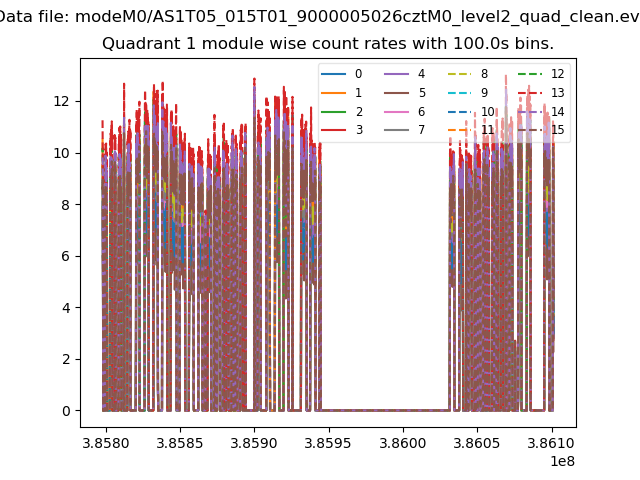
| Module-wise count rates for Quadrant A Data is divided into 100 sec bins |
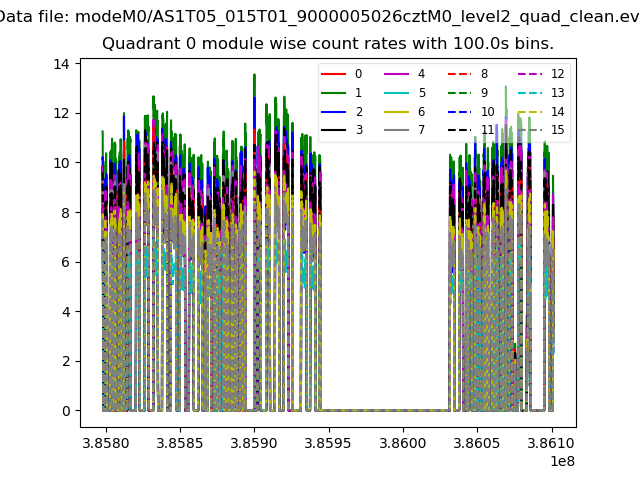 |
 |
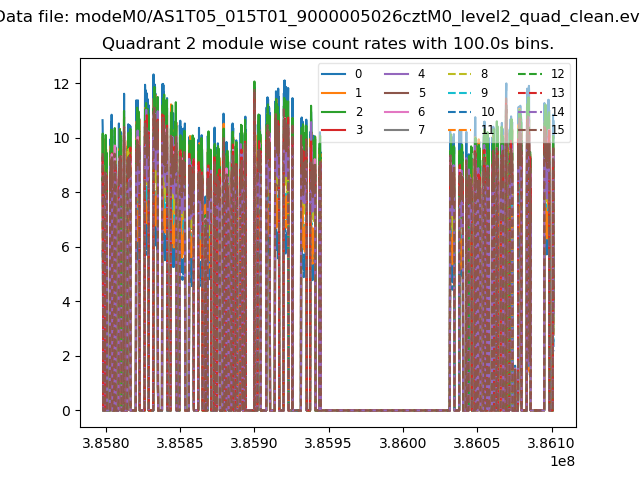
| Module-wise count rates for Quadrant B Data is divided into 100 sec bins |
 |
 |
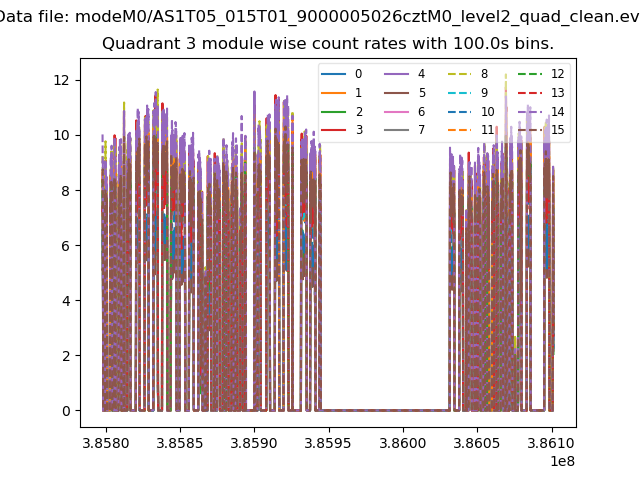
| Module-wise count rates for Quadrant C Data is divided into 100 sec bins |
 |
 |
| Module-wise count rates for Quadrant D Data is divided into 100 sec bins |
 |
 |
| Parameter | Plot |
|---|---|
| CZT HV Monitor | 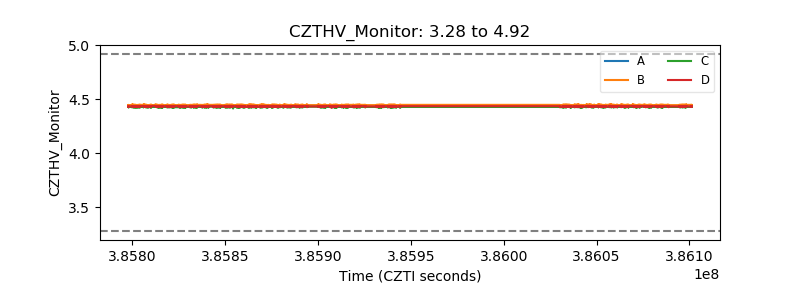 |
| D_VDD | 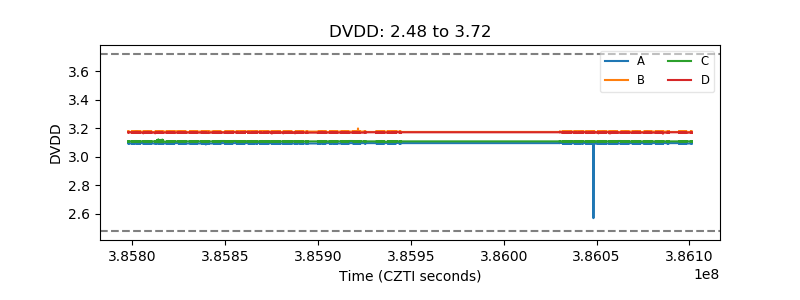 |
| Temperature 1 | 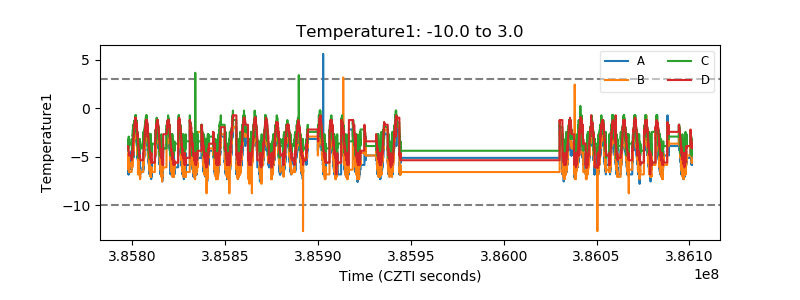 |
| Veto HV Monitor | 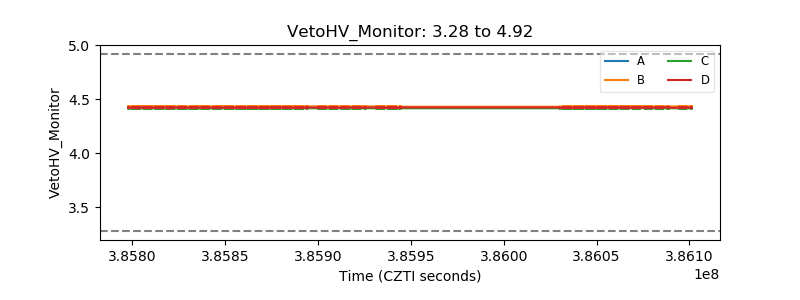 |
| Veto LLD | 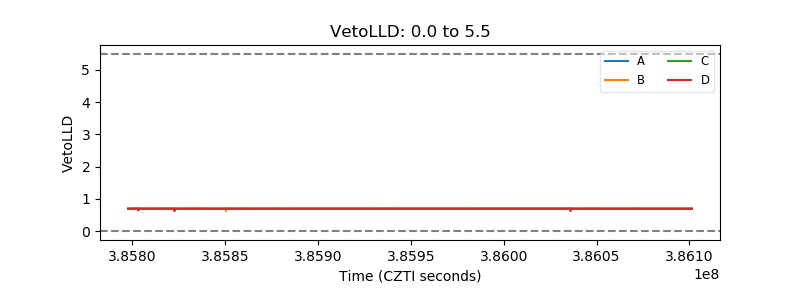 |
| Alpha Counter | 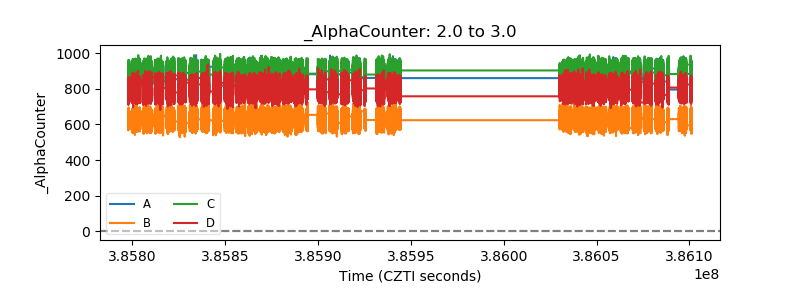 |
| _CPM_Rate | 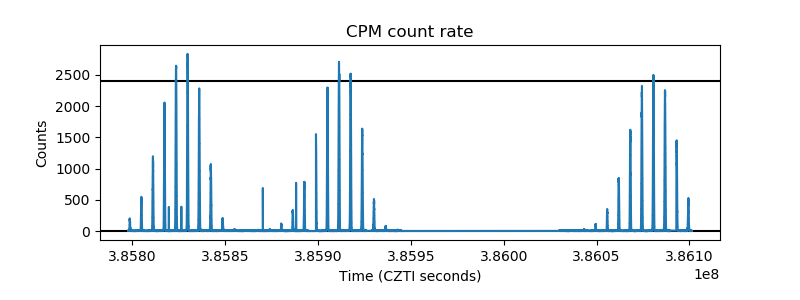 |
| CZT Counter | 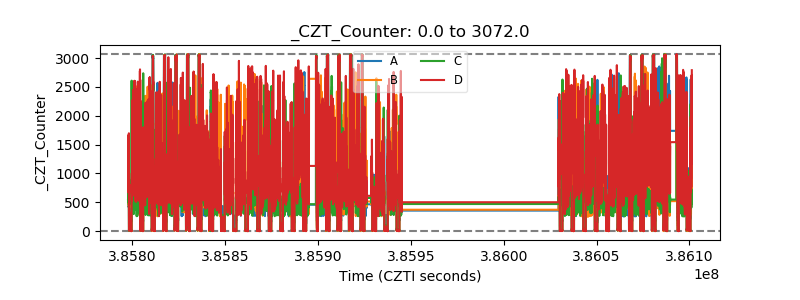 |
| +2.5 Volts monitor | 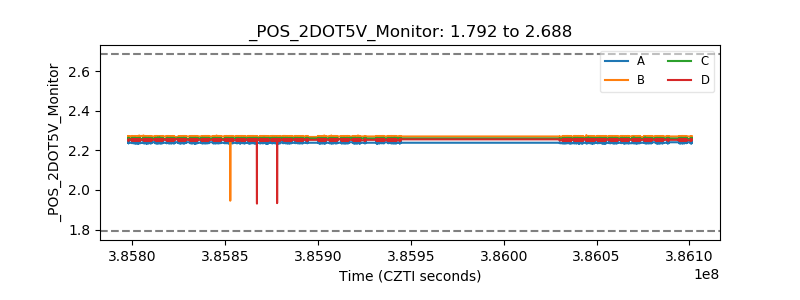 |
| +5 Volts monitor | 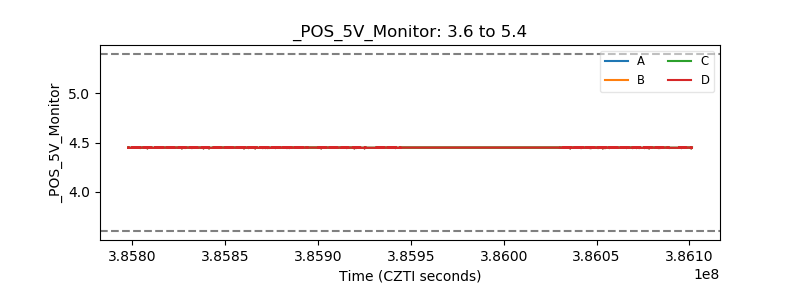 |
| _ROLL_ROT | 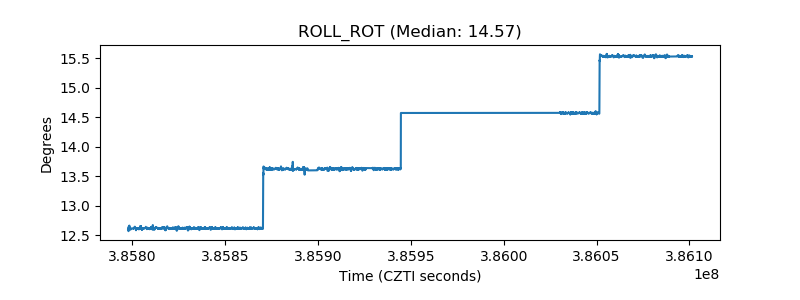 |
| _Roll_DEC | 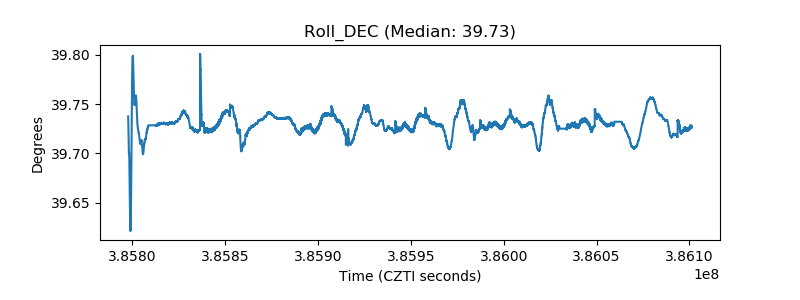 |
| _Roll_RA | 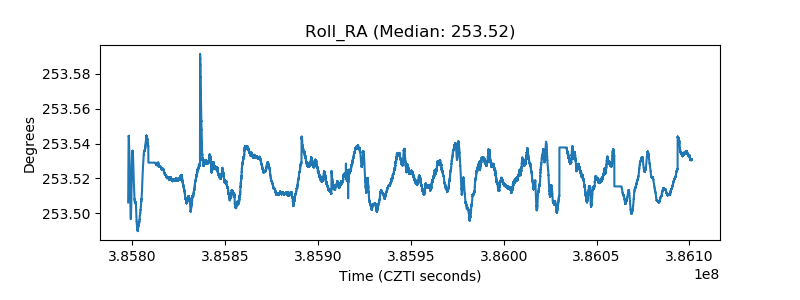 |
| Veto Counter | 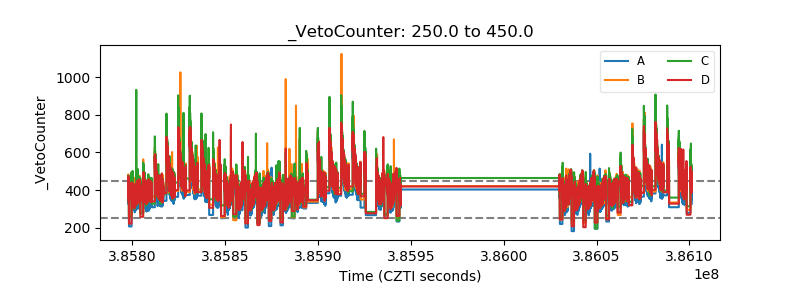 |