| Param | Original file | Final file |
|---|---|---|
| Filename | modeM0/AS1A11_046T08_9000005024_35065cztM0_level2.evt | modeM0/AS1A11_046T08_9000005024_35065cztM0_level2_quad_clean.evt |
| Size (bytes) | 589,420,800 | 116,331,840 |
| Size | 562.1 MB | 110.9 MB |
| Events in quadrant A | 3,601,740 | 759,404 |
| Events in quadrant B | 3,907,029 | 781,836 |
| Events in quadrant C | 3,230,454 | 806,128 |
| Events in quadrant D | 6,679,656 | 730,496 |
| Mode M9 | |||
|---|---|---|---|
| Quadrant | BADHDUFLAG | Total packets | Discarded packets |
| A | 0 | 27 | 0 |
| B | 0 | 27 | 0 |
| C | 0 | 27 | 0 |
| D | 0 | 27 | 0 |
| Mode M0 | |||
|---|---|---|---|
| Quadrant | BADHDUFLAG | Total packets | Discarded packets |
| A | 0 | 15150 | 3 |
| B | 0 | 16101 | 2 |
| C | 0 | 13664 | 2 |
| D | 0 | 24401 | 2 |
| Mode SS | |||
|---|---|---|---|
| Quadrant | BADHDUFLAG | Total packets | Discarded packets |
| A | 0 | 130 | 0 |
| B | 0 | 130 | 0 |
| C | 0 | 130 | 0 |
| D | 0 | 130 | 0 |
| Quadrant | Total seconds | Saturated seconds | Saturation percentage |
|---|---|---|---|
| A | 6385 | 293 | 4.588880% |
| B | 6385 | 397 | 6.217698% |
| C | 6385 | 29 | 0.454190% |
| D | 6385 | 393 | 6.155051% |
Noise dominated data is calculated using 1-second bins in cleaned event files. If a bin has >2000 counts, and if more than 50% of those come from <1% of pixels, then it is considered to be noise-dominated and hence unusable.
| Quadrant | # 1 sec bins | Bins with >0 counts | Bins with >2000 counts | High rate bins dominated by noise | Noise dominated (total time) | Noise dominated (detector-on time) | Marked lightcurve |
|---|---|---|---|---|---|---|---|
| A | 9040 | 6387 | 207 | 207 | 2.29% | 3.24% | 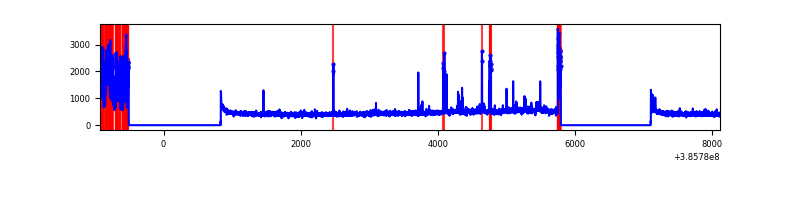 |
| B | 9040 | 6387 | 218 | 218 | 2.41% | 3.41% | 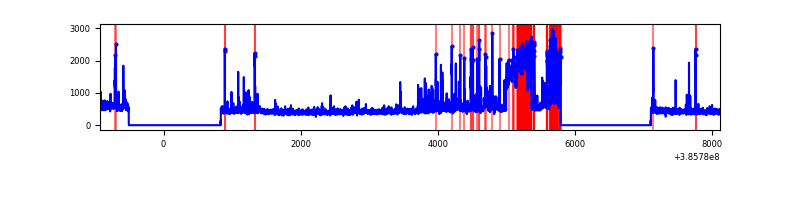 |
| C | 9040 | 6387 | 22 | 22 | 0.24% | 0.34% | 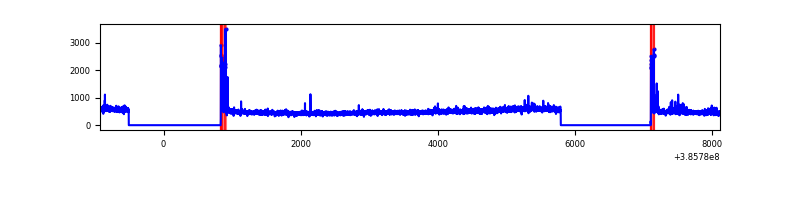 |
| D | 9040 | 6387 | 298 | 298 | 3.30% | 4.67% | 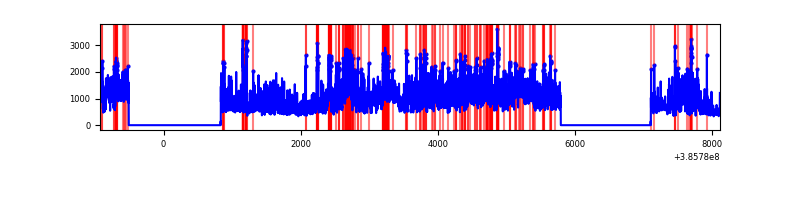 |
Top three noisy pixels from each quadrant. If the there are fewer than three noisy pixels in the level2.evt file, extra rows are filled as -1
| Pixel properties | Quadrant properties | ||||||
|---|---|---|---|---|---|---|---|
| Quadrant | DetID | PixID | Counts | Sigma | Mean | Median | Sigma |
| A | 15 | 237 | 547313 | 3823.93 | 707 | 692 | 142.9 |
| A | 15 | 174 | 146508 | 1020.07 | 707 | 692 | 142.9 |
| A | 10 | 83 | 83586 | 579.89 | 707 | 692 | 142.9 |
| B | 5 | 172 | 493739 | 3643.16 | 712 | 692 | 135.3 |
| B | 0 | 182 | 485446 | 3581.88 | 712 | 692 | 135.3 |
| B | 4 | 232 | 41875 | 304.3 | 712 | 692 | 135.3 |
| C | 15 | 214 | 271880 | 1647.15 | 714 | 720 | 164.6 |
| C | 0 | 10 | 143173 | 865.33 | 714 | 720 | 164.6 |
| C | 3 | 233 | 11974 | 68.36 | 714 | 720 | 164.6 |
| D | 8 | 195 | 2530494 | 15142.48 | 695 | 675 | 167.1 |
| D | 2 | 250 | 619786 | 3705.75 | 695 | 675 | 167.1 |
| D | 5 | 223 | 209273 | 1248.58 | 695 | 675 | 167.1 |
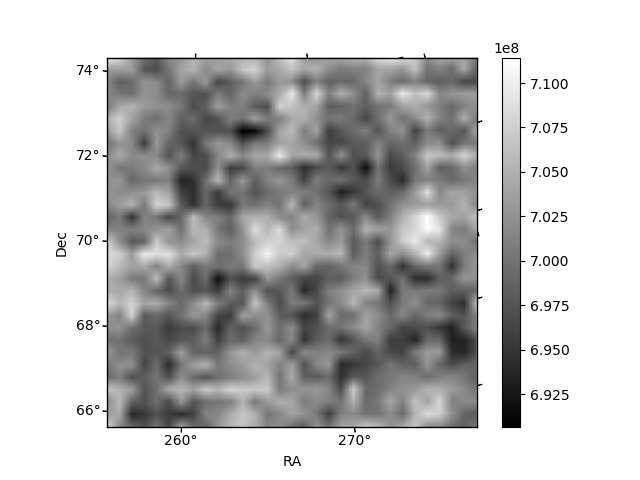
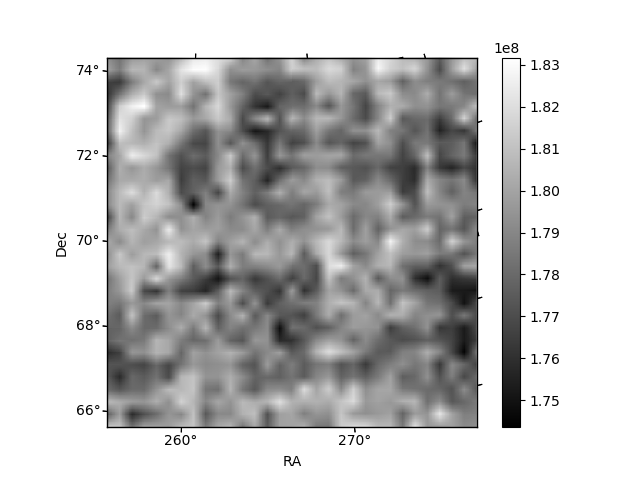
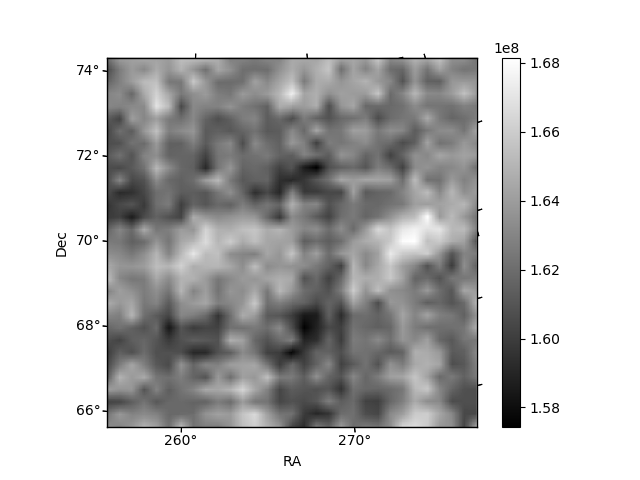
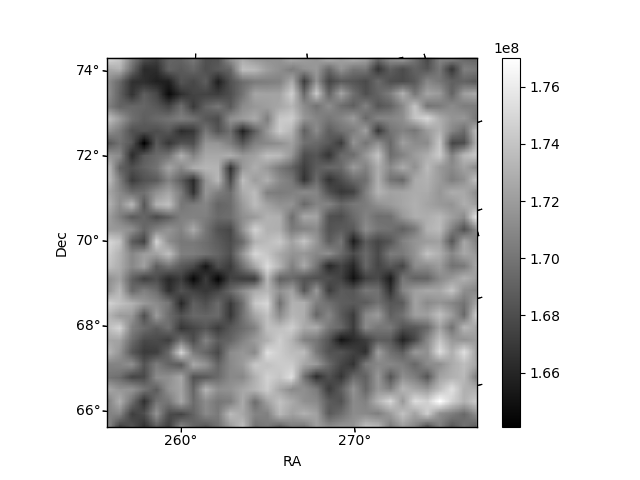
Histogram calculated using DETX and DETY for each event in the final _common_clean file
| Quadrant A | 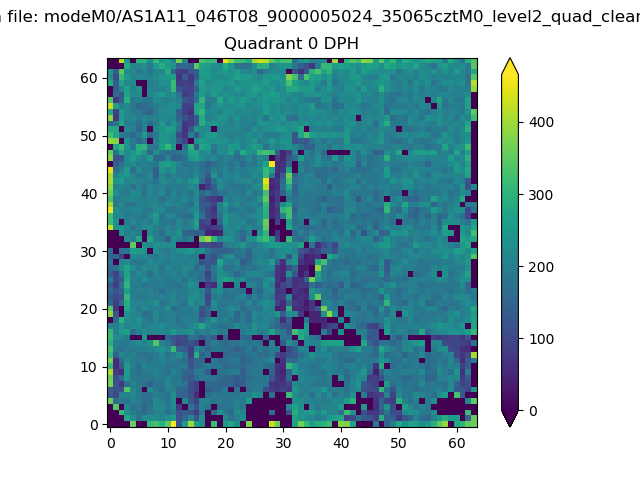 |
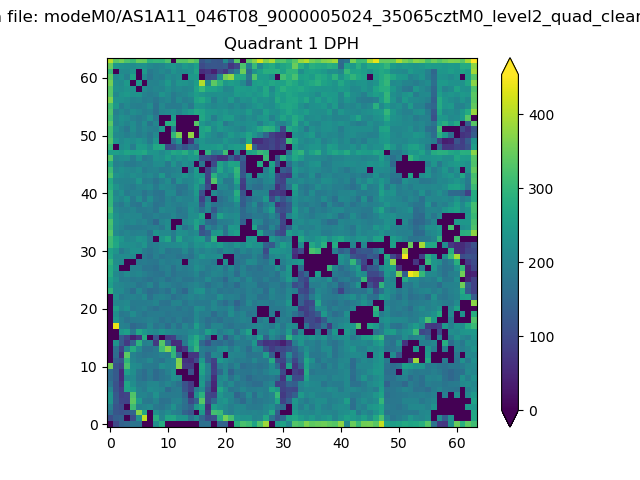 |
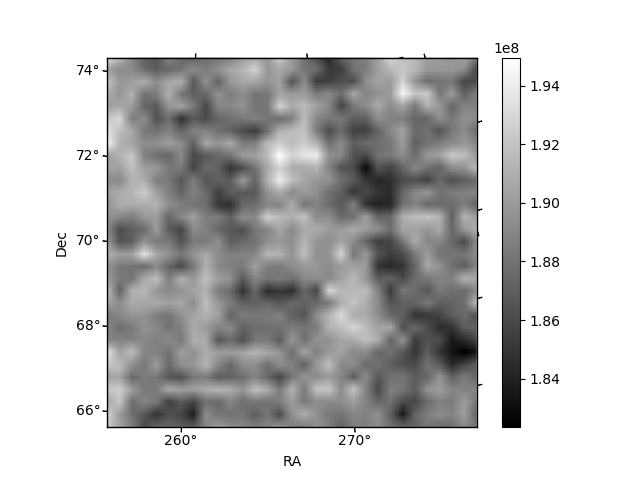
Quadrant B |
|---|---|---|---|
| Quadrant D | 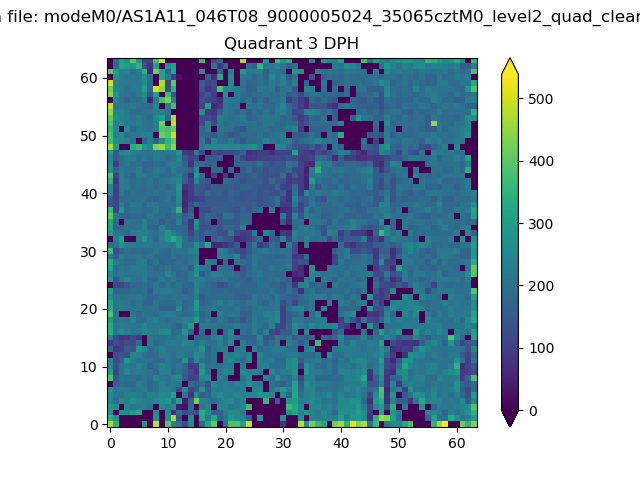 |
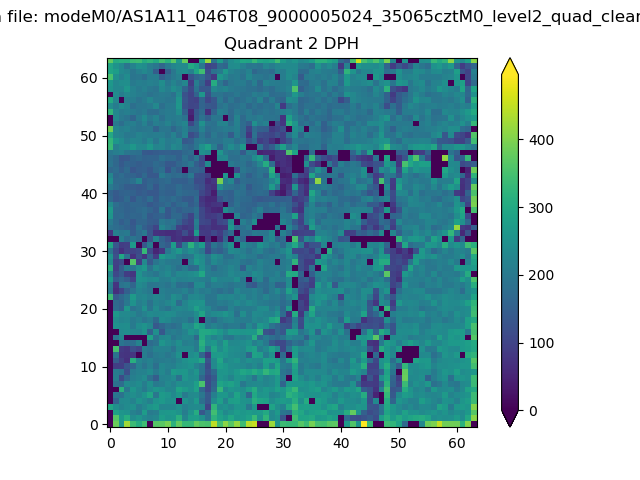 |
Quadrant C |
| Plot type | Count rate plots | Images |
|---|---|---|
| Comparison with Poisson distribution Blue bars denote a histogram of data divided into 1 sec bins. Red curve is a Poisson curve with rate = median count rate of data. |
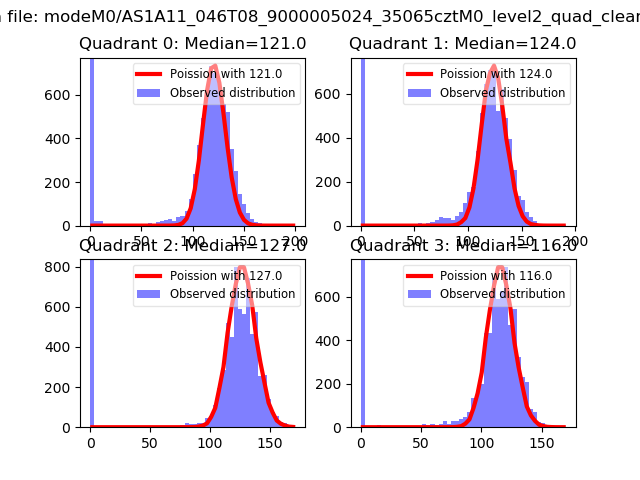 |
 |
| Quadrant-wise count rates Data is divided into 100 sec bins |
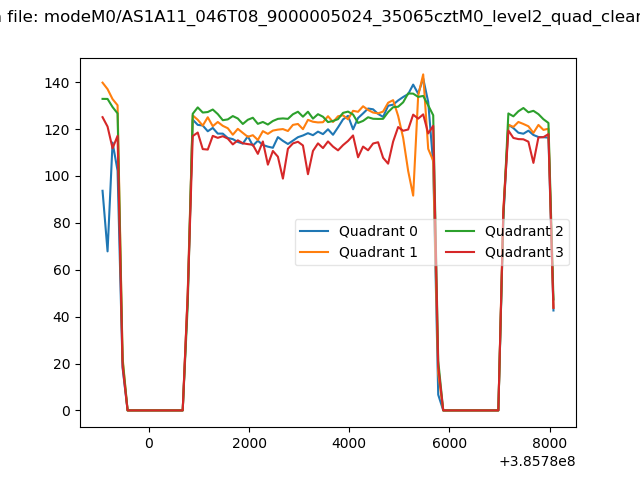 |
|
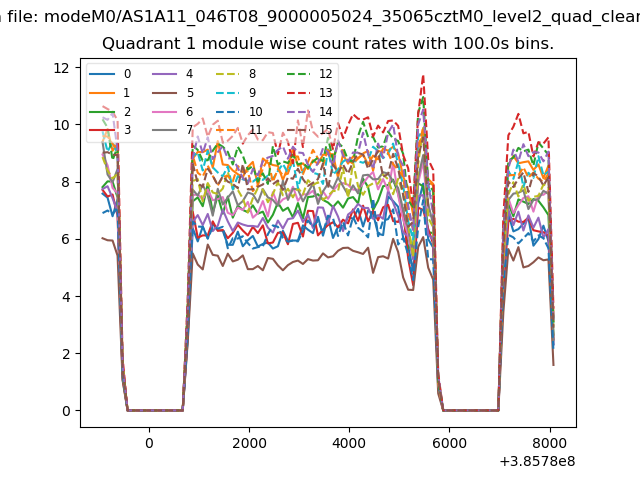
| Module-wise count rates for Quadrant A Data is divided into 100 sec bins |
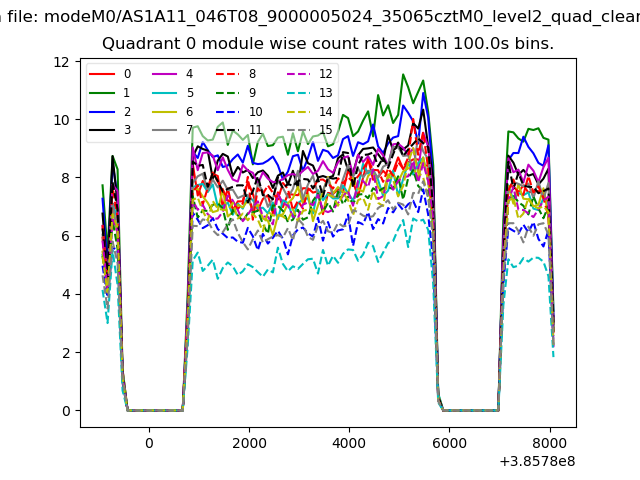 |
 |
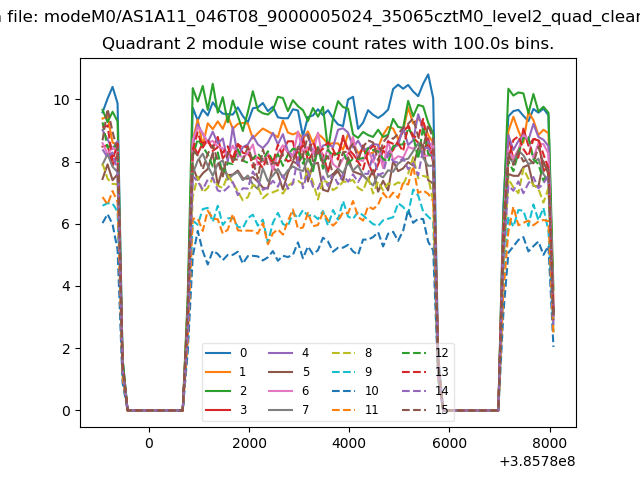
| Module-wise count rates for Quadrant B Data is divided into 100 sec bins |
 |
 |
| Module-wise count rates for Quadrant C Data is divided into 100 sec bins |
 |
 |
| Module-wise count rates for Quadrant D Data is divided into 100 sec bins |
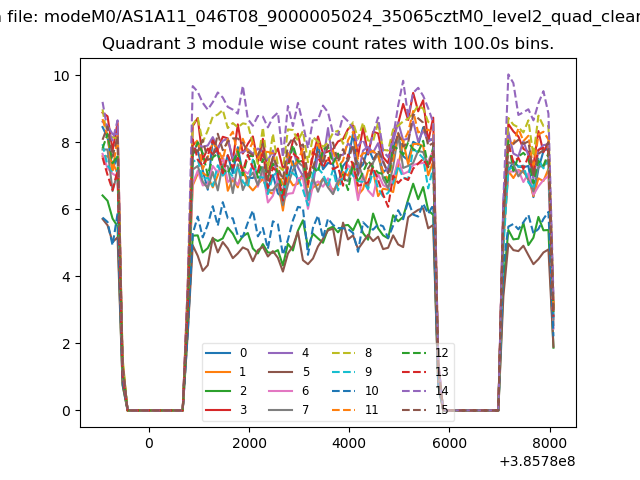 |
 |
| Parameter | Plot |
|---|---|
| CZT HV Monitor | 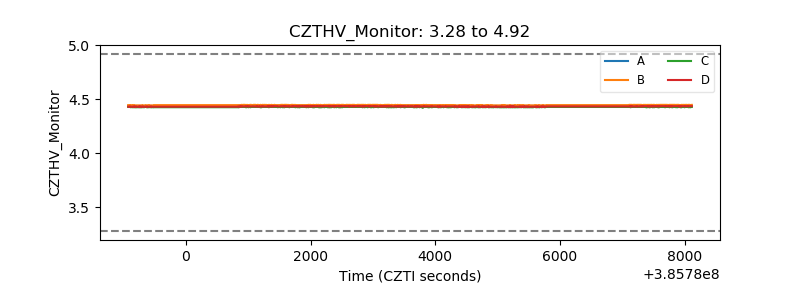 |
| D_VDD | 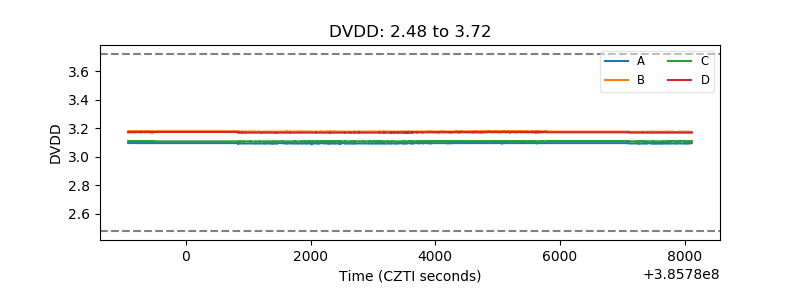 |
| Temperature 1 |  |
| Veto HV Monitor | 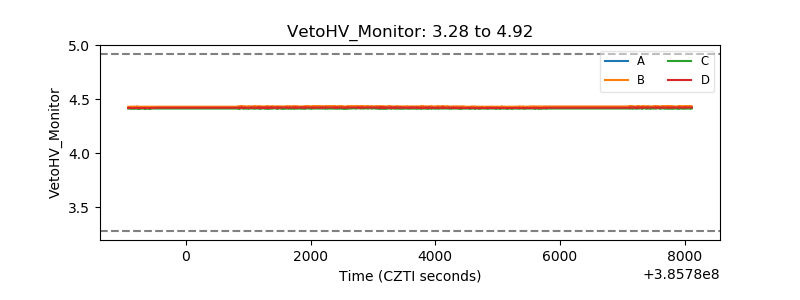 |
| Veto LLD | 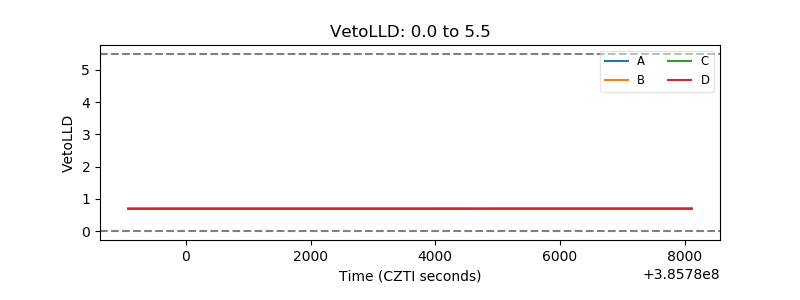 |
| Alpha Counter | 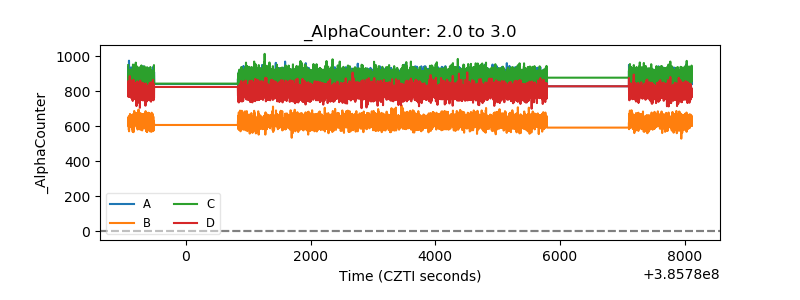 |
| _CPM_Rate | 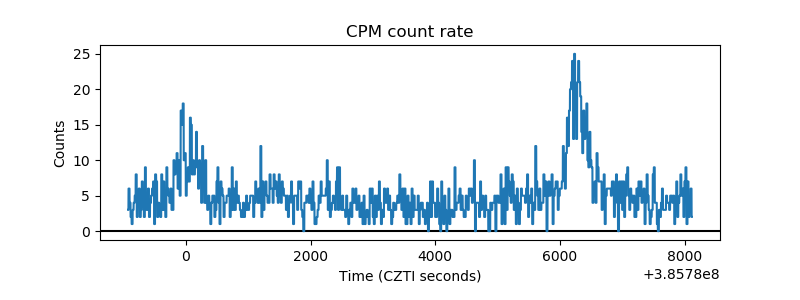 |
| CZT Counter | 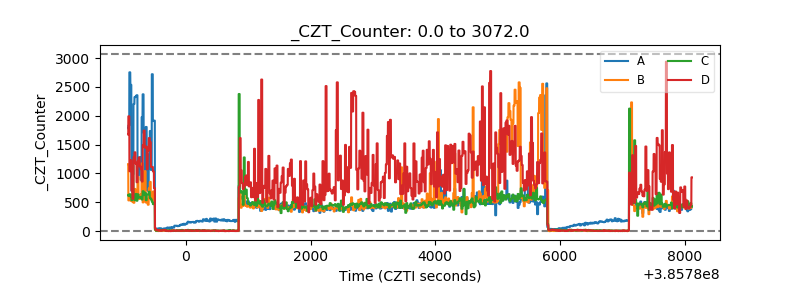 |
| +2.5 Volts monitor | 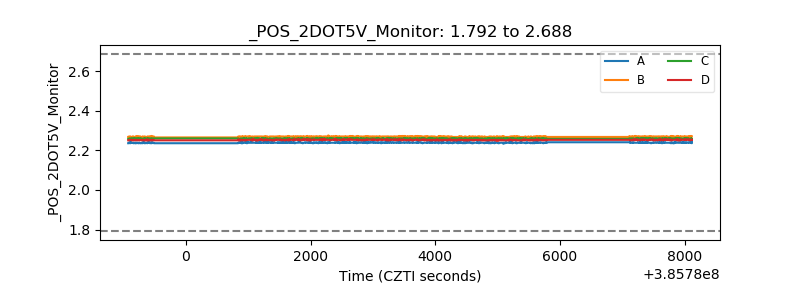 |
| +5 Volts monitor | 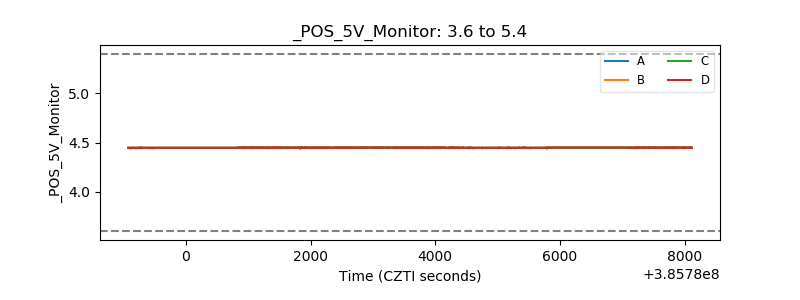 |
| _ROLL_ROT | 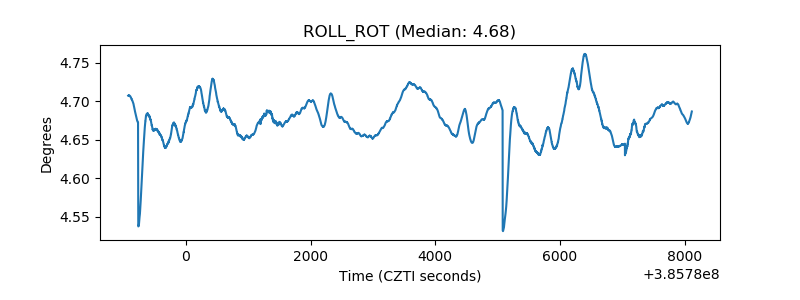 |
| _Roll_DEC | 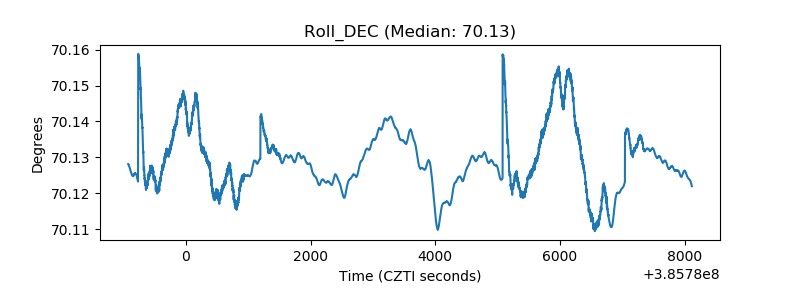 |
| _Roll_RA | 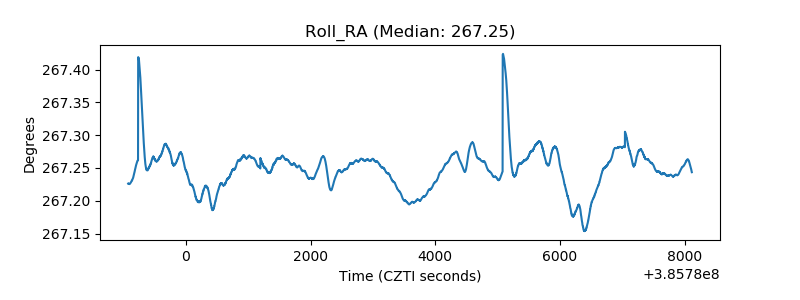 |
| Veto Counter | 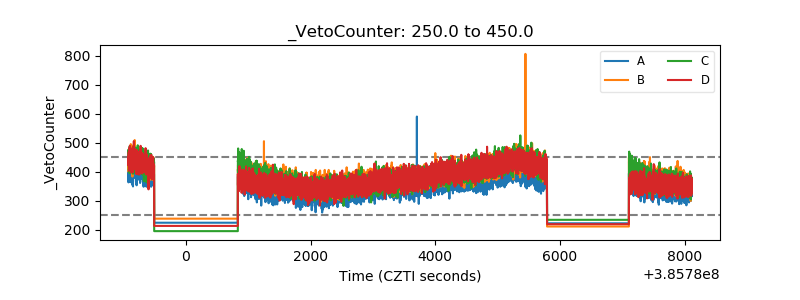 |