| Param | Original file | Final file |
|---|---|---|
| Filename | modeM0/AS1A11_046T08_9000005024cztM0_level2_bc.evt | modeM0/AS1A11_046T08_9000005024cztM0_level2_quad_clean.evt |
| Size (bytes) | 1,305,898,560 | 475,629,120 |
| Size | 1.2 GB | 453.6 MB |
| Events in quadrant A | 5,959,042 | 3,156,503 |
| Events in quadrant B | 7,492,359 | 3,202,448 |
| Events in quadrant C | 6,481,592 | 3,293,875 |
| Events in quadrant D | 17,848,474 | 2,969,954 |
| Mode M9 | |||
|---|---|---|---|
| Quadrant | BADHDUFLAG | Total packets | Discarded packets |
| A | 0 | 75 | 0 |
| B | 0 | 75 | 0 |
| C | 0 | 75 | 0 |
| D | 0 | 75 | 0 |
| Mode M0 | |||
|---|---|---|---|
| Quadrant | BADHDUFLAG | Total packets | Discarded packets |
| A | 0 | 55669 | 0 |
| B | 0 | 62061 | 0 |
| C | 0 | 54021 | 0 |
| D | 0 | 93791 | 0 |
| Mode SS | |||
|---|---|---|---|
| Quadrant | BADHDUFLAG | Total packets | Discarded packets |
| A | 0 | 528 | 0 |
| B | 0 | 528 | 0 |
| C | 0 | 528 | 0 |
| D | 0 | 528 | 0 |
| Quadrant | Total seconds | Saturated seconds | Saturation percentage |
|---|---|---|---|
| A | 25943 | 421 | 1.622788% |
| B | 25943 | 1024 | 3.947115% |
| C | 25943 | 98 | 0.377751% |
| D | 25943 | 1690 | 6.514281% |
Noise dominated data is calculated using 1-second bins in cleaned event files. If a bin has >2000 counts, and if more than 50% of those come from <1% of pixels, then it is considered to be noise-dominated and hence unusable.
| Quadrant | # 1 sec bins | Bins with >0 counts | Bins with >2000 counts | High rate bins dominated by noise | Noise dominated (total time) | Noise dominated (detector-on time) | Marked lightcurve |
|---|---|---|---|---|---|---|---|
| A | 33376 | 25947 | 31 | 31 | 0.09% | 0.12% | 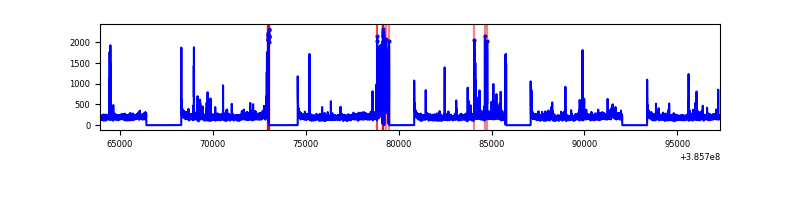 |
| B | 33376 | 25942 | 37 | 37 | 0.11% | 0.14% | 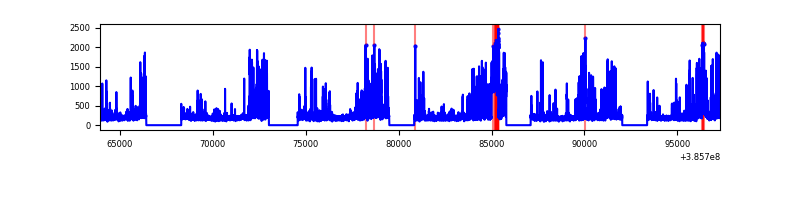 |
| C | 33377 | 25943 | 2 | 2 | 0.01% | 0.01% |  |
| D | 33376 | 25942 | 126 | 126 | 0.38% | 0.49% | 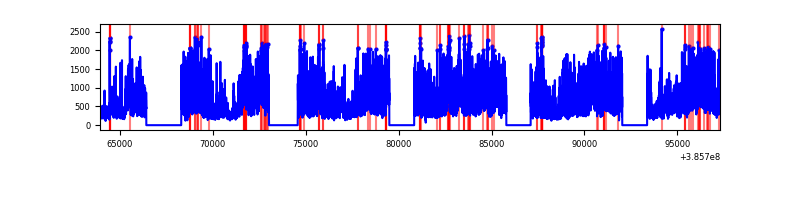 |
Top three noisy pixels from each quadrant. If the there are fewer than three noisy pixels in the level2.evt file, extra rows are filled as -1
| Pixel properties | Quadrant properties | ||||||
|---|---|---|---|---|---|---|---|
| Quadrant | DetID | PixID | Counts | Sigma | Mean | Median | Sigma |
| A | 15 | 237 | 513805 | 1821.68 | 1266 | 1247 | 281.4 |
| A | 10 | 83 | 250168 | 884.69 | 1266 | 1247 | 281.4 |
| A | 9 | 143 | 140260 | 494.06 | 1266 | 1247 | 281.4 |
| B | 5 | 172 | 1553449 | 6078.15 | 1275 | 1246 | 255.4 |
| B | 0 | 182 | 468669 | 1830.35 | 1275 | 1246 | 255.4 |
| B | 0 | 190 | 157281 | 611.01 | 1275 | 1246 | 255.4 |
| C | 15 | 214 | 1023247 | 3387.46 | 1289 | 1282 | 301.7 |
| C | 0 | 10 | 280396 | 925.17 | 1289 | 1282 | 301.7 |
| C | 14 | 67 | 60210 | 195.33 | 1289 | 1282 | 301.7 |
| D | 8 | 195 | 8620384 | 28318.57 | 1247 | 1205 | 304.4 |
| D | 1 | 47 | 996499 | 3270.07 | 1247 | 1205 | 304.4 |
| D | 2 | 250 | 985628 | 3234.35 | 1247 | 1205 | 304.4 |
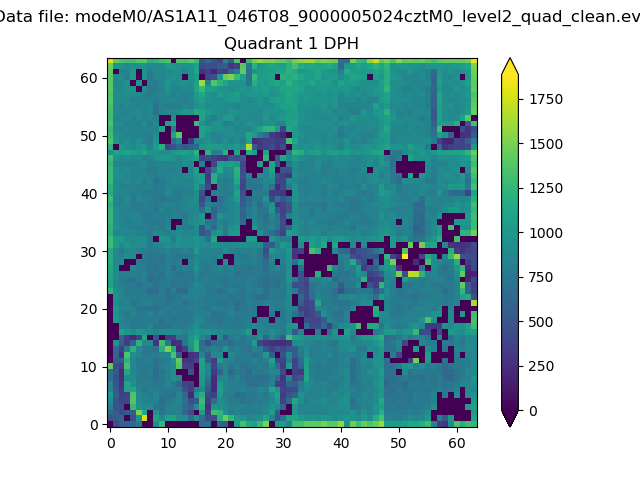
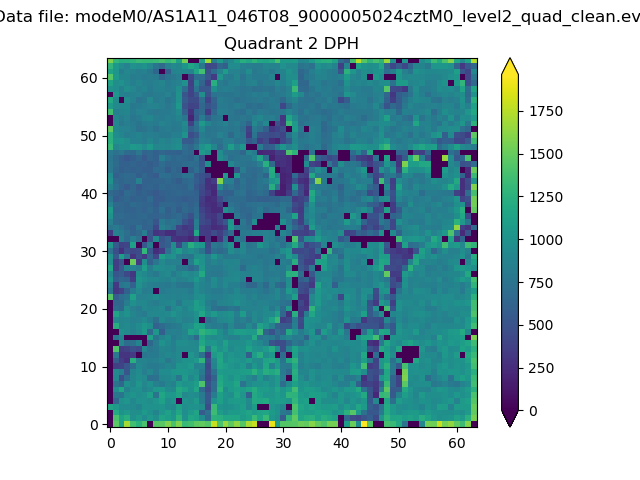
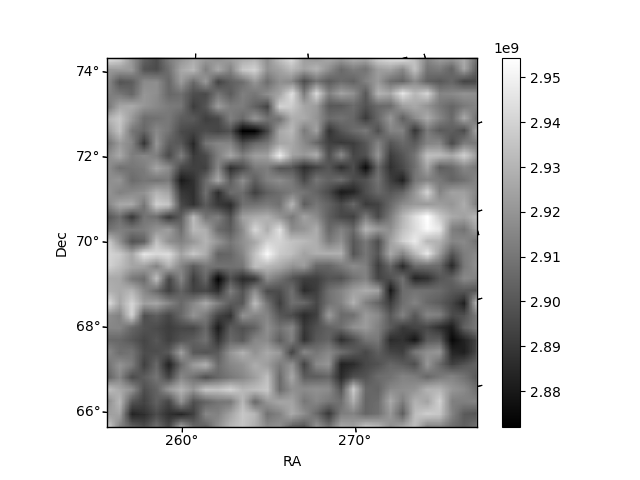
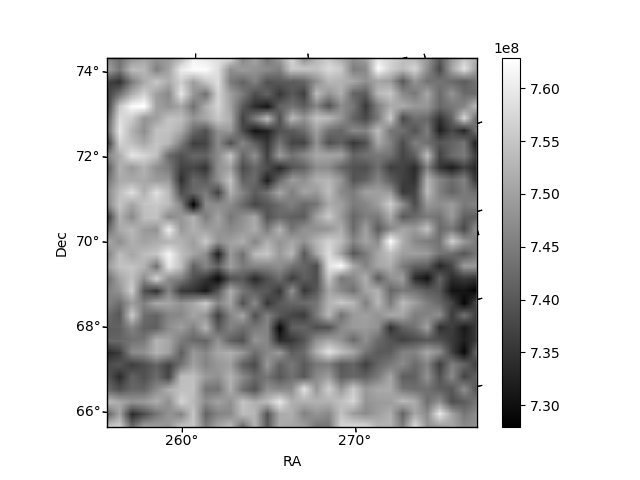
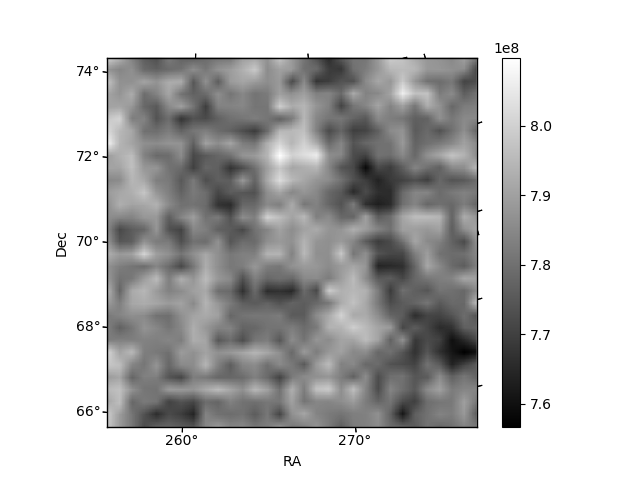
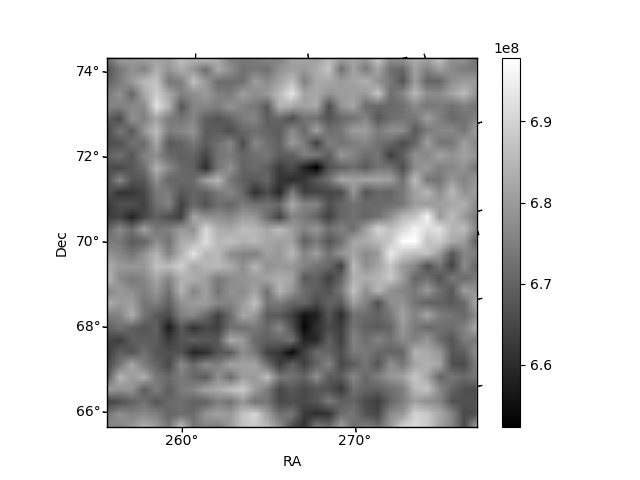
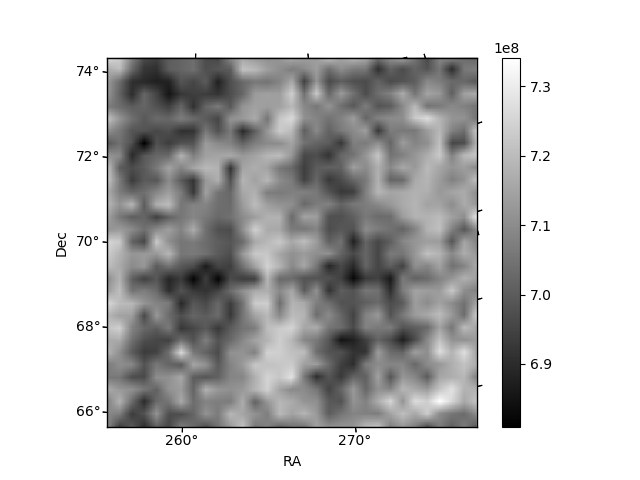
Histogram calculated using DETX and DETY for each event in the final _common_clean file
| Quadrant A | 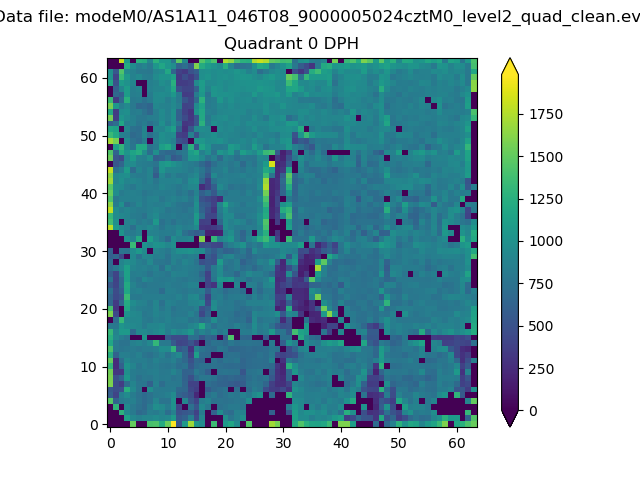 |
 |
Quadrant B |
|---|---|---|---|
| Quadrant D | 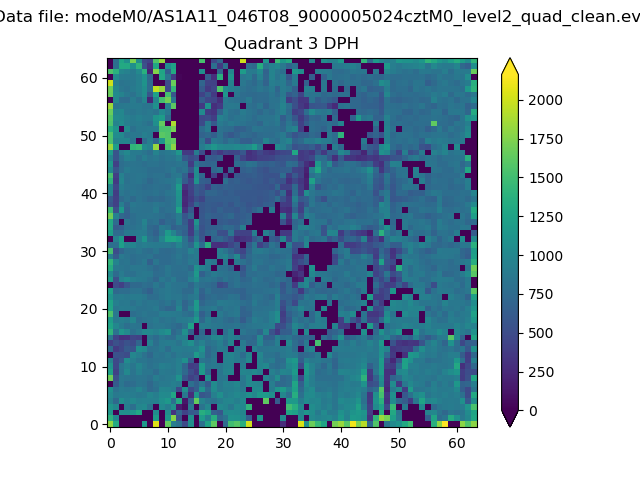 |
 |
Quadrant C |
| Plot type | Count rate plots | Images |
|---|---|---|
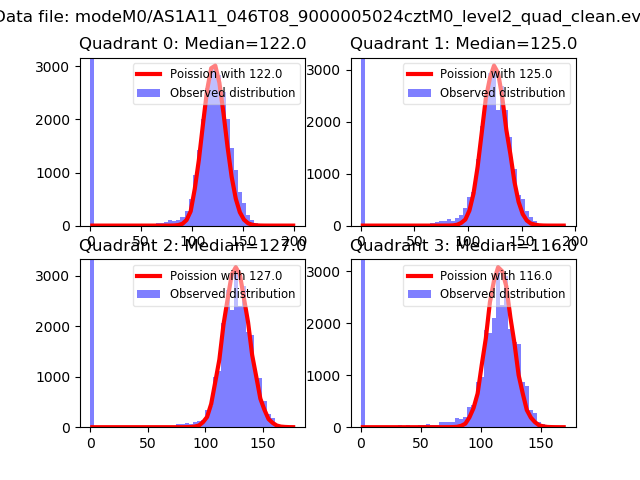
| Comparison with Poisson distribution Blue bars denote a histogram of data divided into 1 sec bins. Red curve is a Poisson curve with rate = median count rate of data. |
 |
 |
| Quadrant-wise count rates Data is divided into 100 sec bins |
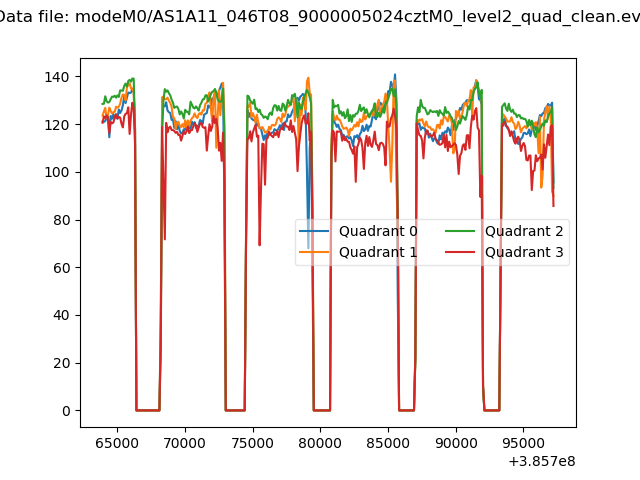 |
|
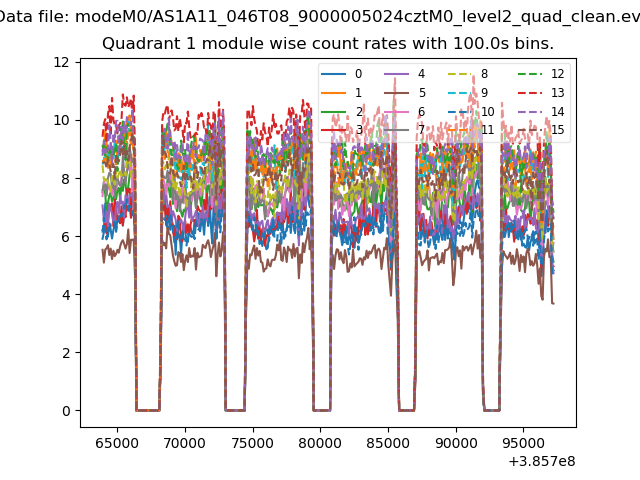
| Module-wise count rates for Quadrant A Data is divided into 100 sec bins |
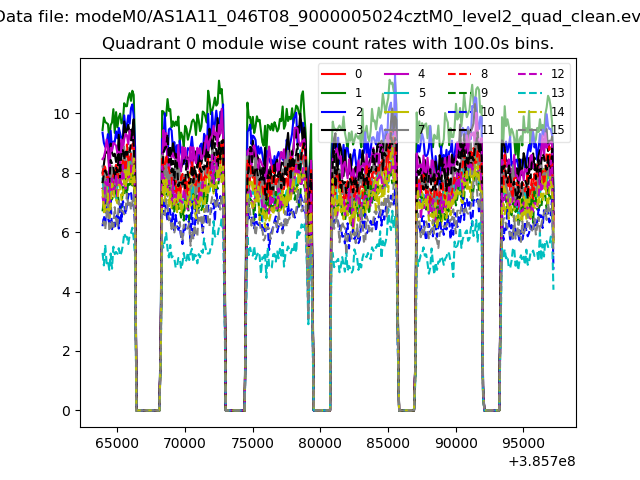 |
 |
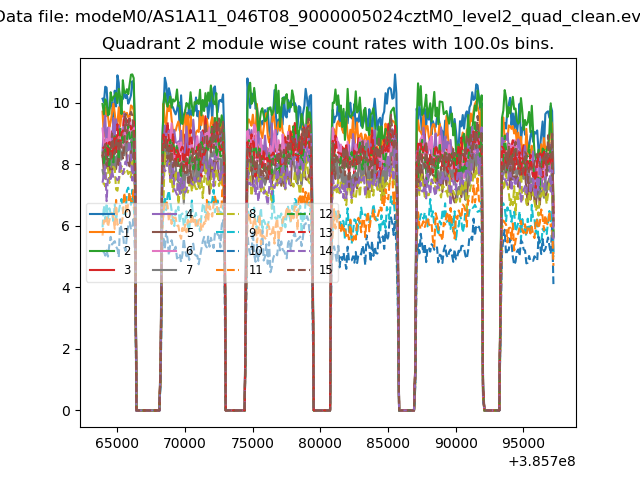
| Module-wise count rates for Quadrant B Data is divided into 100 sec bins |
 |
 |
| Module-wise count rates for Quadrant C Data is divided into 100 sec bins |
 |
 |
| Module-wise count rates for Quadrant D Data is divided into 100 sec bins |
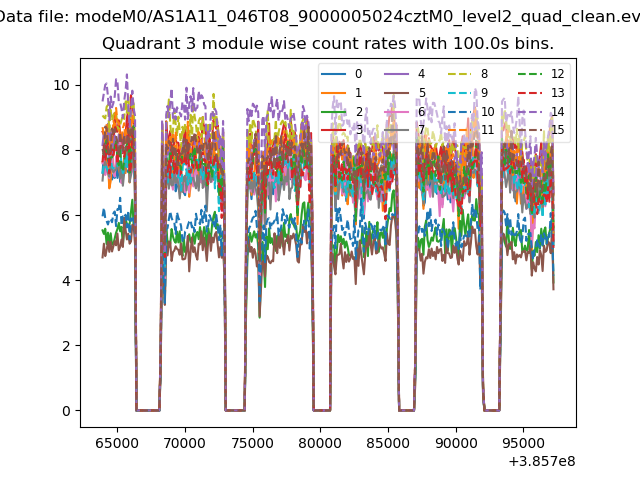 |
 |
| Parameter | Plot |
|---|---|
| CZT HV Monitor | 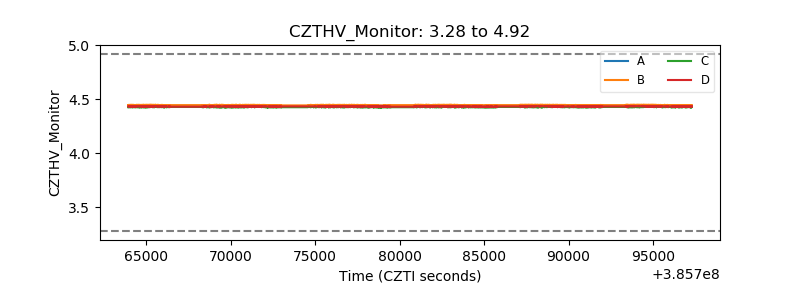 |
| D_VDD | 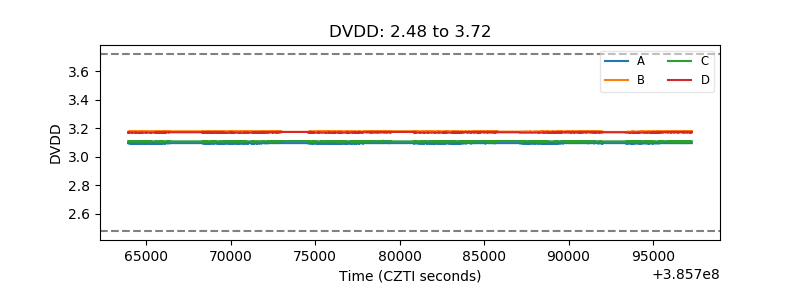 |
| Temperature 1 | 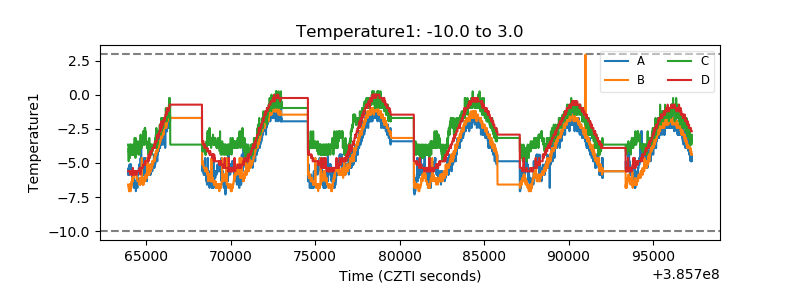 |
| Veto HV Monitor | 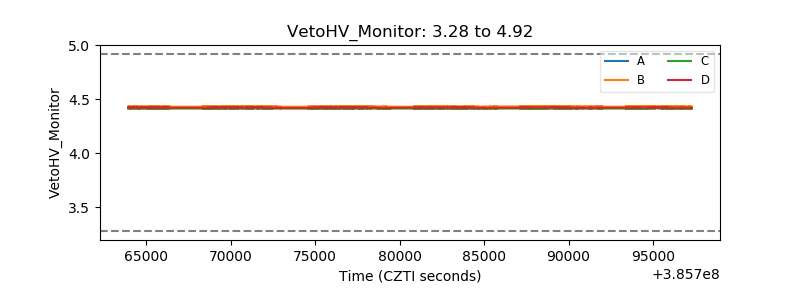 |
| Veto LLD | 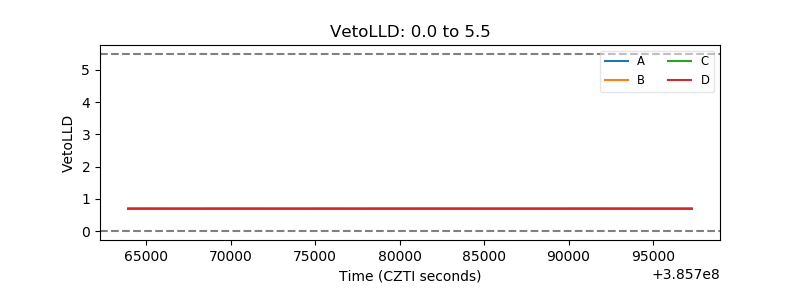 |
| Alpha Counter | 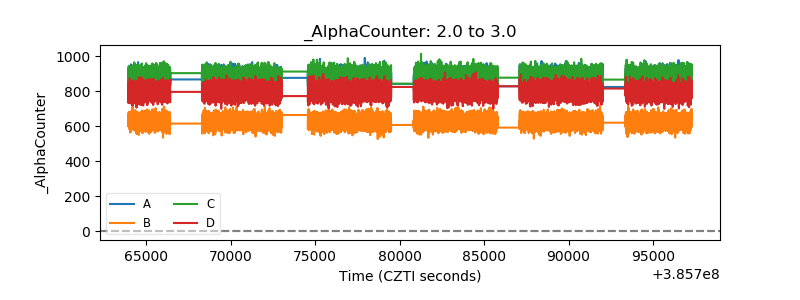 |
| _CPM_Rate | 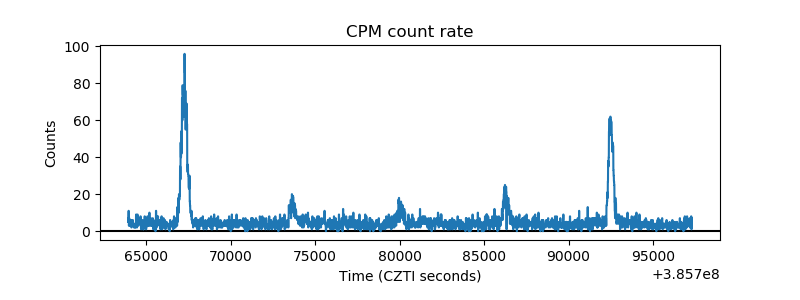 |
| CZT Counter | 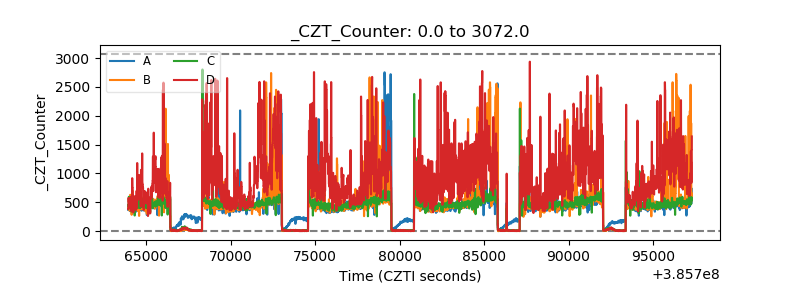 |
| +2.5 Volts monitor | 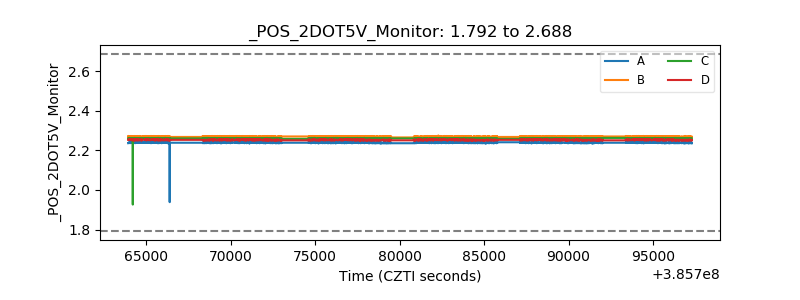 |
| +5 Volts monitor | 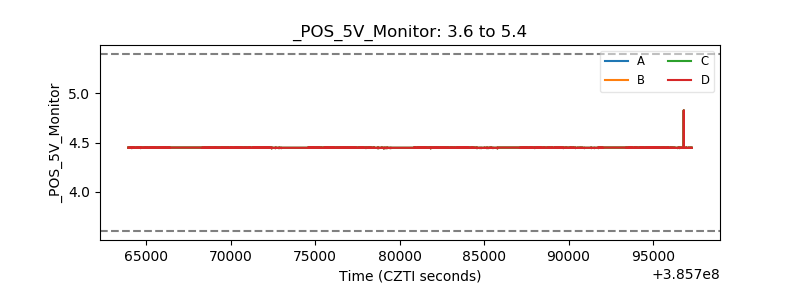 |
| _ROLL_ROT | 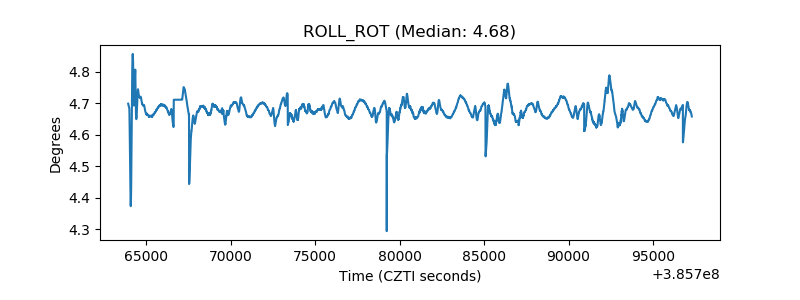 |
| _Roll_DEC | 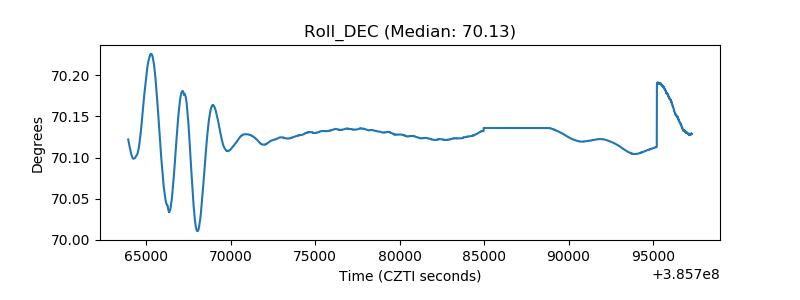 |
| _Roll_RA | 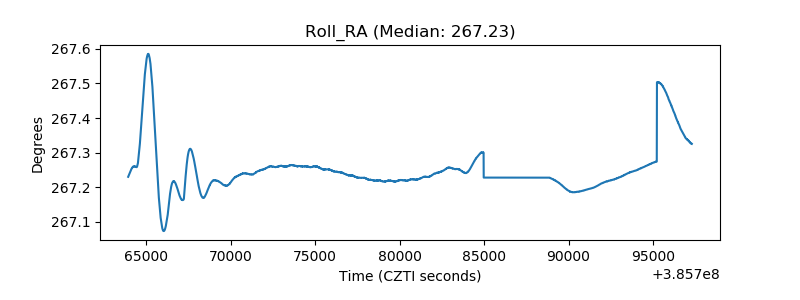 |
| Veto Counter | 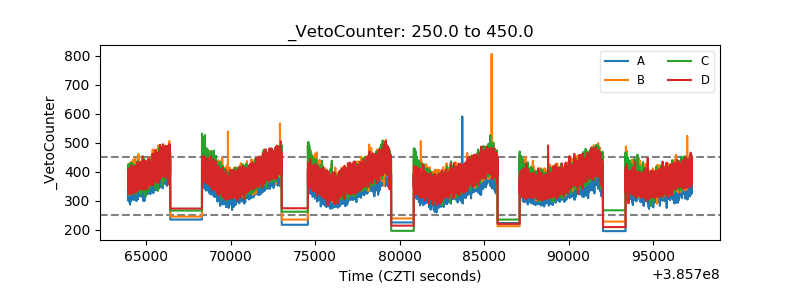 |