| Param | Original file | Final file |
|---|---|---|
| Filename | modeM0/AS1A10_123T17_9000005018_35048cztM0_level2.evt | modeM0/AS1A10_123T17_9000005018_35048cztM0_level2_quad_clean.evt |
| Size (bytes) | 1,350,057,600 | 279,043,200 |
| Size | 1.3 GB | 266.1 MB |
| Events in quadrant A | 7,831,789 | 1,881,686 |
| Events in quadrant B | 8,736,163 | 1,880,878 |
| Events in quadrant C | 8,535,061 | 1,864,740 |
| Events in quadrant D | 14,699,759 | 1,716,050 |
| Mode M0 | |||
|---|---|---|---|
| Quadrant | BADHDUFLAG | Total packets | Discarded packets |
| A | 0 | 33477 | 4 |
| B | 0 | 36076 | 3 |
| C | 0 | 34456 | 3 |
| D | 0 | 55054 | 3 |
| Mode SS | |||
|---|---|---|---|
| Quadrant | BADHDUFLAG | Total packets | Discarded packets |
| A | 0 | 324 | 0 |
| B | 0 | 324 | 0 |
| C | 0 | 324 | 0 |
| D | 0 | 324 | 0 |
| Mode M9 | |||
|---|---|---|---|
| Quadrant | BADHDUFLAG | Total packets | Discarded packets |
| A | 0 | 56 | 0 |
| B | 0 | 56 | 0 |
| C | 0 | 56 | 0 |
| D | 0 | 56 | 0 |
| Quadrant | Total seconds | Saturated seconds | Saturation percentage |
|---|---|---|---|
| A | 16093 | 19 | 0.118064% |
| B | 16093 | 213 | 1.323557% |
| C | 16093 | 45 | 0.279625% |
| D | 16093 | 914 | 5.679488% |
Noise dominated data is calculated using 1-second bins in cleaned event files. If a bin has >2000 counts, and if more than 50% of those come from <1% of pixels, then it is considered to be noise-dominated and hence unusable.
| Quadrant | # 1 sec bins | Bins with >0 counts | Bins with >2000 counts | High rate bins dominated by noise | Noise dominated (total time) | Noise dominated (detector-on time) | Marked lightcurve |
|---|---|---|---|---|---|---|---|
| A | 21561 | 16096 | 1 | 1 | 0.00% | 0.01% | 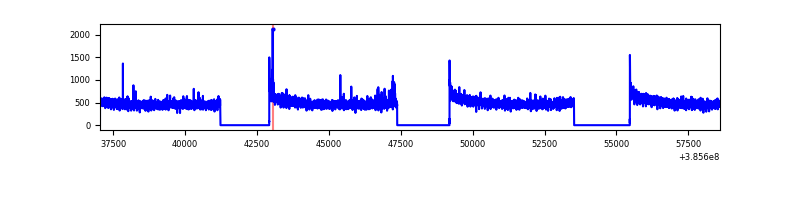 |
| B | 21561 | 16096 | 161 | 161 | 0.75% | 1.00% | 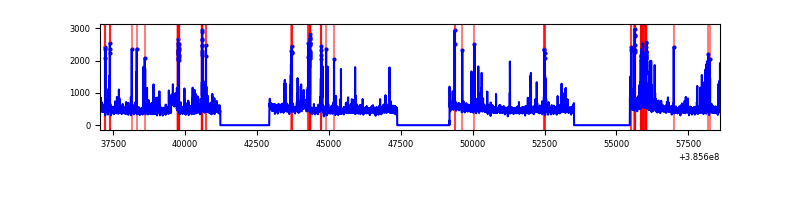 |
| C | 21561 | 16096 | 31 | 31 | 0.14% | 0.19% | 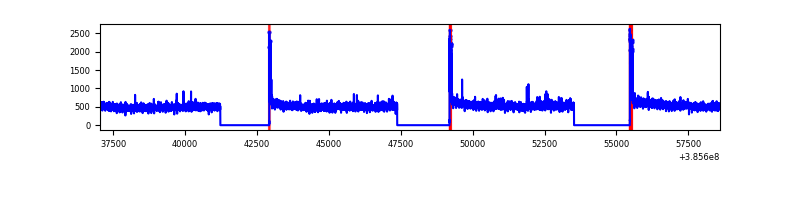 |
| D | 21561 | 16096 | 867 | 867 | 4.02% | 5.39% | 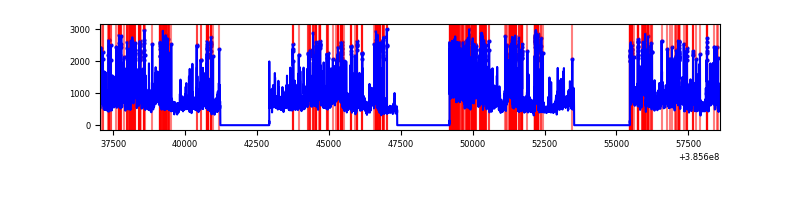 |
Top three noisy pixels from each quadrant. If the there are fewer than three noisy pixels in the level2.evt file, extra rows are filled as -1
| Pixel properties | Quadrant properties | ||||||
|---|---|---|---|---|---|---|---|
| Quadrant | DetID | PixID | Counts | Sigma | Mean | Median | Sigma |
| A | 10 | 83 | 150122 | 379.7 | 1967 | 1931 | 390.3 |
| A | 10 | 255 | 34817 | 84.26 | 1967 | 1931 | 390.3 |
| A | 13 | 6 | 29046 | 69.47 | 1967 | 1931 | 390.3 |
| B | 5 | 172 | 521558 | 1439.34 | 1930 | 1879 | 361.1 |
| B | 5 | 200 | 316883 | 872.46 | 1930 | 1879 | 361.1 |
| B | 0 | 190 | 149830 | 409.77 | 1930 | 1879 | 361.1 |
| C | 15 | 214 | 655496 | 1494.07 | 1921 | 1939 | 437.4 |
| C | 14 | 67 | 163776 | 369.97 | 1921 | 1939 | 437.4 |
| C | 0 | 10 | 162612 | 367.31 | 1921 | 1939 | 437.4 |
| D | 8 | 195 | 2877088 | 6354.62 | 1882 | 1832 | 452.5 |
| D | 13 | 249 | 1441161 | 3181.07 | 1882 | 1832 | 452.5 |
| D | 14 | 52 | 1164061 | 2568.65 | 1882 | 1832 | 452.5 |
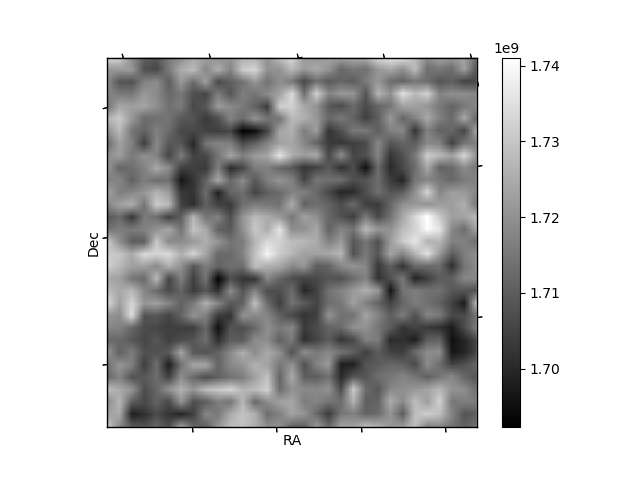
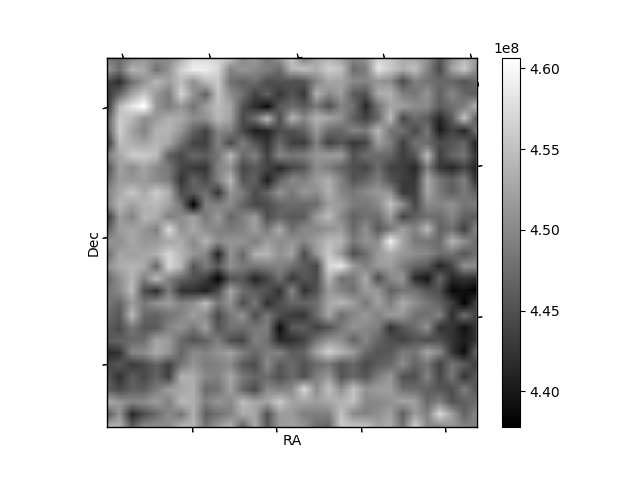
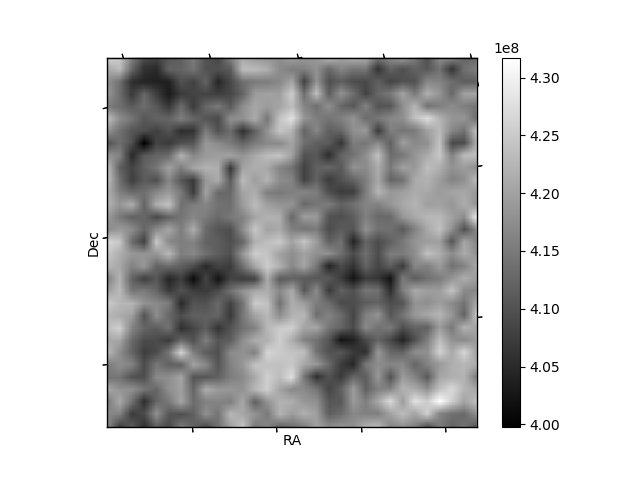
Histogram calculated using DETX and DETY for each event in the final _common_clean file
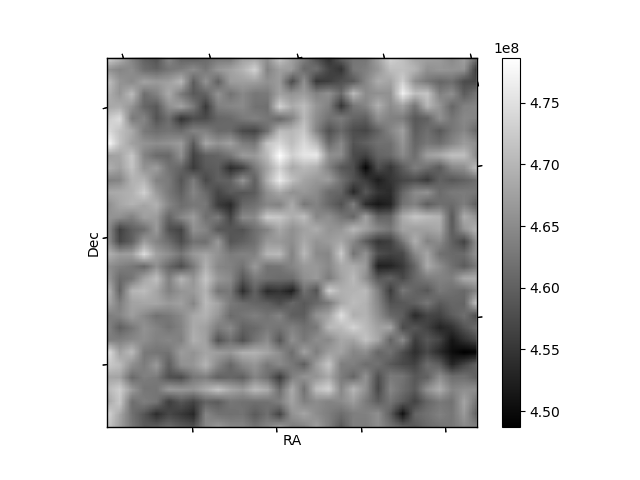
| Quadrant A | 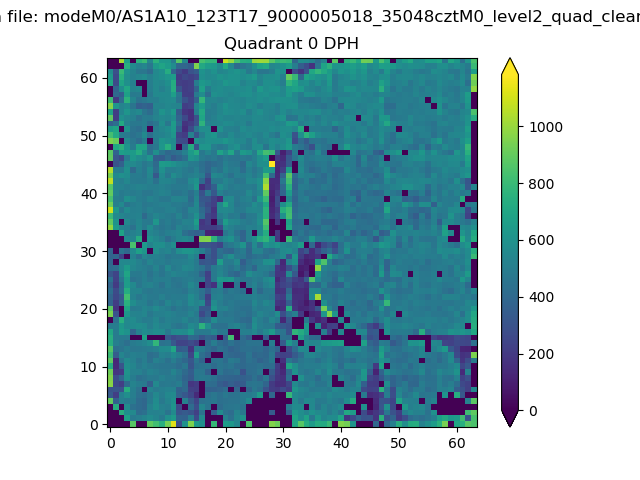 |
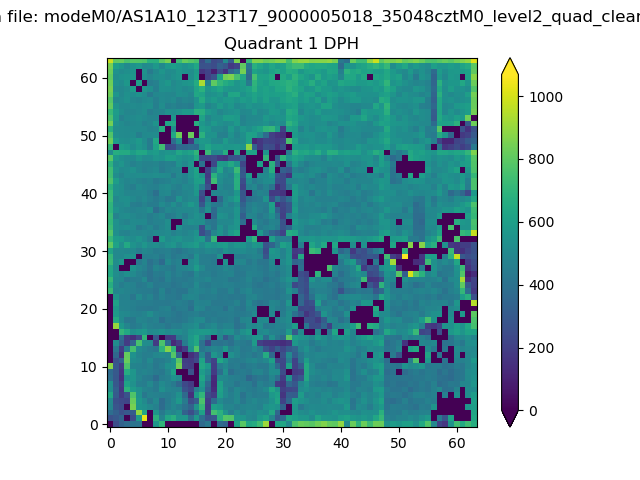 |
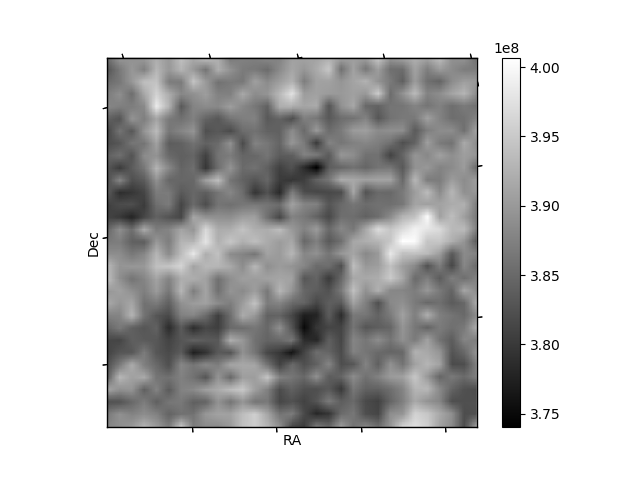
Quadrant B |
|---|---|---|---|
| Quadrant D | 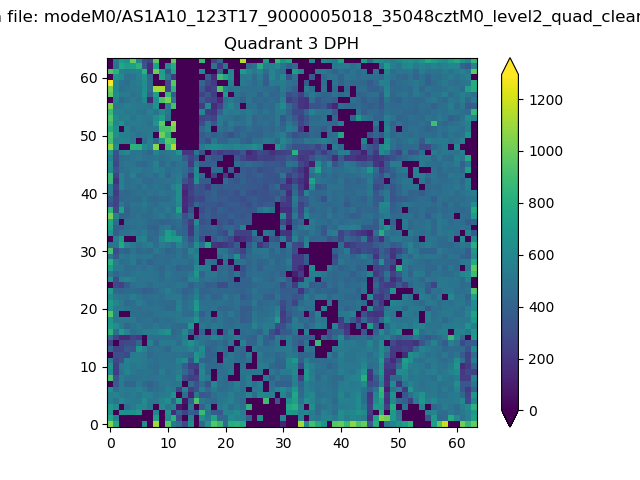 |
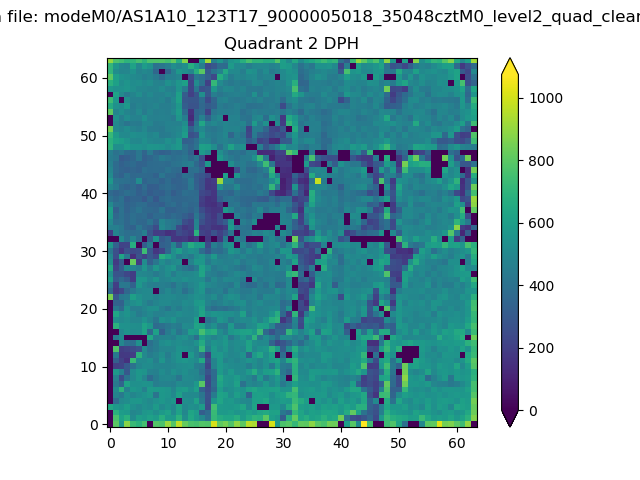 |
Quadrant C |
| Plot type | Count rate plots | Images |
|---|---|---|
| Comparison with Poisson distribution Blue bars denote a histogram of data divided into 1 sec bins. Red curve is a Poisson curve with rate = median count rate of data. |
 |
 |
| Quadrant-wise count rates Data is divided into 100 sec bins |
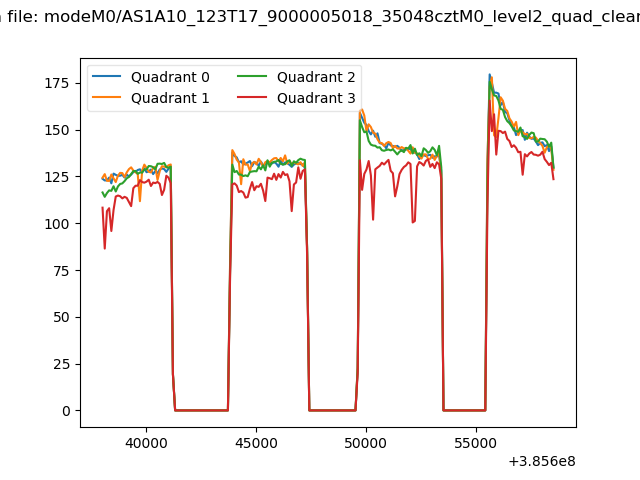 |
|
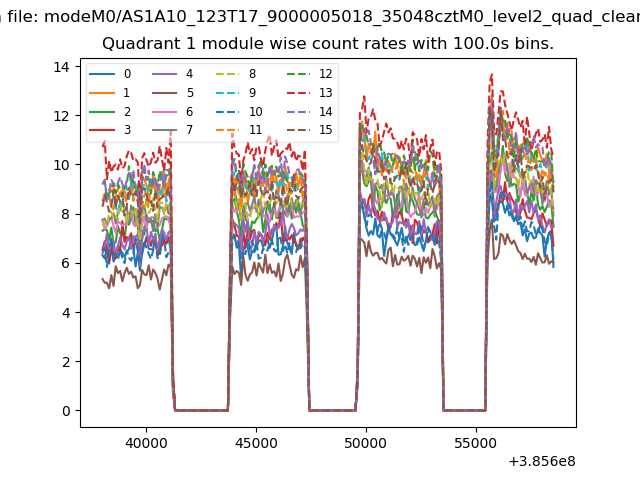
| Module-wise count rates for Quadrant A Data is divided into 100 sec bins |
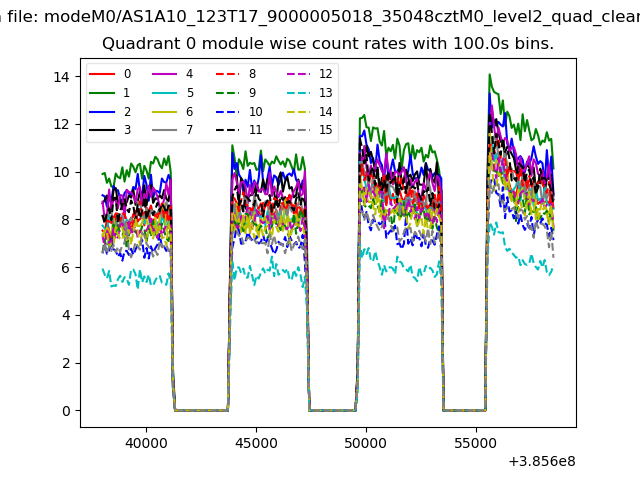 |
 |
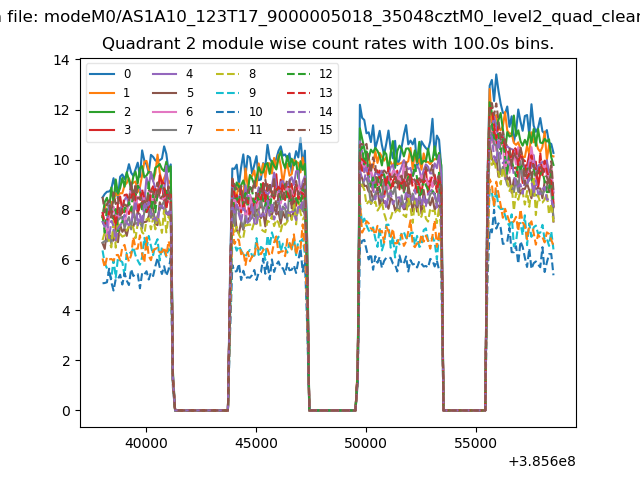
| Module-wise count rates for Quadrant B Data is divided into 100 sec bins |
 |
 |
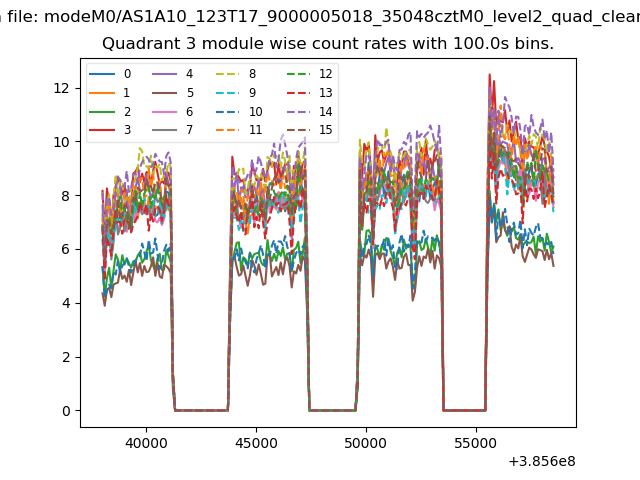
| Module-wise count rates for Quadrant C Data is divided into 100 sec bins |
 |
 |
| Module-wise count rates for Quadrant D Data is divided into 100 sec bins |
 |
 |
| Parameter | Plot |
|---|---|
| CZT HV Monitor | 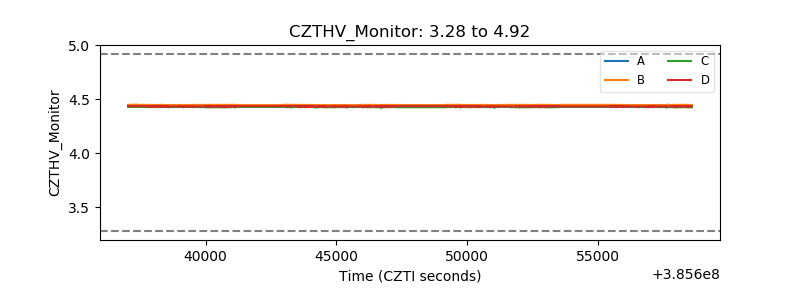 |
| D_VDD | 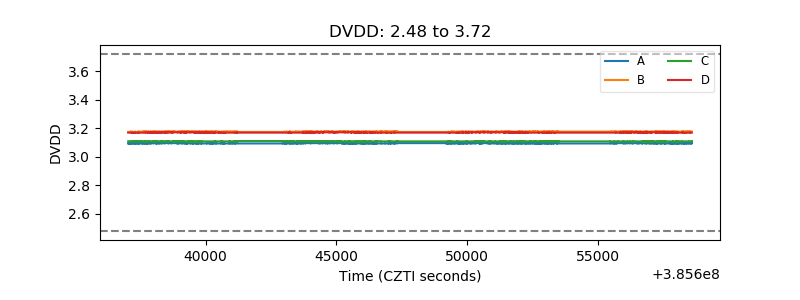 |
| Temperature 1 | 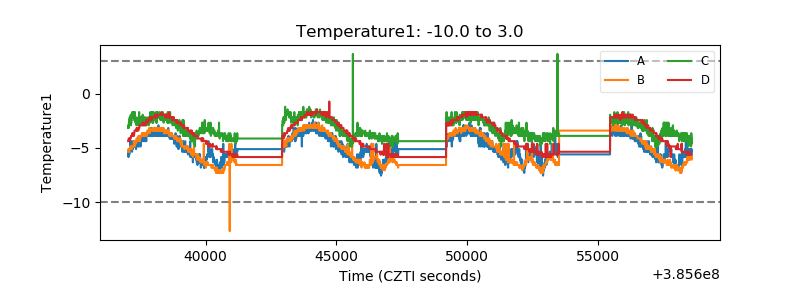 |
| Veto HV Monitor | 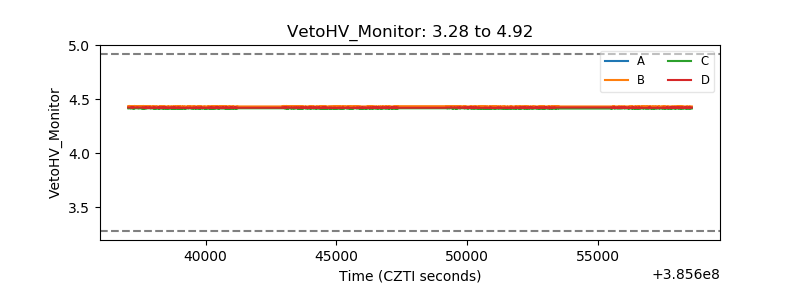 |
| Veto LLD | 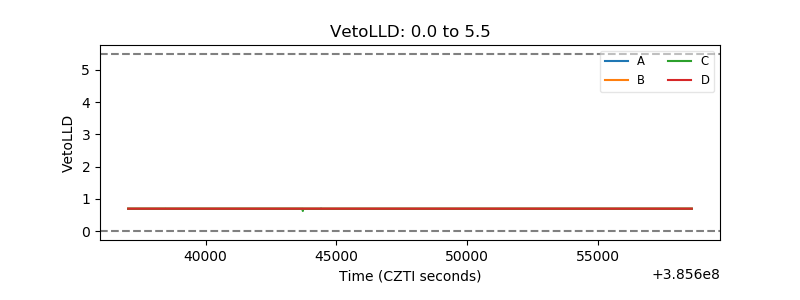 |
| Alpha Counter | 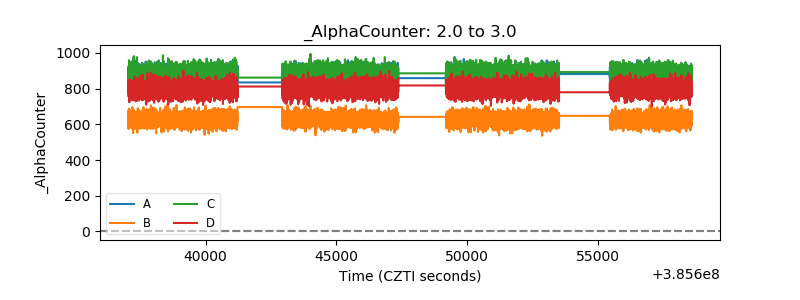 |
| _CPM_Rate | 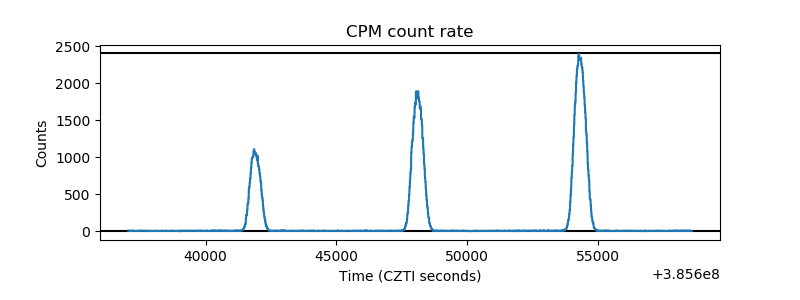 |
| CZT Counter | 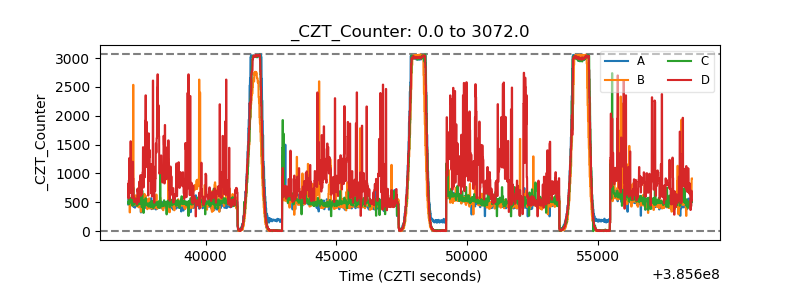 |
| +2.5 Volts monitor | 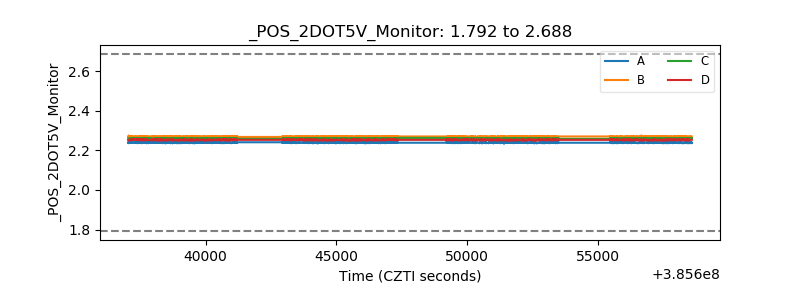 |
| +5 Volts monitor | 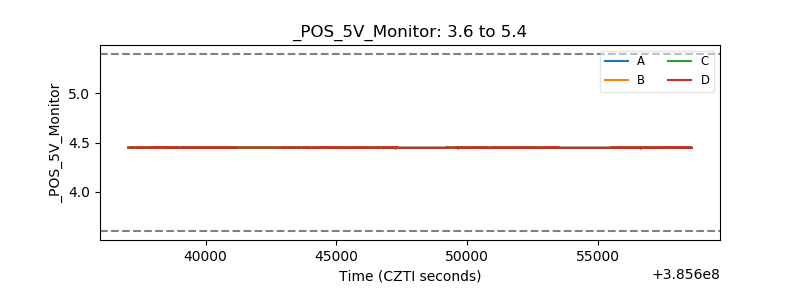 |
| _ROLL_ROT | 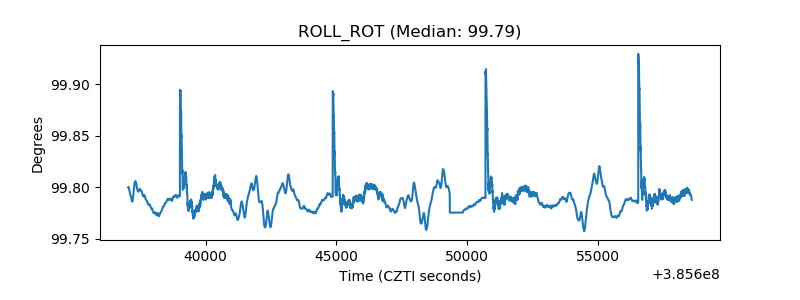 |
| _Roll_DEC | 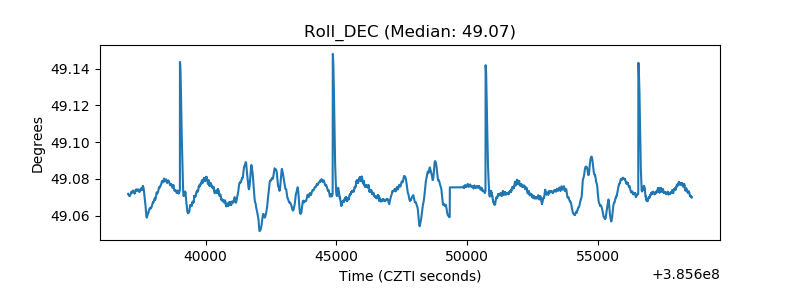 |
| _Roll_RA | 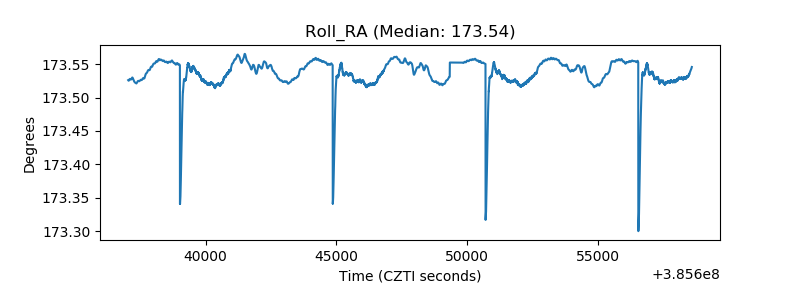 |
| Veto Counter | 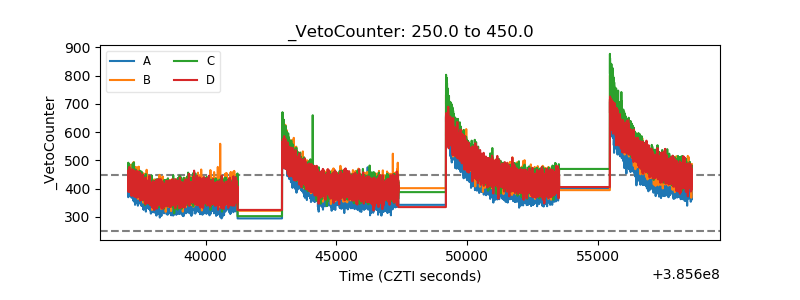 |