| Param | Original file | Final file |
|---|---|---|
| Filename | modeM0/AS1A10_123T17_9000005018_35044cztM0_level2.evt | modeM0/AS1A10_123T17_9000005018_35044cztM0_level2_quad_clean.evt |
| Size (bytes) | 457,830,720 | 107,187,840 |
| Size | 436.6 MB | 102.2 MB |
| Events in quadrant A | 2,731,643 | 735,050 |
| Events in quadrant B | 3,097,318 | 733,169 |
| Events in quadrant C | 3,025,443 | 735,461 |
| Events in quadrant D | 4,658,114 | 678,225 |
| Mode M0 | |||
|---|---|---|---|
| Quadrant | BADHDUFLAG | Total packets | Discarded packets |
| A | 0 | 11383 | 3 |
| B | 0 | 12408 | 2 |
| C | 0 | 12153 | 2 |
| D | 0 | 17574 | 2 |
| Mode SS | |||
|---|---|---|---|
| Quadrant | BADHDUFLAG | Total packets | Discarded packets |
| A | 0 | 106 | 0 |
| B | 0 | 106 | 0 |
| C | 0 | 106 | 0 |
| D | 0 | 106 | 0 |
| Mode M9 | |||
|---|---|---|---|
| Quadrant | BADHDUFLAG | Total packets | Discarded packets |
| A | 0 | 41 | 0 |
| B | 0 | 41 | 0 |
| C | 0 | 41 | 0 |
| D | 0 | 41 | 0 |
| Quadrant | Total seconds | Saturated seconds | Saturation percentage |
|---|---|---|---|
| A | 5209 | 8 | 0.153580% |
| B | 5209 | 129 | 2.476483% |
| C | 5209 | 42 | 0.806297% |
| D | 5209 | 229 | 4.396237% |
Noise dominated data is calculated using 1-second bins in cleaned event files. If a bin has >2000 counts, and if more than 50% of those come from <1% of pixels, then it is considered to be noise-dominated and hence unusable.
| Quadrant | # 1 sec bins | Bins with >0 counts | Bins with >2000 counts | High rate bins dominated by noise | Noise dominated (total time) | Noise dominated (detector-on time) | Marked lightcurve |
|---|---|---|---|---|---|---|---|
| A | 9215 | 5211 | 0 | 0 | 0.00% | 0.00% | 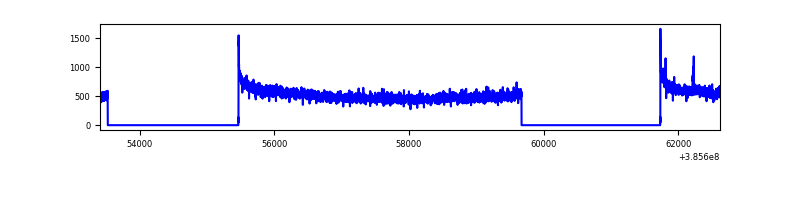 |
| B | 9215 | 5211 | 90 | 90 | 0.98% | 1.73% | 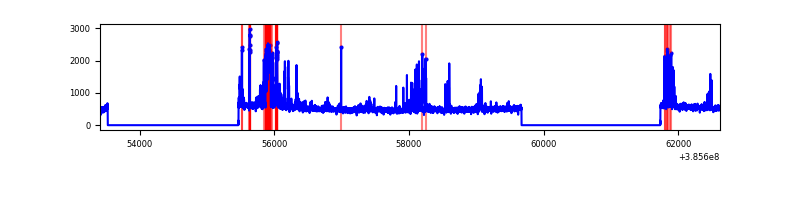 |
| C | 9215 | 5211 | 27 | 27 | 0.29% | 0.52% | 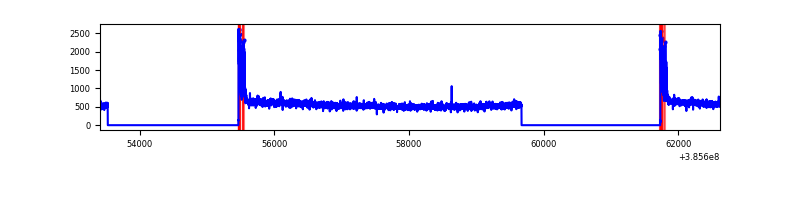 |
| D | 9215 | 5211 | 203 | 203 | 2.20% | 3.90% | 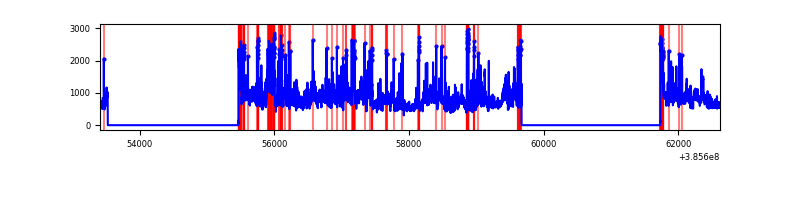 |
Top three noisy pixels from each quadrant. If the there are fewer than three noisy pixels in the level2.evt file, extra rows are filled as -1
| Pixel properties | Quadrant properties | ||||||
|---|---|---|---|---|---|---|---|
| Quadrant | DetID | PixID | Counts | Sigma | Mean | Median | Sigma |
| A | 10 | 83 | 76956 | 571.04 | 678 | 667 | 133.6 |
| A | 15 | 169 | 20368 | 147.47 | 678 | 667 | 133.6 |
| A | 13 | 6 | 10475 | 73.42 | 678 | 667 | 133.6 |
| B | 5 | 172 | 393668 | 3163.96 | 664 | 647 | 124.2 |
| B | 0 | 190 | 47955 | 380.85 | 664 | 647 | 124.2 |
| B | 4 | 232 | 35136 | 277.65 | 664 | 647 | 124.2 |
| C | 15 | 214 | 217696 | 1418.38 | 667 | 674 | 153.0 |
| C | 0 | 10 | 149846 | 974.94 | 667 | 674 | 153.0 |
| C | 14 | 67 | 50980 | 328.78 | 667 | 674 | 153.0 |
| D | 8 | 195 | 1018510 | 6441.29 | 657 | 641 | 158.0 |
| D | 5 | 223 | 256566 | 1619.55 | 657 | 641 | 158.0 |
| D | 13 | 249 | 250184 | 1579.16 | 657 | 641 | 158.0 |
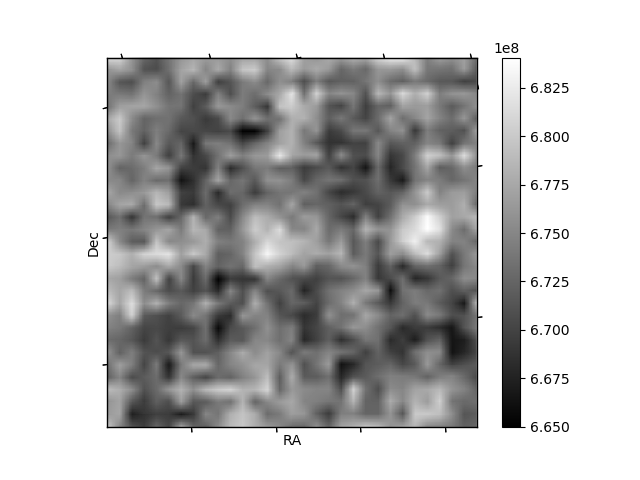
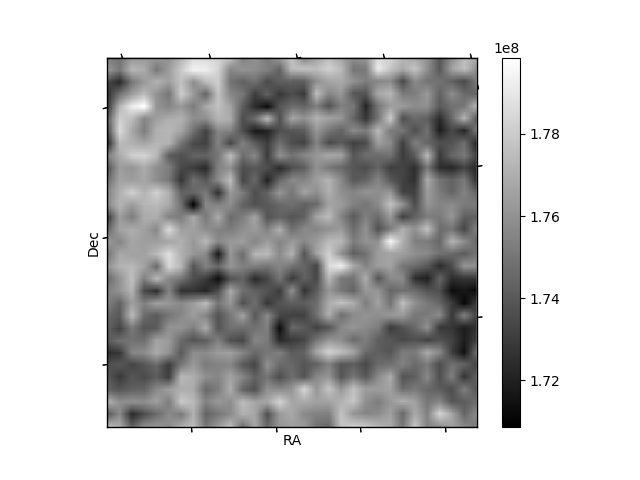
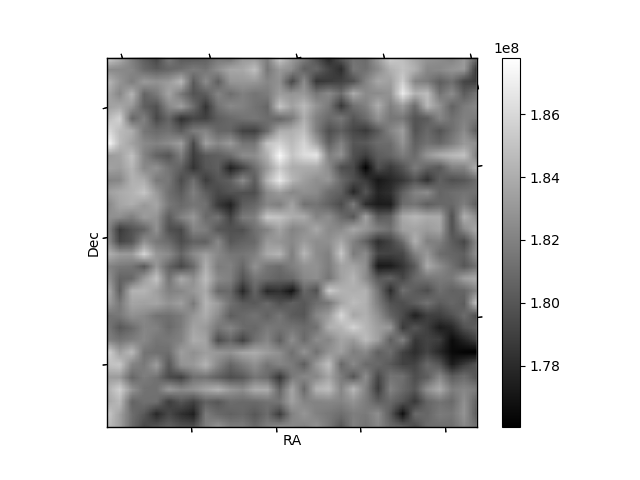
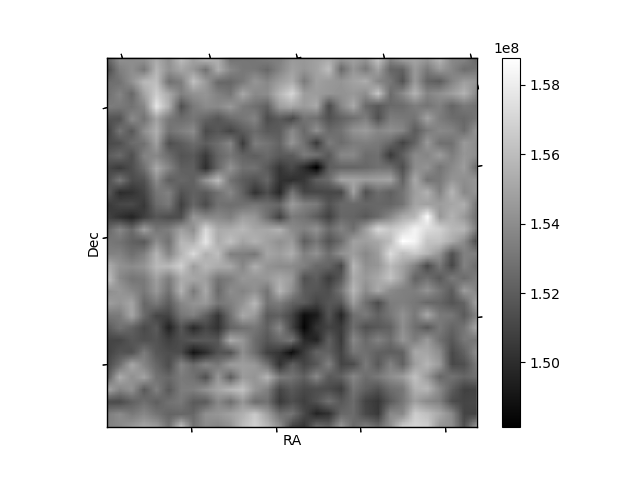
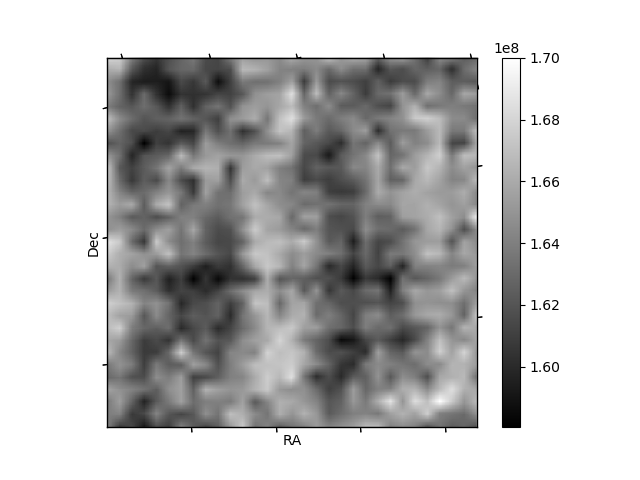
Histogram calculated using DETX and DETY for each event in the final _common_clean file
| Quadrant A | 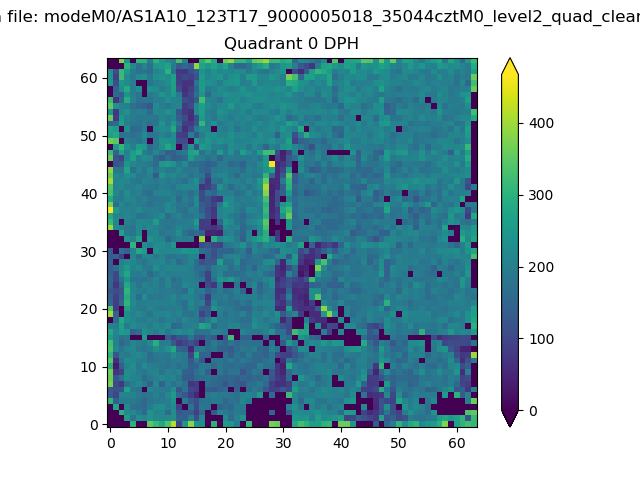 |
 |
Quadrant B |
|---|---|---|---|
| Quadrant D | 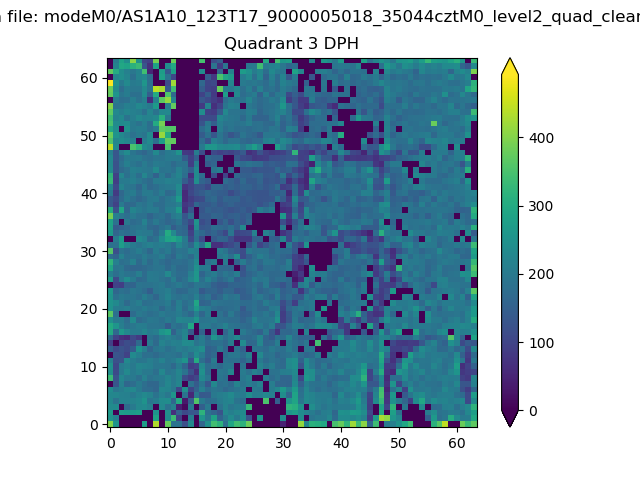 |
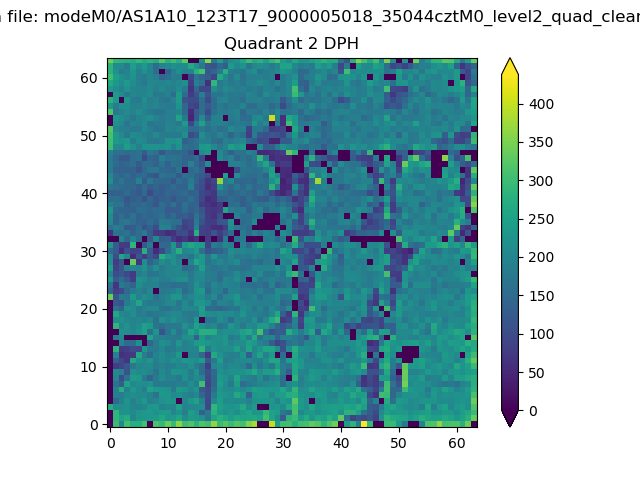 |
Quadrant C |
| Plot type | Count rate plots | Images |
|---|---|---|
| Comparison with Poisson distribution Blue bars denote a histogram of data divided into 1 sec bins. Red curve is a Poisson curve with rate = median count rate of data. |
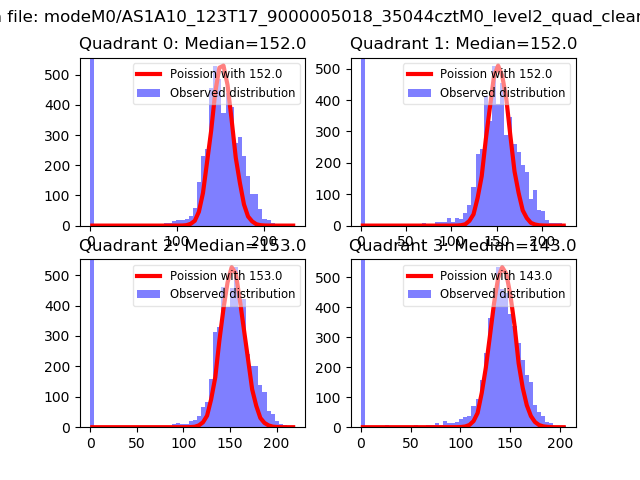 |
 |
| Quadrant-wise count rates Data is divided into 100 sec bins |
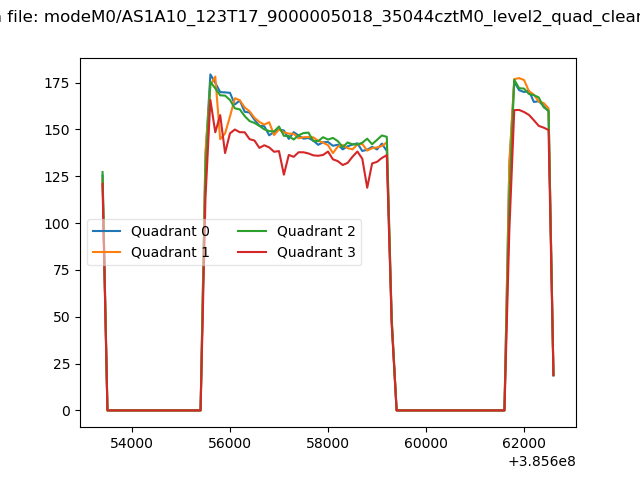 |
|
| Module-wise count rates for Quadrant A Data is divided into 100 sec bins |
 |
 |
| Module-wise count rates for Quadrant B Data is divided into 100 sec bins |
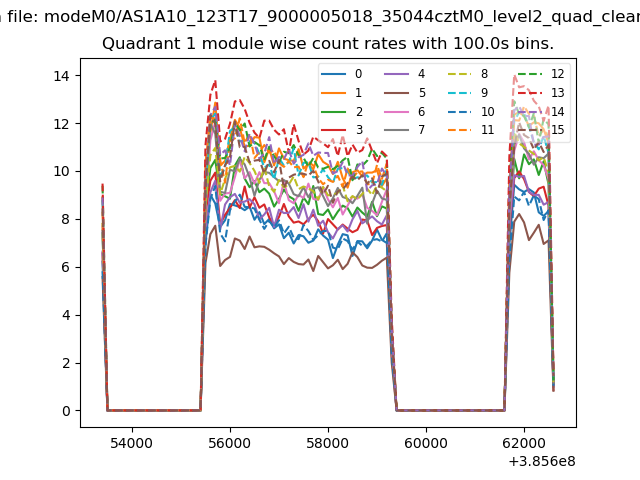 |
 |
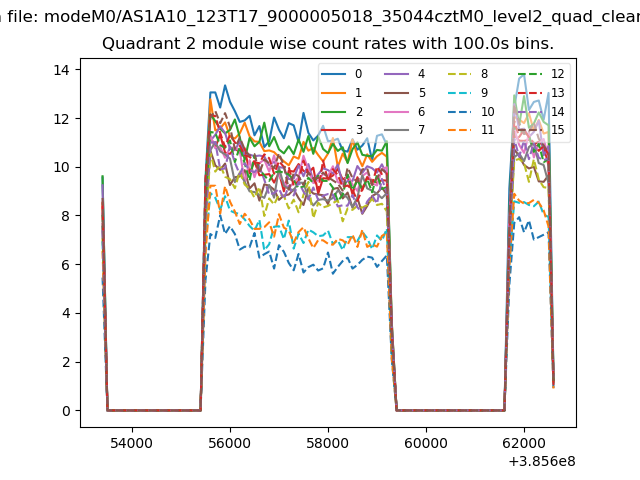
| Module-wise count rates for Quadrant C Data is divided into 100 sec bins |
 |
 |
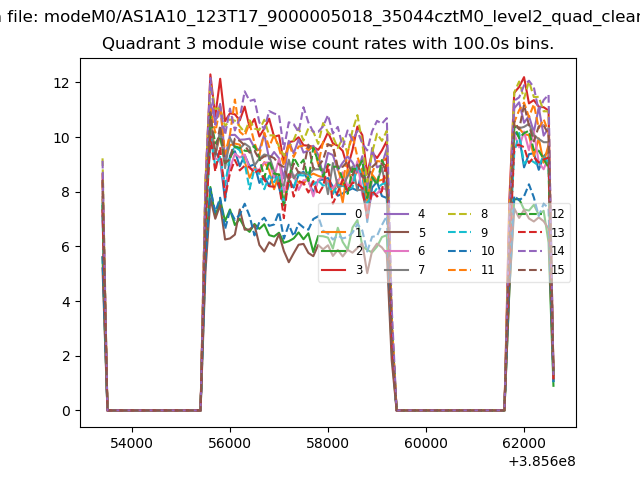
| Module-wise count rates for Quadrant D Data is divided into 100 sec bins |
 |
 |
| Parameter | Plot |
|---|---|
| CZT HV Monitor | 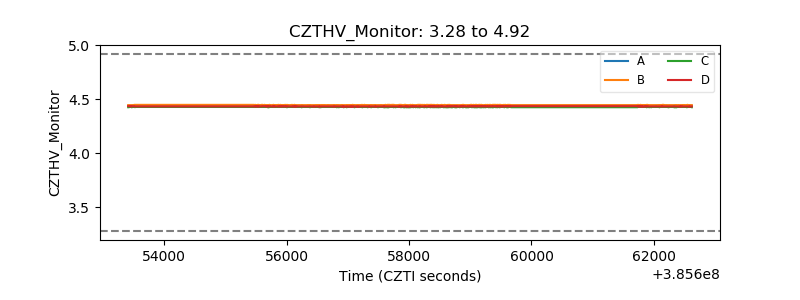 |
| D_VDD | 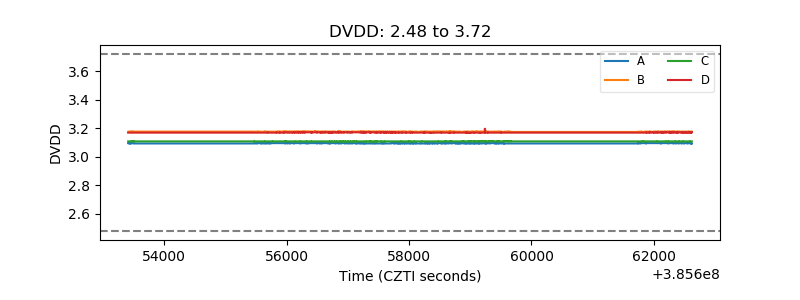 |
| Temperature 1 | 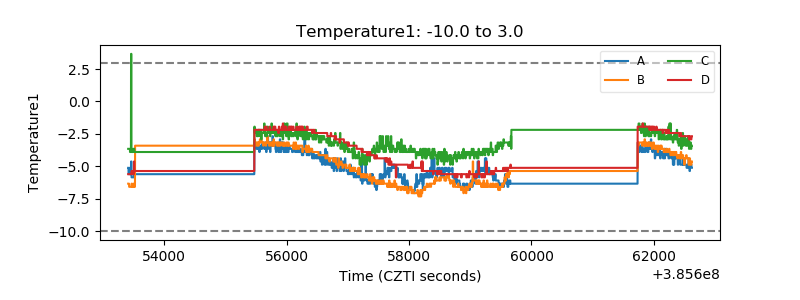 |
| Veto HV Monitor | 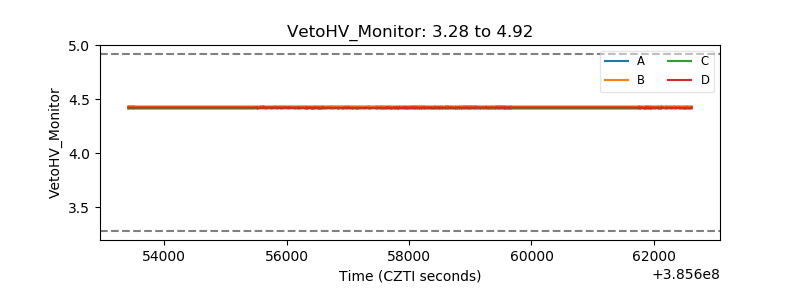 |
| Veto LLD | 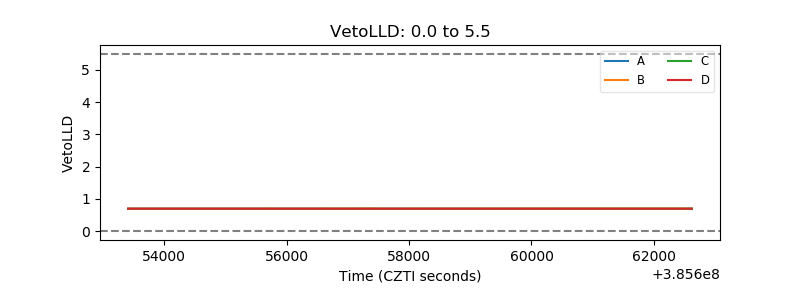 |
| Alpha Counter | 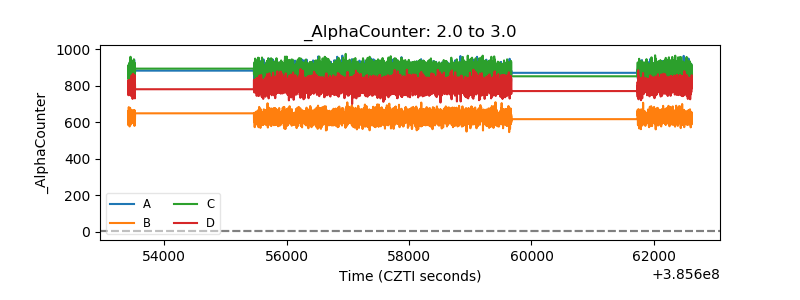 |
| _CPM_Rate | 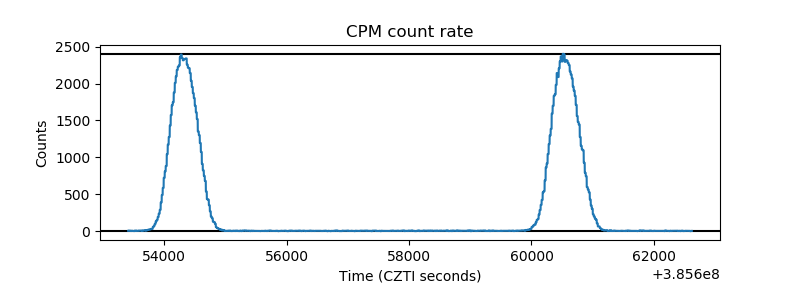 |
| CZT Counter | 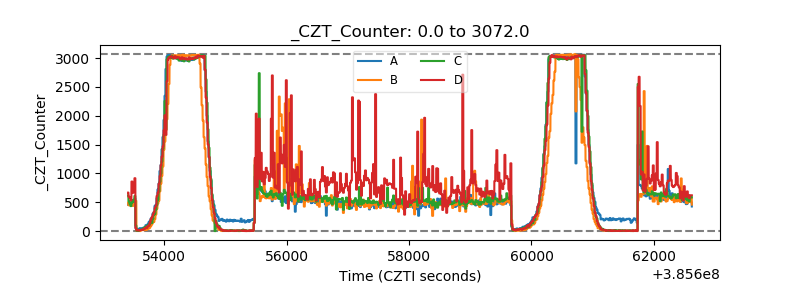 |
| +2.5 Volts monitor | 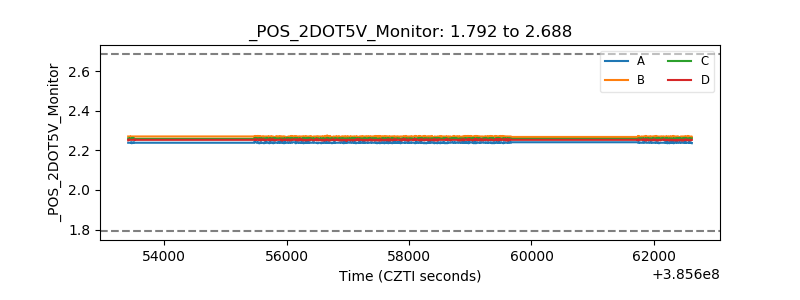 |
| +5 Volts monitor | 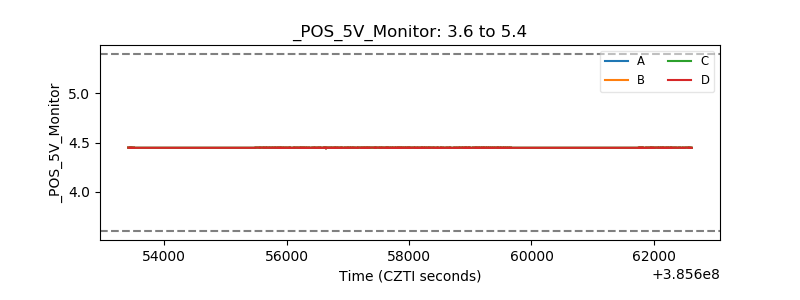 |
| _ROLL_ROT | 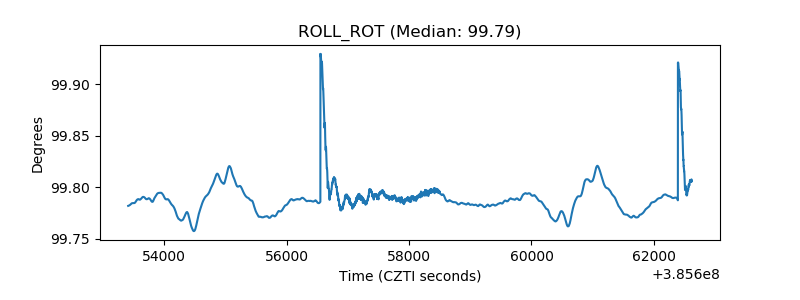 |
| _Roll_DEC | 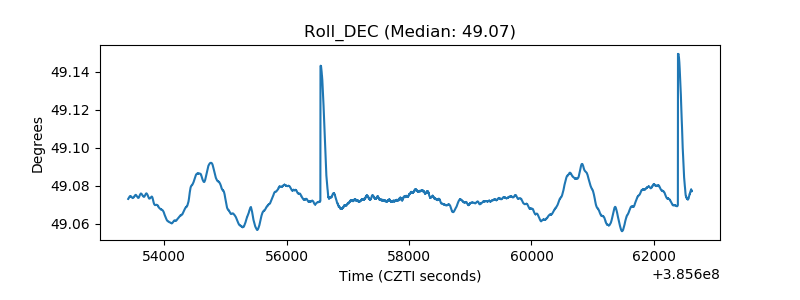 |
| _Roll_RA | 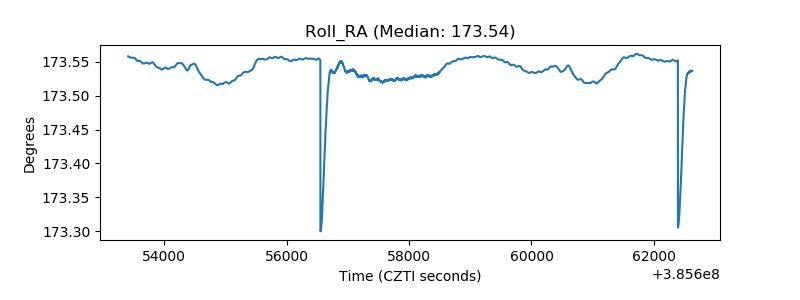 |
| Veto Counter | 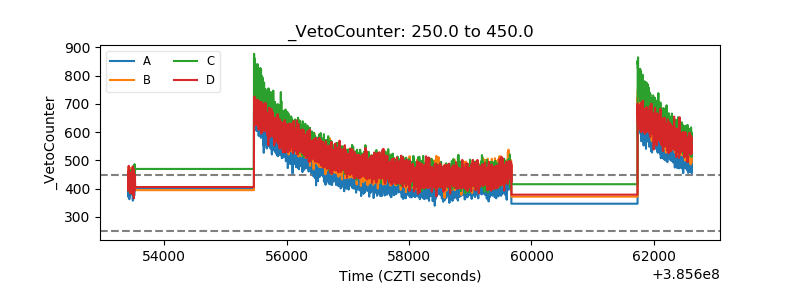 |