| Param | Original file | Final file |
|---|---|---|
| Filename | modeM0/AS1A10_123T17_9000005018_35043cztM0_level2.evt | modeM0/AS1A10_123T17_9000005018_35043cztM0_level2_quad_clean.evt |
| Size (bytes) | 477,282,240 | 99,734,400 |
| Size | 455.2 MB | 95.1 MB |
| Events in quadrant A | 2,706,875 | 684,415 |
| Events in quadrant B | 3,024,057 | 681,015 |
| Events in quadrant C | 3,033,956 | 676,604 |
| Events in quadrant D | 5,334,154 | 611,172 |
| Mode M0 | |||
|---|---|---|---|
| Quadrant | BADHDUFLAG | Total packets | Discarded packets |
| A | 0 | 11356 | 3 |
| B | 0 | 12278 | 2 |
| C | 0 | 12164 | 2 |
| D | 0 | 19546 | 2 |
| Mode SS | |||
|---|---|---|---|
| Quadrant | BADHDUFLAG | Total packets | Discarded packets |
| A | 0 | 106 | 0 |
| B | 0 | 106 | 0 |
| C | 0 | 106 | 0 |
| D | 0 | 106 | 0 |
| Mode M9 | |||
|---|---|---|---|
| Quadrant | BADHDUFLAG | Total packets | Discarded packets |
| A | 0 | 33 | 0 |
| B | 0 | 33 | 0 |
| C | 0 | 33 | 0 |
| D | 0 | 34 | 0 |
| Quadrant | Total seconds | Saturated seconds | Saturation percentage |
|---|---|---|---|
| A | 5245 | 7 | 0.133460% |
| B | 5245 | 128 | 2.440419% |
| C | 5245 | 38 | 0.724500% |
| D | 5245 | 525 | 10.009533% |
Noise dominated data is calculated using 1-second bins in cleaned event files. If a bin has >2000 counts, and if more than 50% of those come from <1% of pixels, then it is considered to be noise-dominated and hence unusable.
| Quadrant | # 1 sec bins | Bins with >0 counts | Bins with >2000 counts | High rate bins dominated by noise | Noise dominated (total time) | Noise dominated (detector-on time) | Marked lightcurve |
|---|---|---|---|---|---|---|---|
| A | 7188 | 5246 | 0 | 0 | 0.00% | 0.00% | 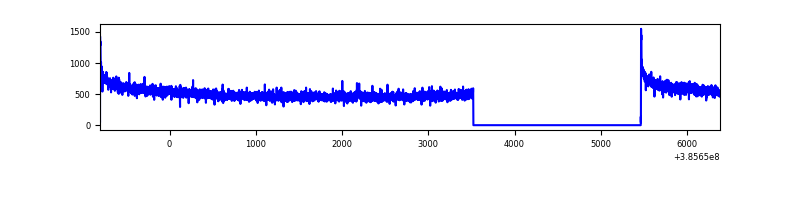 |
| B | 7188 | 5246 | 88 | 88 | 1.22% | 1.68% | 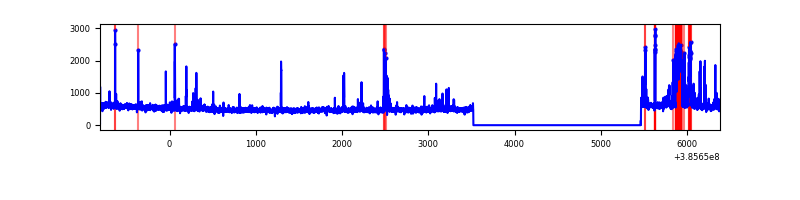 |
| C | 7188 | 5246 | 28 | 28 | 0.39% | 0.53% | 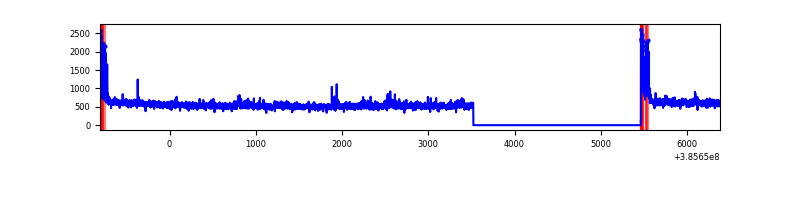 |
| D | 7188 | 5246 | 486 | 486 | 6.76% | 9.26% | 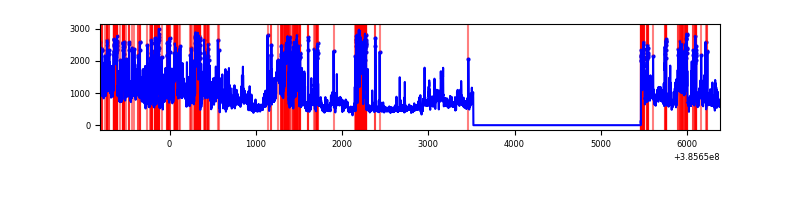 |
Top three noisy pixels from each quadrant. If the there are fewer than three noisy pixels in the level2.evt file, extra rows are filled as -1
| Pixel properties | Quadrant properties | ||||||
|---|---|---|---|---|---|---|---|
| Quadrant | DetID | PixID | Counts | Sigma | Mean | Median | Sigma |
| A | 10 | 83 | 75393 | 554.33 | 677 | 667 | 134.8 |
| A | 13 | 6 | 9221 | 63.46 | 677 | 667 | 134.8 |
| A | 13 | 254 | 7938 | 53.94 | 677 | 667 | 134.8 |
| B | 5 | 172 | 327220 | 2627.61 | 659 | 643 | 124.3 |
| B | 0 | 190 | 48217 | 382.78 | 659 | 643 | 124.3 |
| B | 3 | 112 | 20345 | 158.52 | 659 | 643 | 124.3 |
| C | 15 | 214 | 220237 | 1468.75 | 658 | 665 | 149.5 |
| C | 0 | 10 | 131765 | 876.95 | 658 | 665 | 149.5 |
| C | 14 | 67 | 74441 | 493.5 | 658 | 665 | 149.5 |
| D | 8 | 195 | 1013803 | 6581.74 | 636 | 618 | 153.9 |
| D | 13 | 249 | 729697 | 4736.16 | 636 | 618 | 153.9 |
| D | 12 | 217 | 339244 | 2199.74 | 636 | 618 | 153.9 |
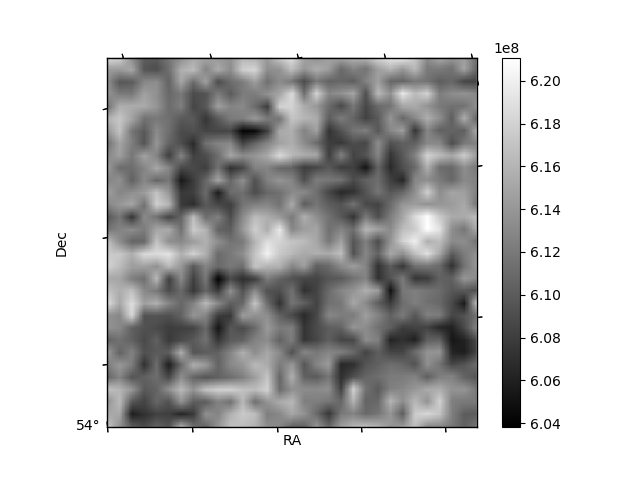
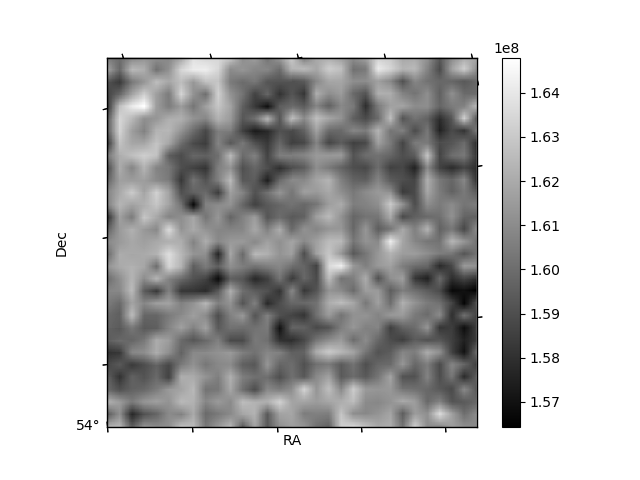
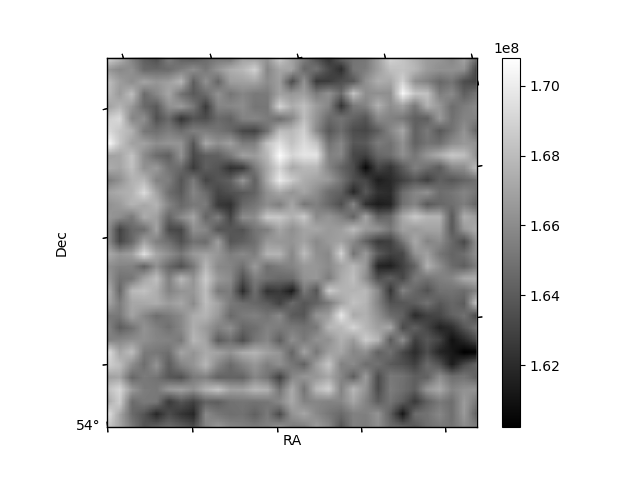
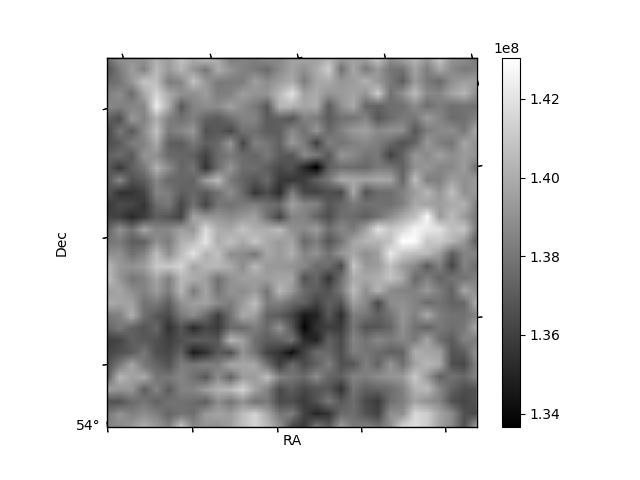
Histogram calculated using DETX and DETY for each event in the final _common_clean file
| Quadrant A | 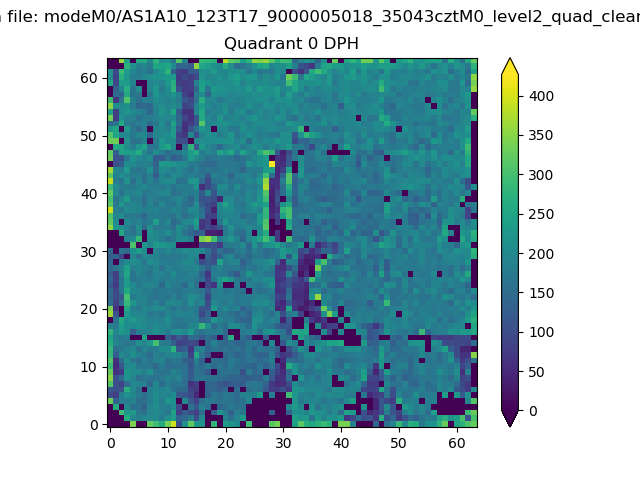 |
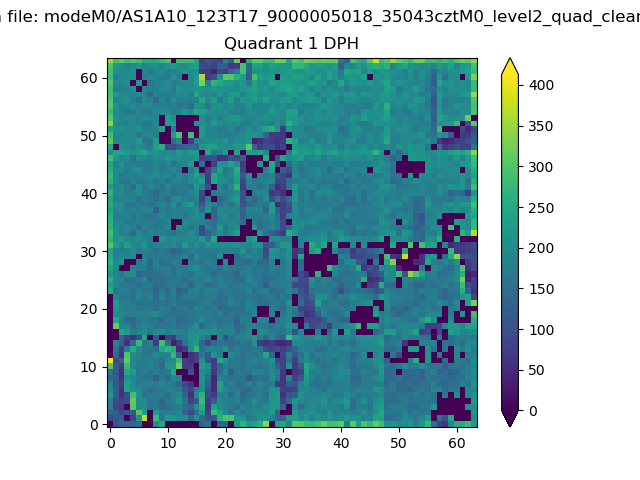 |
Quadrant B |
|---|---|---|---|
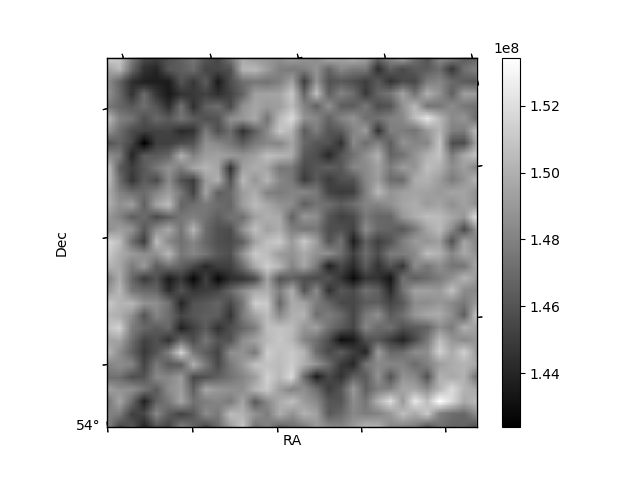
| Quadrant D | 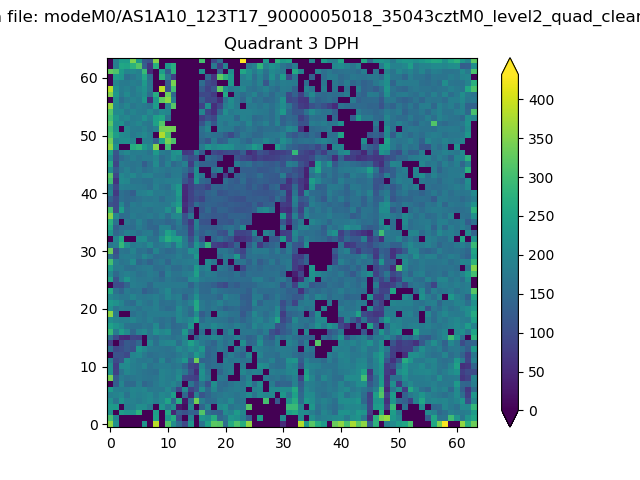 |
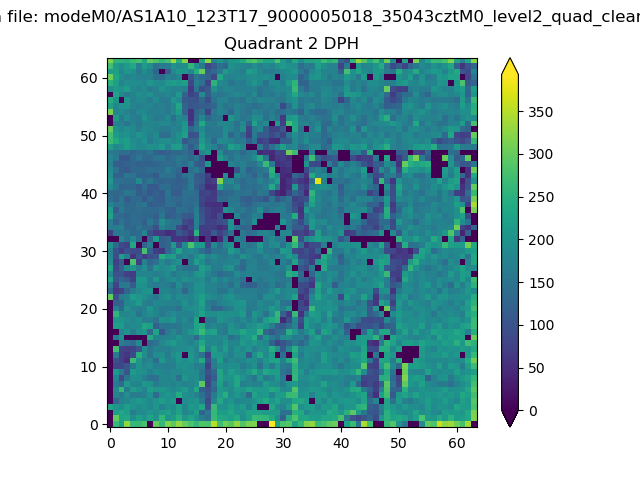 |
Quadrant C |
| Plot type | Count rate plots | Images |
|---|---|---|
| Comparison with Poisson distribution Blue bars denote a histogram of data divided into 1 sec bins. Red curve is a Poisson curve with rate = median count rate of data. |
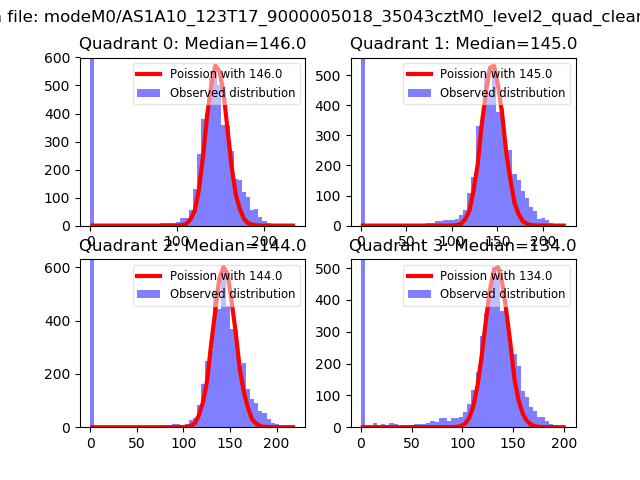 |
 |
| Quadrant-wise count rates Data is divided into 100 sec bins |
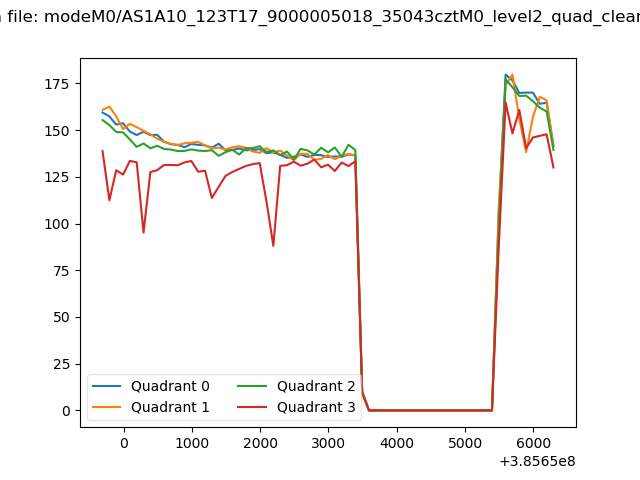 |
|
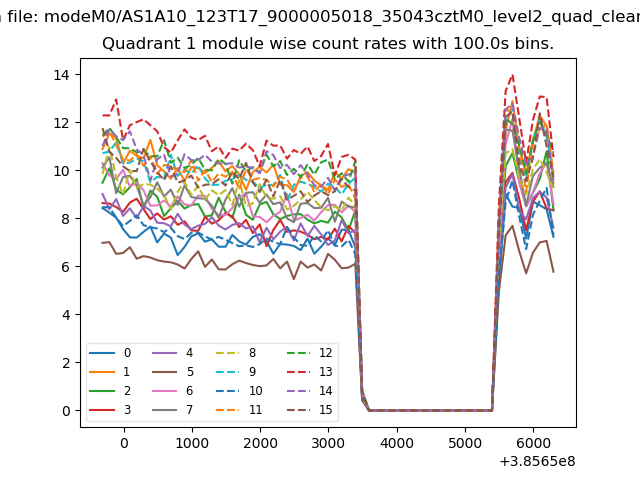
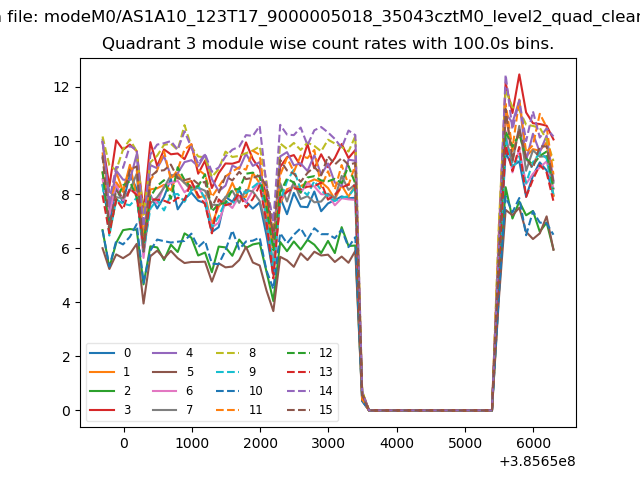
| Module-wise count rates for Quadrant A Data is divided into 100 sec bins |
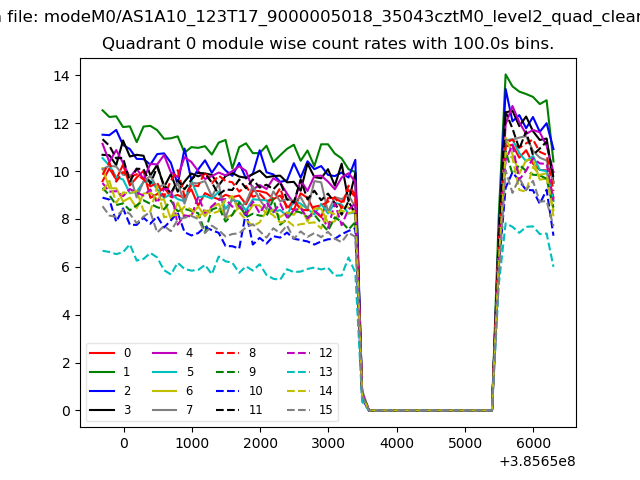 |
 |
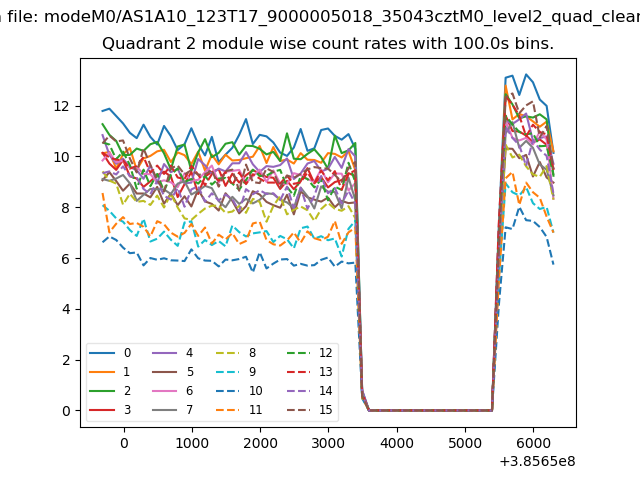
| Module-wise count rates for Quadrant B Data is divided into 100 sec bins |
 |
 |
| Module-wise count rates for Quadrant C Data is divided into 100 sec bins |
 |
 |
| Module-wise count rates for Quadrant D Data is divided into 100 sec bins |
 |
 |
| Parameter | Plot |
|---|---|
| CZT HV Monitor | 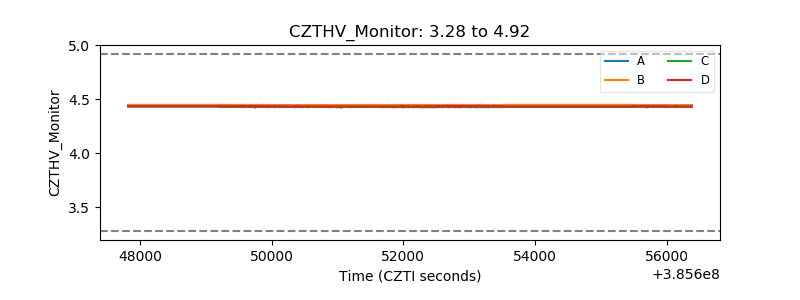 |
| D_VDD | 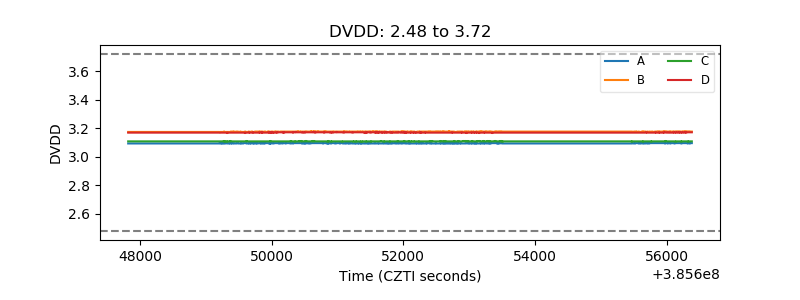 |
| Temperature 1 | 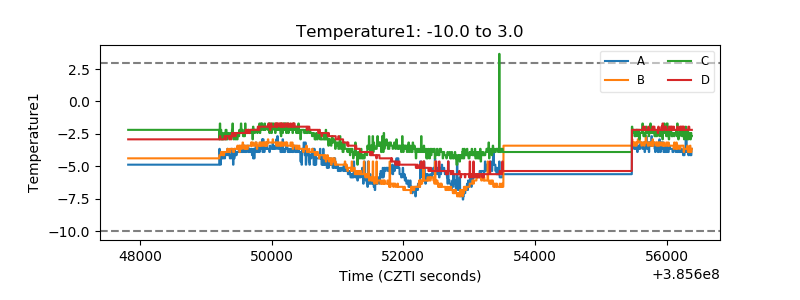 |
| Veto HV Monitor | 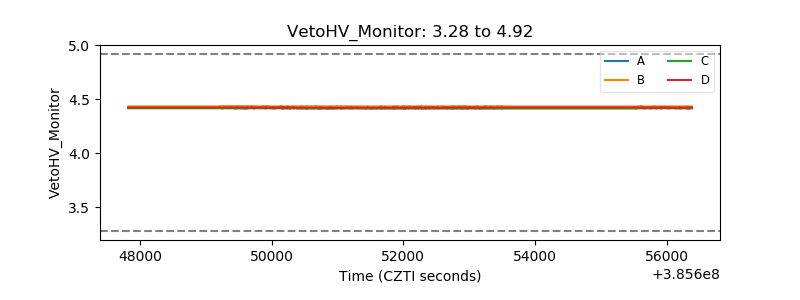 |
| Veto LLD | 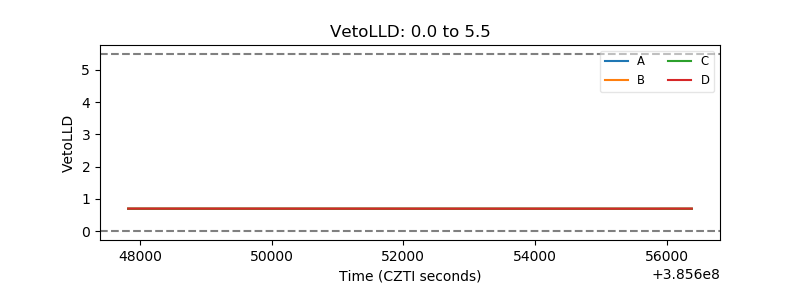 |
| Alpha Counter | 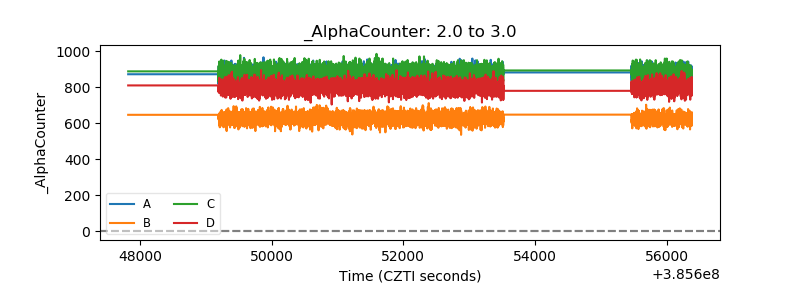 |
| _CPM_Rate | 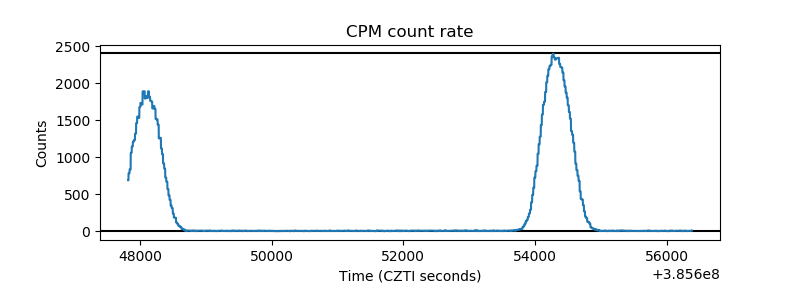 |
| CZT Counter | 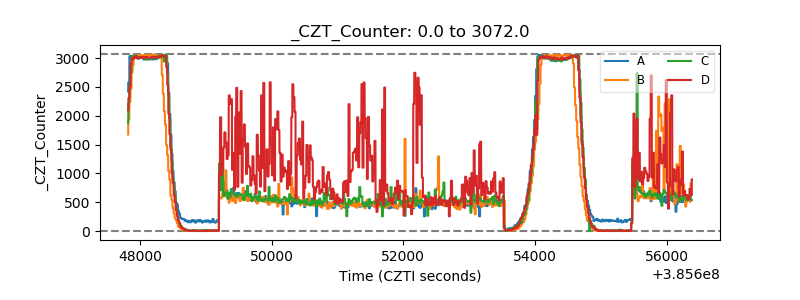 |
| +2.5 Volts monitor | 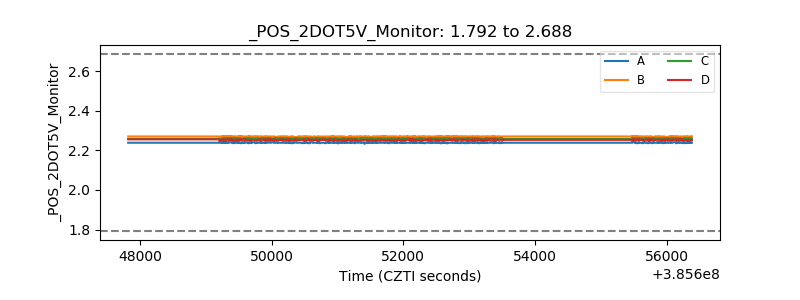 |
| +5 Volts monitor | 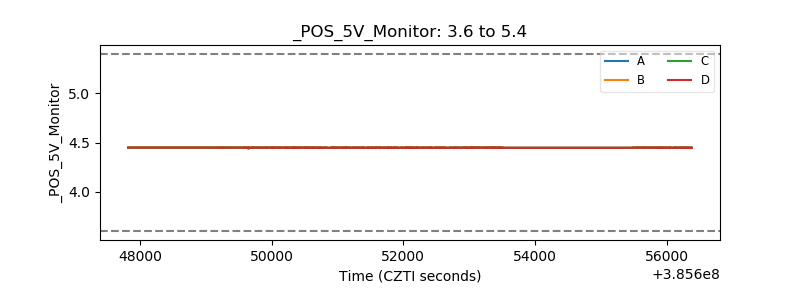 |
| _ROLL_ROT | 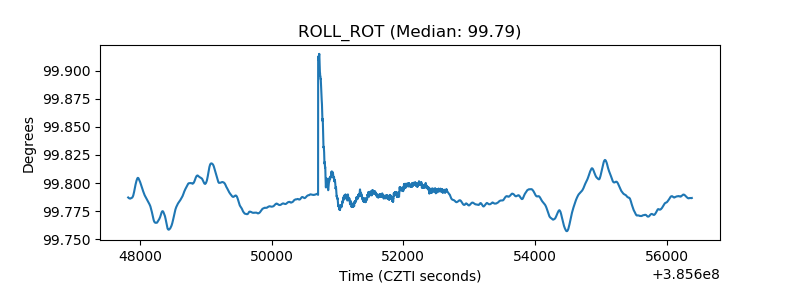 |
| _Roll_DEC | 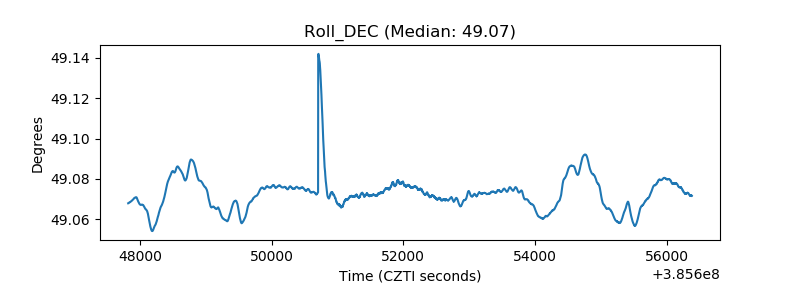 |
| _Roll_RA | 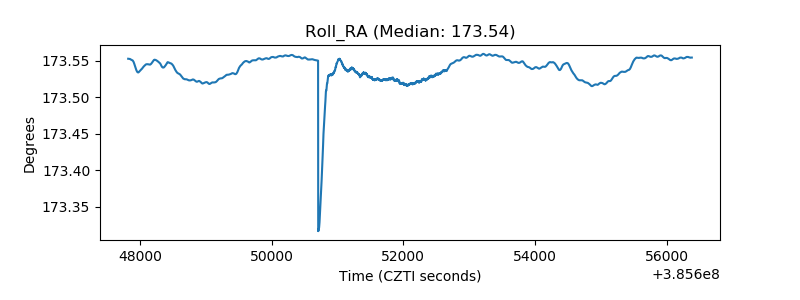 |
| Veto Counter | 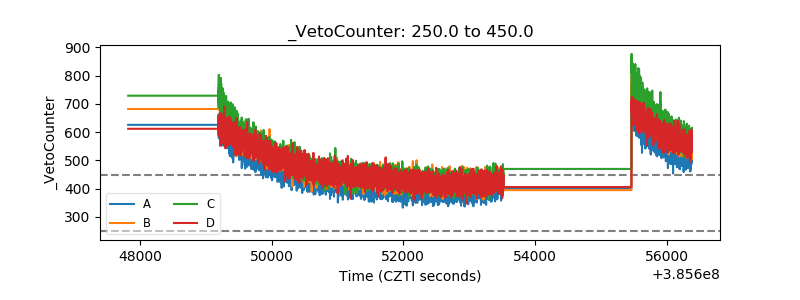 |