| Param | Original file | Final file |
|---|---|---|
| Filename | modeM0/AS1A10_123T17_9000005018_35042cztM0_level2.evt | modeM0/AS1A10_123T17_9000005018_35042cztM0_level2_quad_clean.evt |
| Size (bytes) | 488,666,880 | 88,663,680 |
| Size | 466.0 MB | 84.6 MB |
| Events in quadrant A | 2,920,589 | 585,428 |
| Events in quadrant B | 3,089,568 | 587,427 |
| Events in quadrant C | 3,100,119 | 576,237 |
| Events in quadrant D | 5,297,676 | 532,515 |
| Mode M0 | |||
|---|---|---|---|
| Quadrant | BADHDUFLAG | Total packets | Discarded packets |
| A | 0 | 12315 | 3 |
| B | 0 | 12754 | 2 |
| C | 0 | 12491 | 2 |
| D | 0 | 19807 | 2 |
| Mode SS | |||
|---|---|---|---|
| Quadrant | BADHDUFLAG | Total packets | Discarded packets |
| A | 0 | 118 | 0 |
| B | 0 | 118 | 0 |
| C | 0 | 118 | 0 |
| D | 0 | 118 | 0 |
| Mode M9 | |||
|---|---|---|---|
| Quadrant | BADHDUFLAG | Total packets | Discarded packets |
| A | 0 | 36 | 0 |
| B | 0 | 36 | 0 |
| C | 0 | 36 | 0 |
| D | 0 | 36 | 0 |
| Quadrant | Total seconds | Saturated seconds | Saturation percentage |
|---|---|---|---|
| A | 5775 | 12 | 0.207792% |
| B | 5775 | 42 | 0.727273% |
| C | 5775 | 24 | 0.415584% |
| D | 5775 | 324 | 5.610390% |
Noise dominated data is calculated using 1-second bins in cleaned event files. If a bin has >2000 counts, and if more than 50% of those come from <1% of pixels, then it is considered to be noise-dominated and hence unusable.
| Quadrant | # 1 sec bins | Bins with >0 counts | Bins with >2000 counts | High rate bins dominated by noise | Noise dominated (total time) | Noise dominated (detector-on time) | Marked lightcurve |
|---|---|---|---|---|---|---|---|
| A | 9300 | 5777 | 1 | 1 | 0.01% | 0.02% | 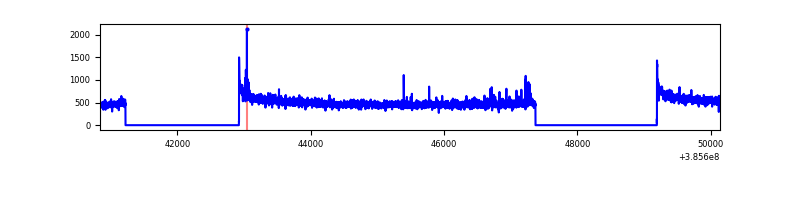 |
| B | 9300 | 5777 | 31 | 31 | 0.33% | 0.54% | 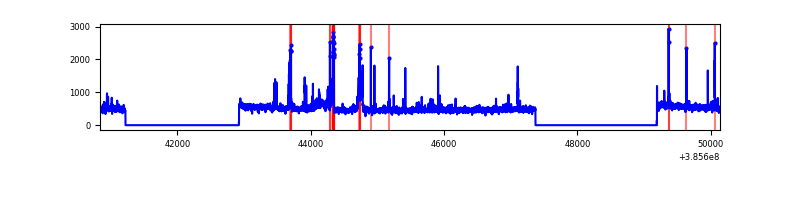 |
| C | 9300 | 5777 | 16 | 16 | 0.17% | 0.28% | 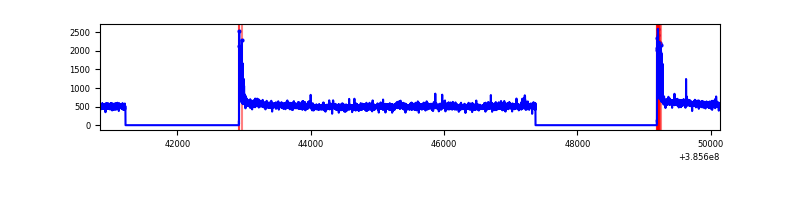 |
| D | 9300 | 5777 | 283 | 283 | 3.04% | 4.90% | 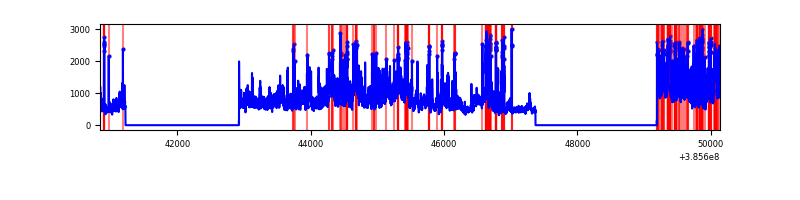 |
Top three noisy pixels from each quadrant. If the there are fewer than three noisy pixels in the level2.evt file, extra rows are filled as -1
| Pixel properties | Quadrant properties | ||||||
|---|---|---|---|---|---|---|---|
| Quadrant | DetID | PixID | Counts | Sigma | Mean | Median | Sigma |
| A | 10 | 83 | 77765 | 537.75 | 718 | 706 | 143.3 |
| A | 10 | 255 | 33375 | 227.98 | 718 | 706 | 143.3 |
| A | 15 | 169 | 18236 | 122.33 | 718 | 706 | 143.3 |
| B | 5 | 200 | 157165 | 1163.83 | 706 | 690 | 134.4 |
| B | 0 | 190 | 41652 | 304.67 | 706 | 690 | 134.4 |
| B | 5 | 172 | 31186 | 226.82 | 706 | 690 | 134.4 |
| C | 15 | 214 | 241516 | 1512.63 | 694 | 699 | 159.2 |
| C | 0 | 10 | 84210 | 524.55 | 694 | 699 | 159.2 |
| C | 14 | 67 | 50309 | 311.61 | 694 | 699 | 159.2 |
| D | 8 | 195 | 1012503 | 6080.9 | 681 | 662 | 166.4 |
| D | 14 | 52 | 510187 | 3062.11 | 681 | 662 | 166.4 |
| D | 13 | 249 | 337589 | 2024.84 | 681 | 662 | 166.4 |
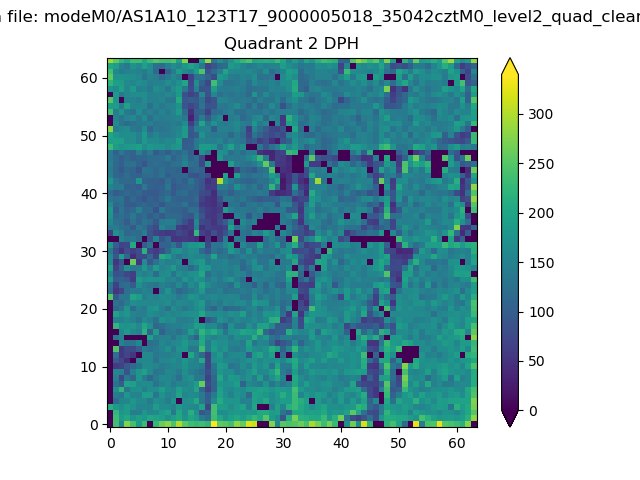
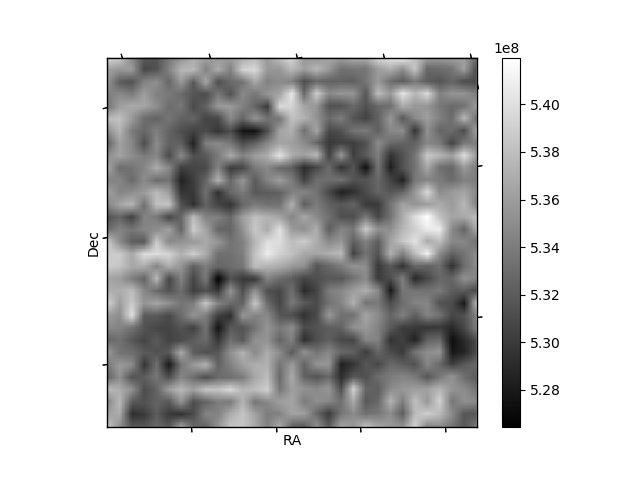
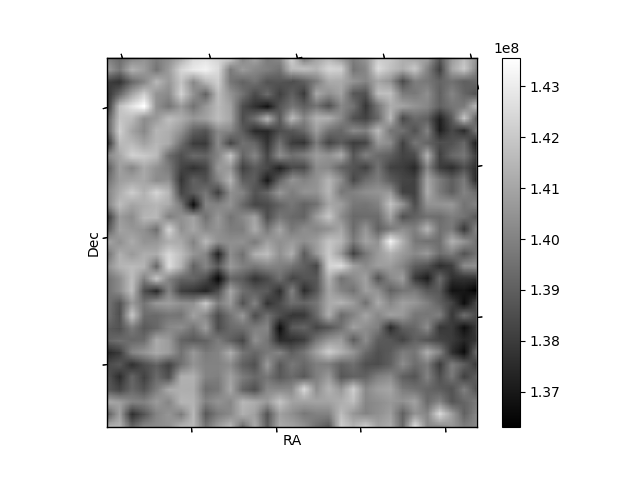
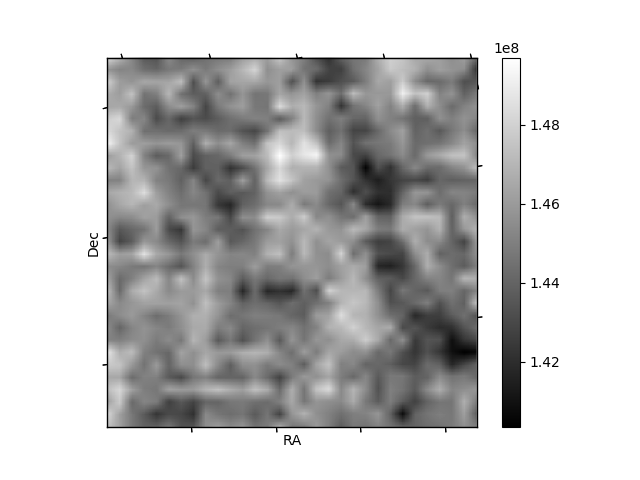
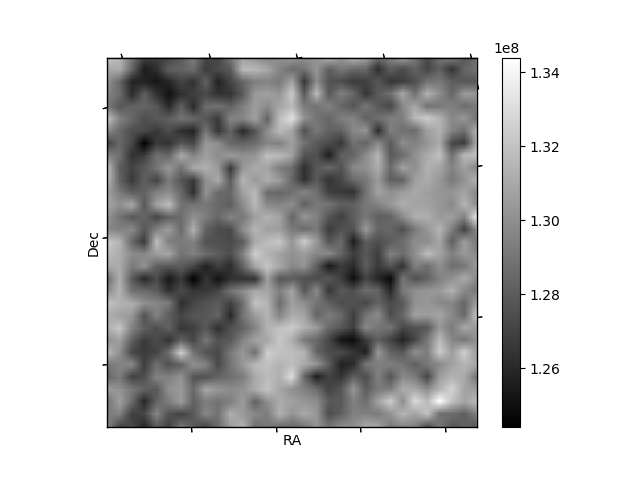
Histogram calculated using DETX and DETY for each event in the final _common_clean file
| Quadrant A | 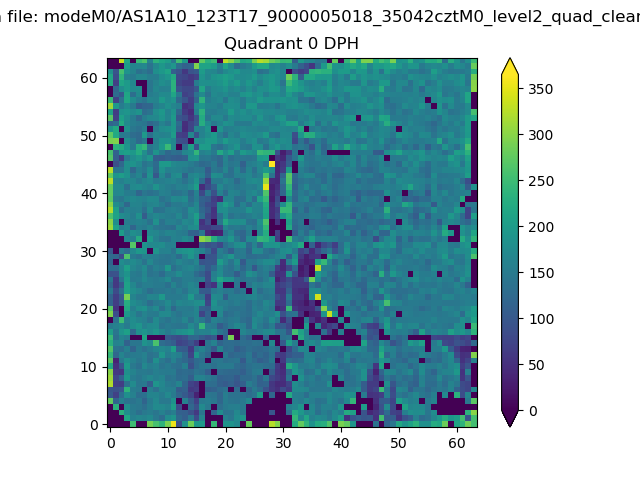 |
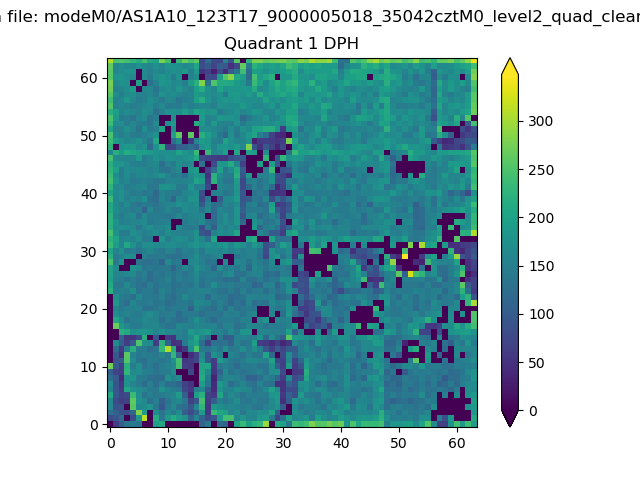 |
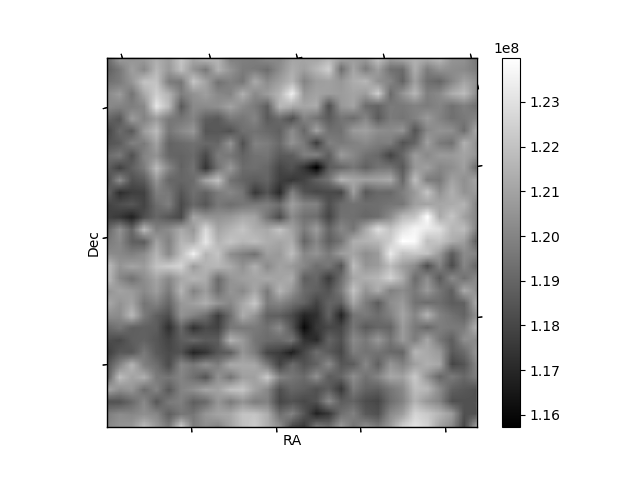
Quadrant B |
|---|---|---|---|
| Quadrant D | 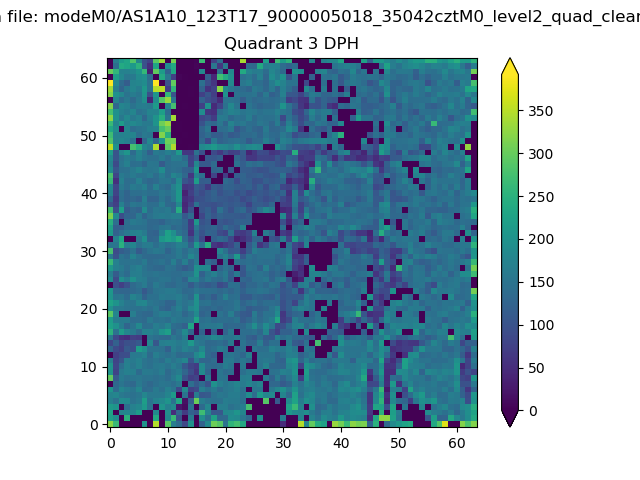 |
 |
Quadrant C |
| Plot type | Count rate plots | Images |
|---|---|---|
| Comparison with Poisson distribution Blue bars denote a histogram of data divided into 1 sec bins. Red curve is a Poisson curve with rate = median count rate of data. |
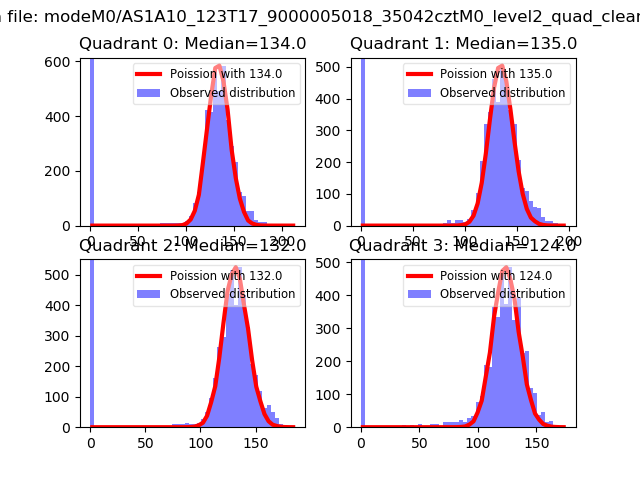 |
 |
| Quadrant-wise count rates Data is divided into 100 sec bins |
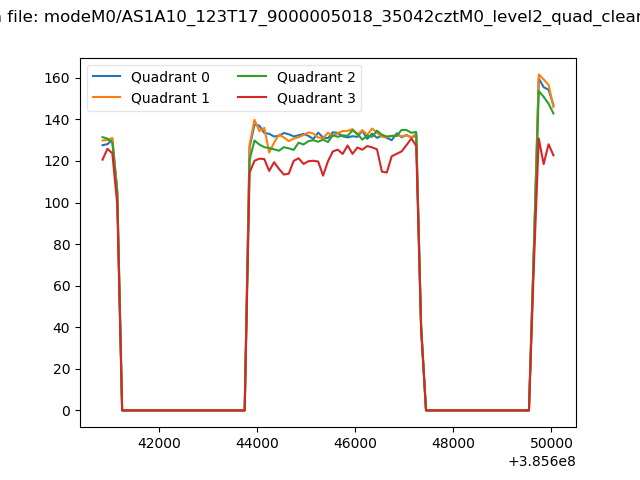 |
|
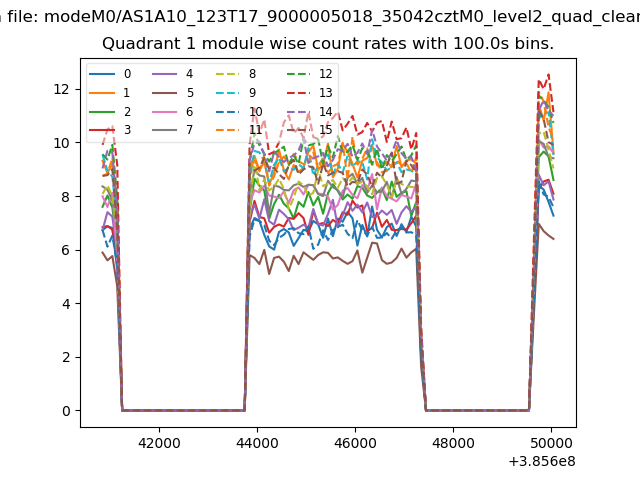
| Module-wise count rates for Quadrant A Data is divided into 100 sec bins |
 |
 |
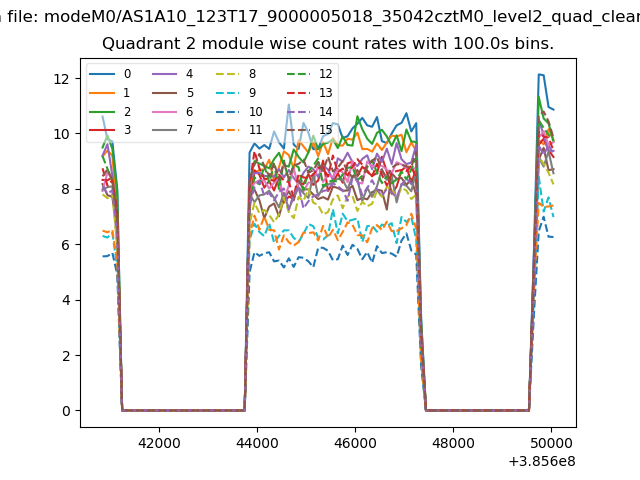
| Module-wise count rates for Quadrant B Data is divided into 100 sec bins |
 |
 |
| Module-wise count rates for Quadrant C Data is divided into 100 sec bins |
 |
 |
| Module-wise count rates for Quadrant D Data is divided into 100 sec bins |
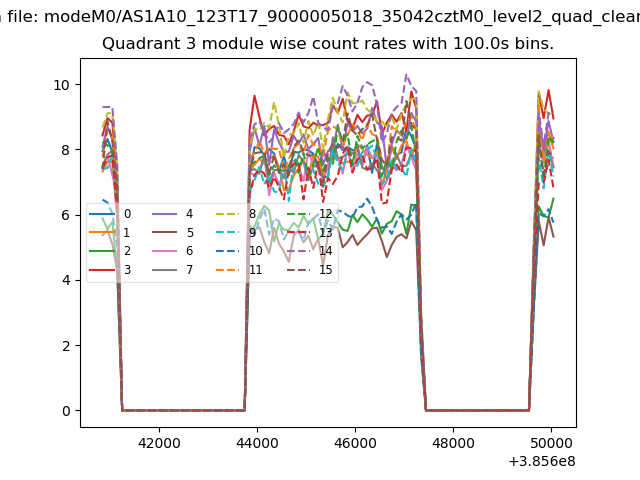 |
 |
| Parameter | Plot |
|---|---|
| CZT HV Monitor | 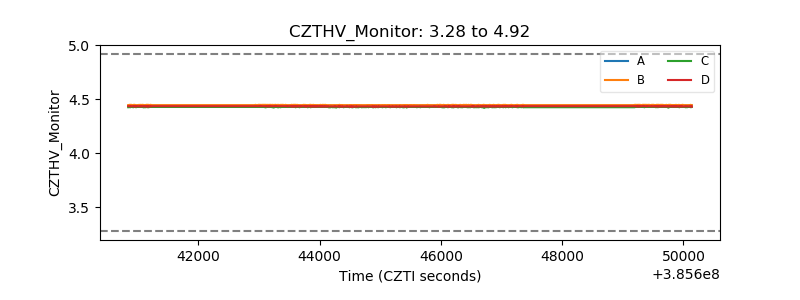 |
| D_VDD | 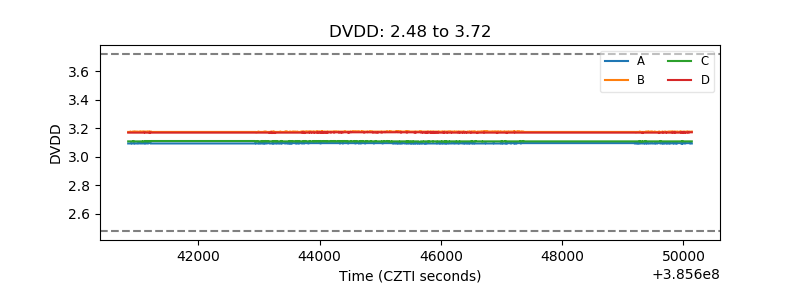 |
| Temperature 1 |  |
| Veto HV Monitor | 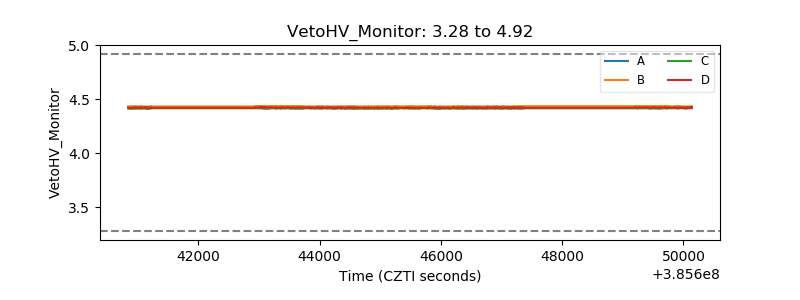 |
| Veto LLD | 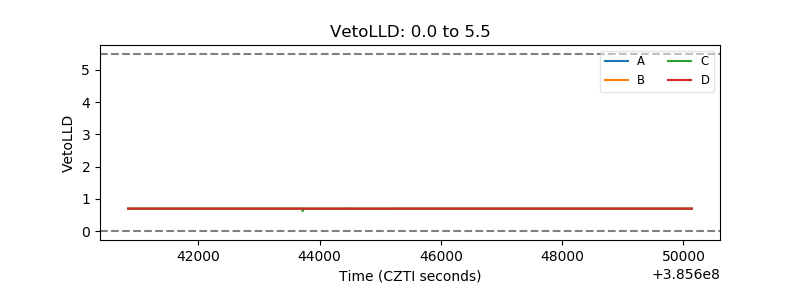 |
| Alpha Counter | 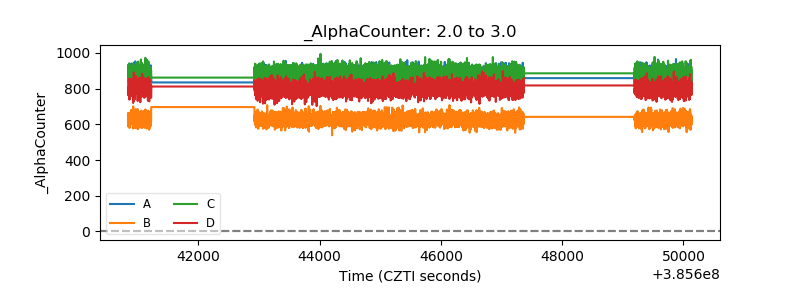 |
| _CPM_Rate | 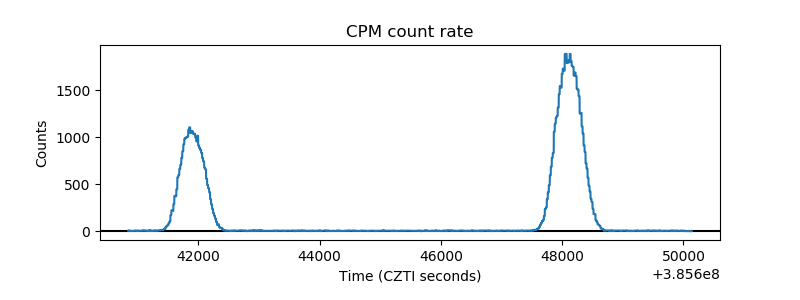 |
| CZT Counter | 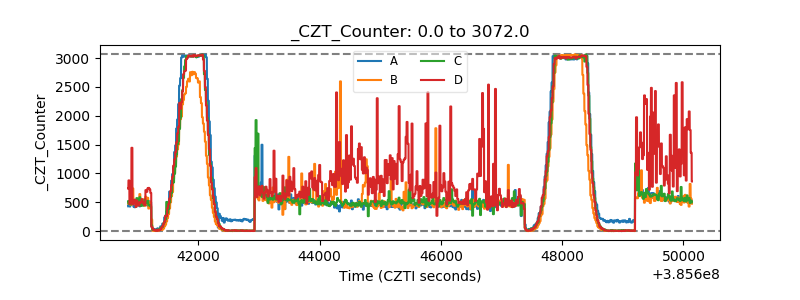 |
| +2.5 Volts monitor | 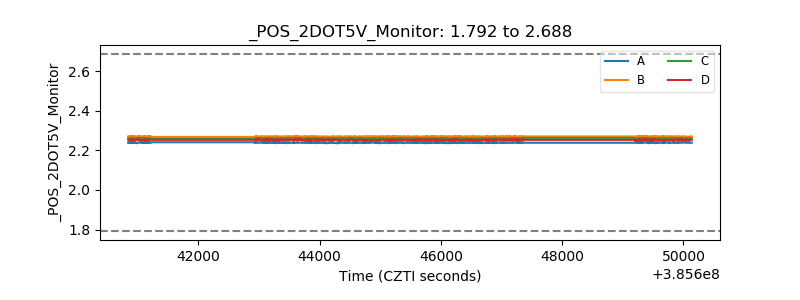 |
| +5 Volts monitor | 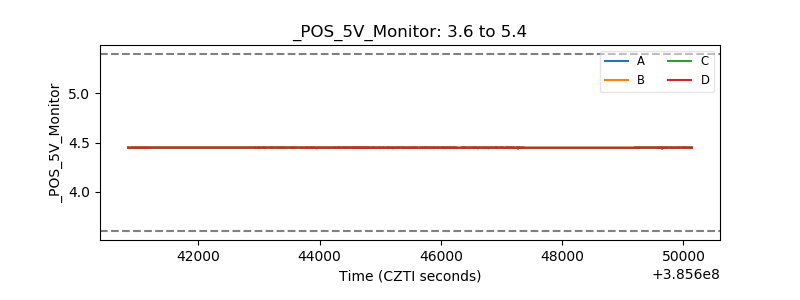 |
| _ROLL_ROT | 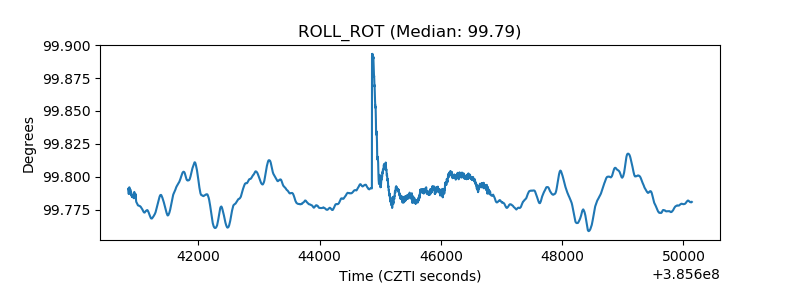 |
| _Roll_DEC | 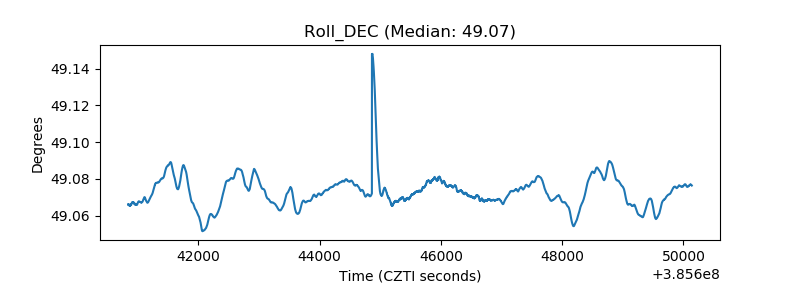 |
| _Roll_RA | 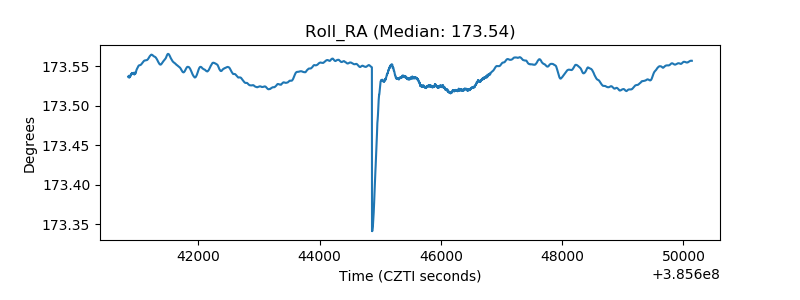 |
| Veto Counter | 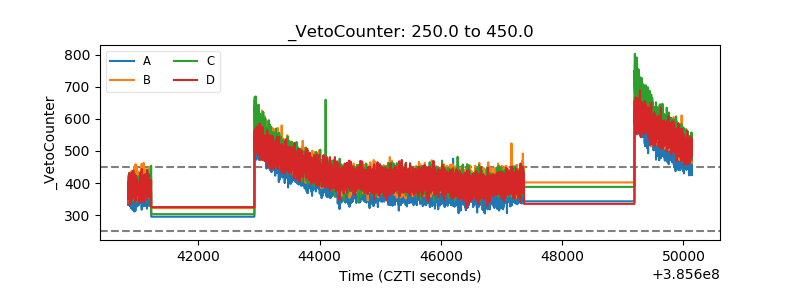 |