| Param | Original file | Final file |
|---|---|---|
| Filename | modeM0/AS1A10_123T17_9000005018_35040cztM0_level2.evt | modeM0/AS1A10_123T17_9000005018_35040cztM0_level2_quad_clean.evt |
| Size (bytes) | 1,924,004,160 | 298,889,280 |
| Size | 1.8 GB | 285.0 MB |
| Events in quadrant A | 11,693,576 | 1,872,334 |
| Events in quadrant B | 12,850,849 | 1,892,565 |
| Events in quadrant C | 12,488,022 | 1,858,456 |
| Events in quadrant D | 19,555,187 | 1,714,111 |
| Mode M0 | |||
|---|---|---|---|
| Quadrant | BADHDUFLAG | Total packets | Discarded packets |
| A | 0 | 50812 | 6 |
| B | 0 | 54020 | 5 |
| C | 0 | 51473 | 5 |
| D | 0 | 75416 | 5 |
| Mode SS | |||
|---|---|---|---|
| Quadrant | BADHDUFLAG | Total packets | Discarded packets |
| A | 0 | 508 | 0 |
| B | 0 | 508 | 0 |
| C | 0 | 508 | 0 |
| D | 0 | 508 | 0 |
| Mode M9 | |||
|---|---|---|---|
| Quadrant | BADHDUFLAG | Total packets | Discarded packets |
| A | 0 | 74 | 0 |
| B | 0 | 74 | 0 |
| C | 0 | 74 | 0 |
| D | 0 | 74 | 0 |
| Quadrant | Total seconds | Saturated seconds | Saturation percentage |
|---|---|---|---|
| A | 24937 | 39 | 0.156394% |
| B | 24937 | 239 | 0.958415% |
| C | 24937 | 54 | 0.216546% |
| D | 24937 | 919 | 3.685287% |
Noise dominated data is calculated using 1-second bins in cleaned event files. If a bin has >2000 counts, and if more than 50% of those come from <1% of pixels, then it is considered to be noise-dominated and hence unusable.
| Quadrant | # 1 sec bins | Bins with >0 counts | Bins with >2000 counts | High rate bins dominated by noise | Noise dominated (total time) | Noise dominated (detector-on time) | Marked lightcurve |
|---|---|---|---|---|---|---|---|
| A | 32284 | 24939 | 8 | 8 | 0.02% | 0.03% | 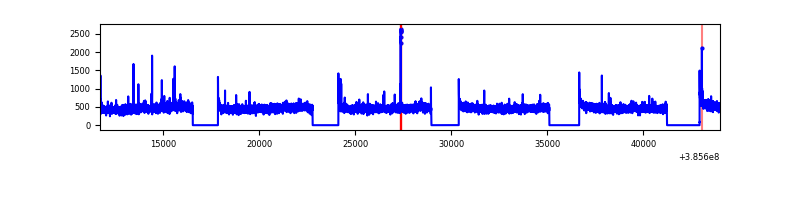 |
| B | 32284 | 24938 | 173 | 173 | 0.54% | 0.69% | 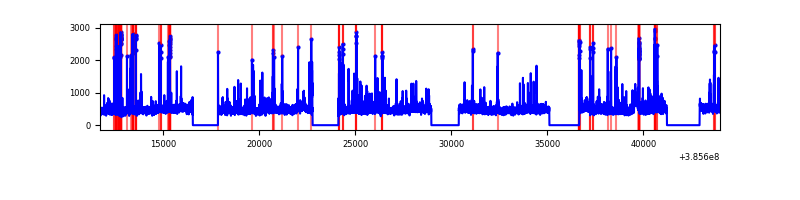 |
| C | 32284 | 24939 | 36 | 36 | 0.11% | 0.14% | 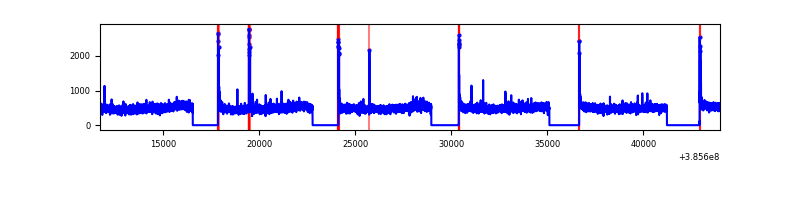 |
| D | 32284 | 24939 | 921 | 921 | 2.85% | 3.69% | 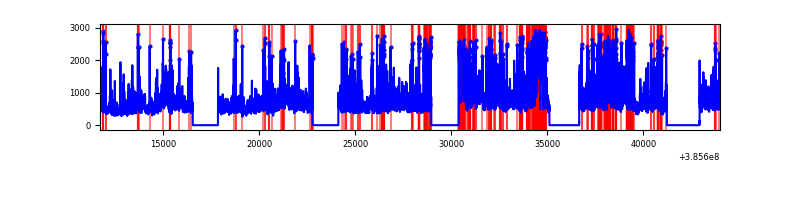 |
Top three noisy pixels from each quadrant. If the there are fewer than three noisy pixels in the level2.evt file, extra rows are filled as -1
| Pixel properties | Quadrant properties | ||||||
|---|---|---|---|---|---|---|---|
| Quadrant | DetID | PixID | Counts | Sigma | Mean | Median | Sigma |
| A | 10 | 83 | 244316 | 413.54 | 2926 | 2867 | 583.9 |
| A | 13 | 6 | 41672 | 66.46 | 2926 | 2867 | 583.9 |
| A | 13 | 254 | 35554 | 55.98 | 2926 | 2867 | 583.9 |
| B | 5 | 200 | 535173 | 965.01 | 2893 | 2812 | 551.7 |
| B | 5 | 172 | 363122 | 653.13 | 2893 | 2812 | 551.7 |
| B | 0 | 190 | 182125 | 325.04 | 2893 | 2812 | 551.7 |
| C | 15 | 214 | 1022875 | 1559.54 | 2847 | 2866 | 654.0 |
| C | 0 | 10 | 139743 | 209.28 | 2847 | 2866 | 654.0 |
| C | 14 | 67 | 112616 | 167.8 | 2847 | 2866 | 654.0 |
| D | 8 | 195 | 3468597 | 5077.04 | 2809 | 2730 | 682.7 |
| D | 14 | 52 | 2430989 | 3557.08 | 2809 | 2730 | 682.7 |
| D | 13 | 249 | 1104478 | 1613.92 | 2809 | 2730 | 682.7 |
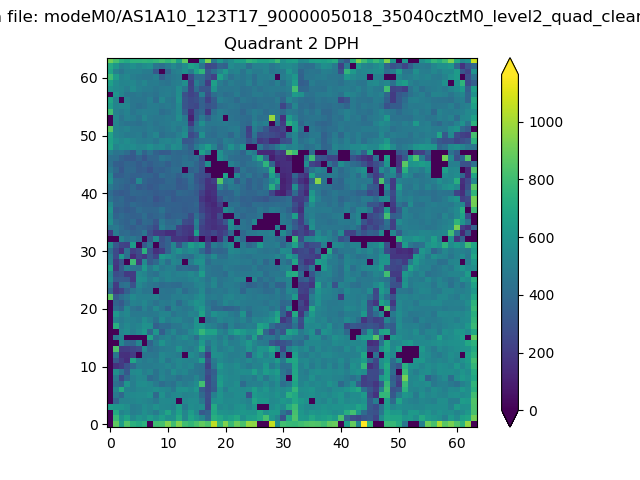
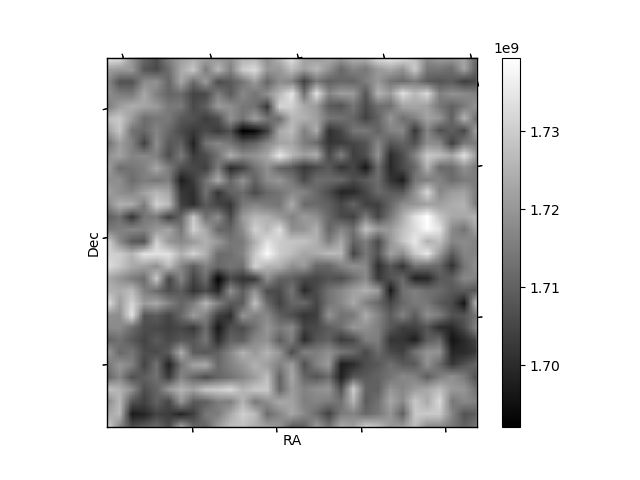
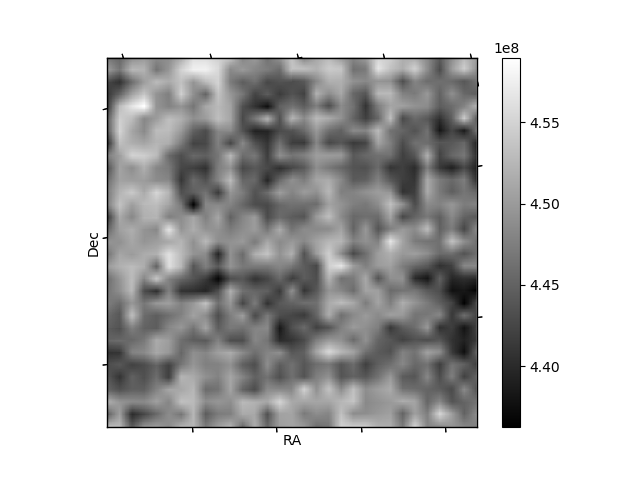
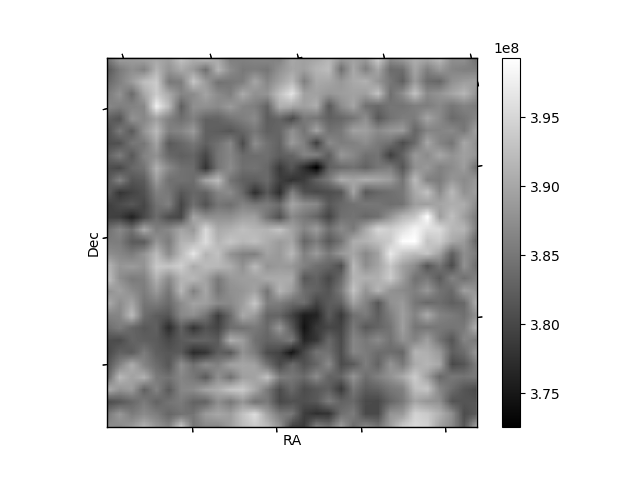
Histogram calculated using DETX and DETY for each event in the final _common_clean file
| Quadrant A | 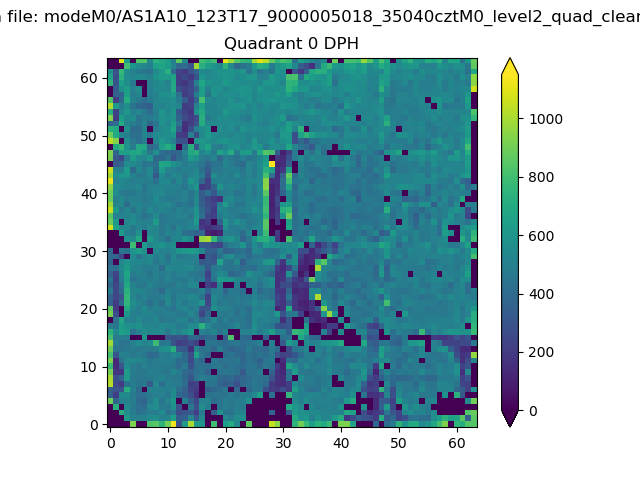 |
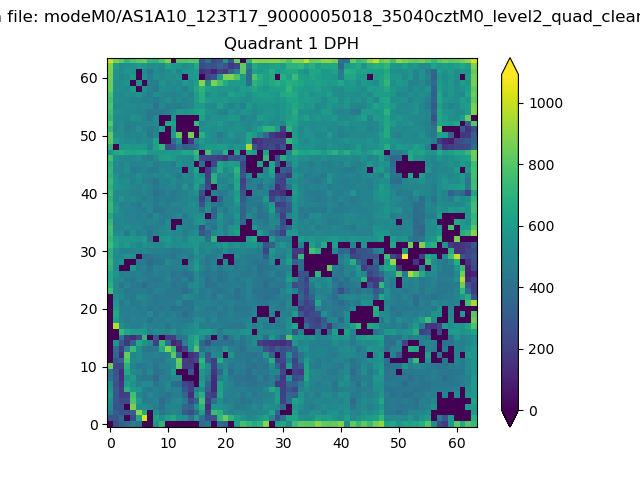 |
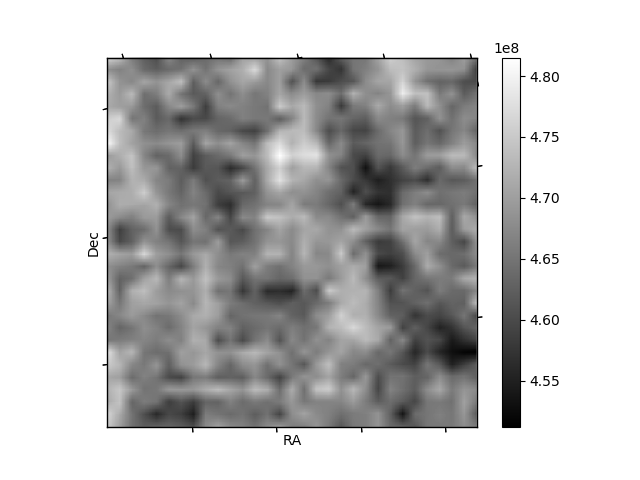
Quadrant B |
|---|---|---|---|
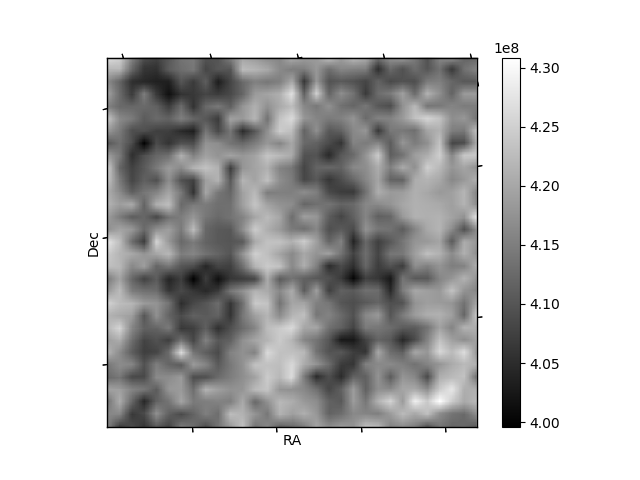
| Quadrant D | 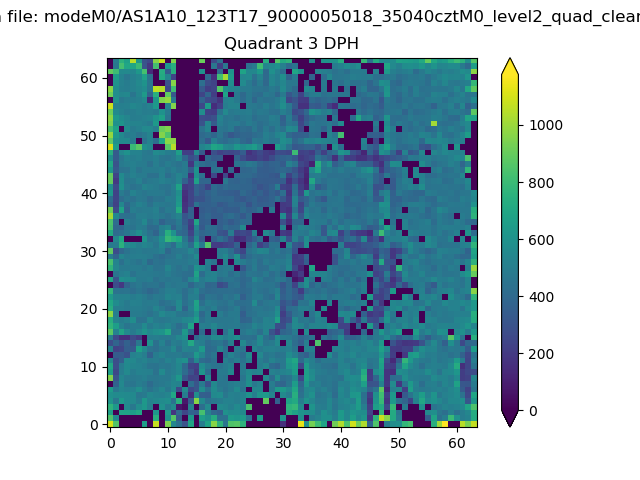 |
 |
Quadrant C |
| Plot type | Count rate plots | Images |
|---|---|---|
| Comparison with Poisson distribution Blue bars denote a histogram of data divided into 1 sec bins. Red curve is a Poisson curve with rate = median count rate of data. |
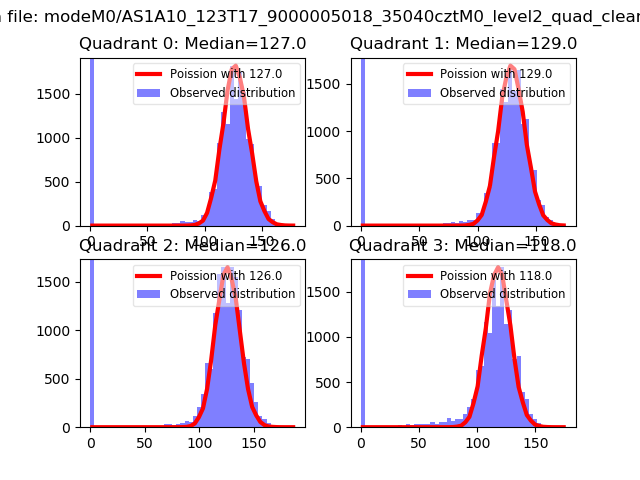 |
 |
| Quadrant-wise count rates Data is divided into 100 sec bins |
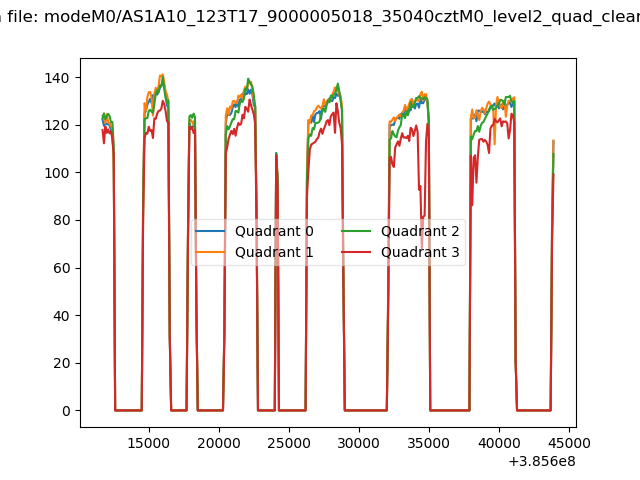 |
|
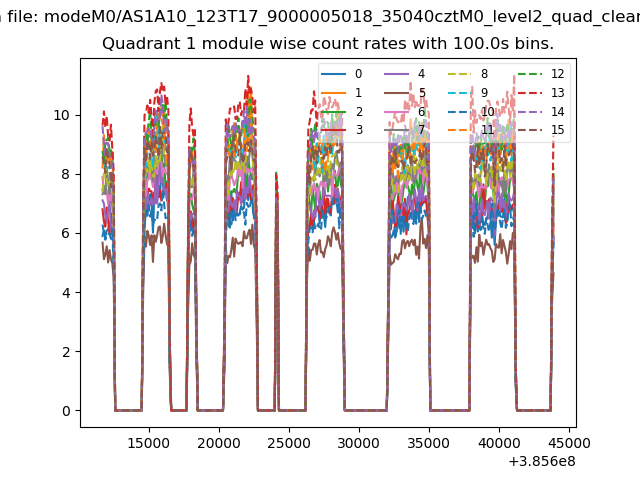
| Module-wise count rates for Quadrant A Data is divided into 100 sec bins |
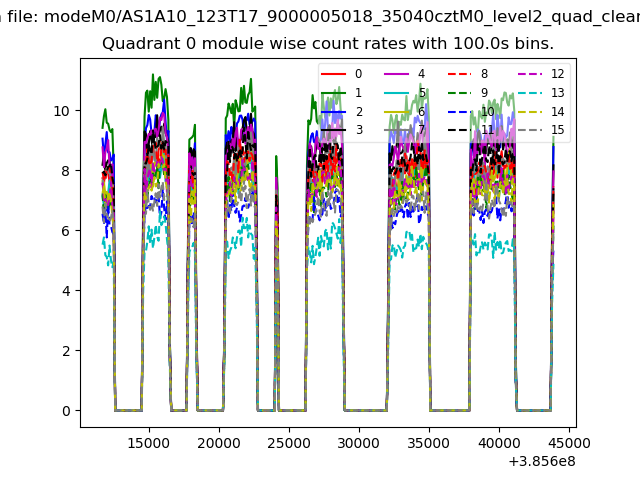 |
 |
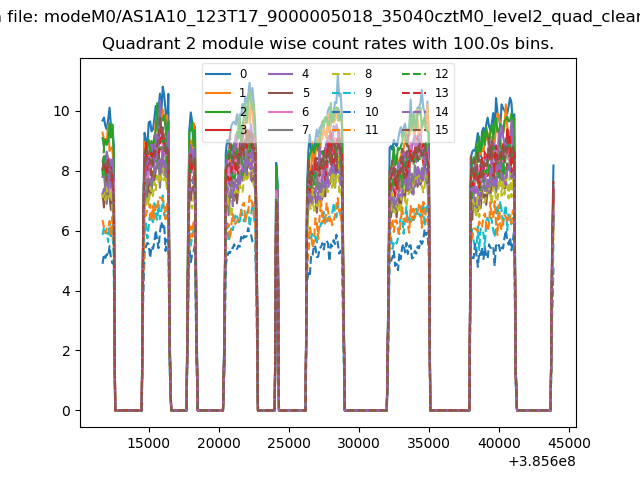
| Module-wise count rates for Quadrant B Data is divided into 100 sec bins |
 |
 |
| Module-wise count rates for Quadrant C Data is divided into 100 sec bins |
 |
 |
| Module-wise count rates for Quadrant D Data is divided into 100 sec bins |
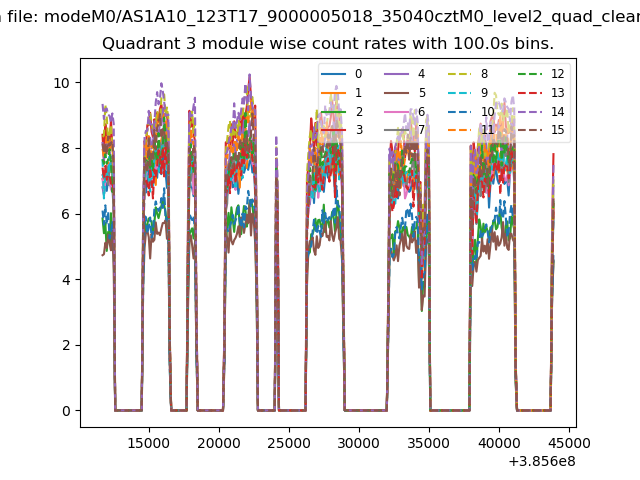 |
 |
| Parameter | Plot |
|---|---|
| CZT HV Monitor | 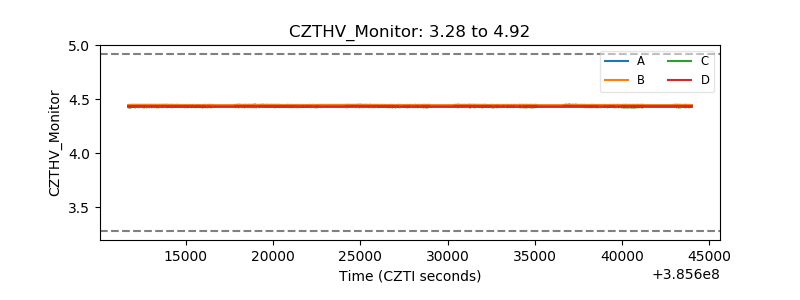 |
| D_VDD | 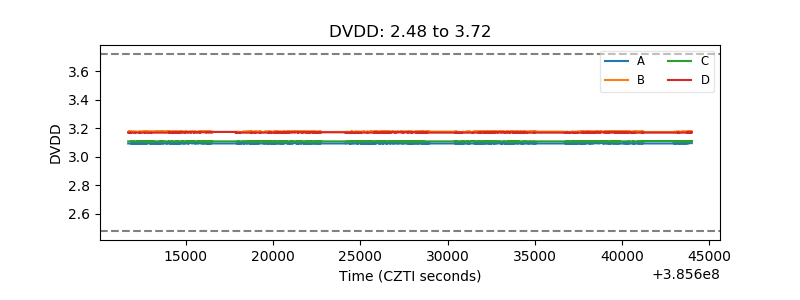 |
| Temperature 1 | 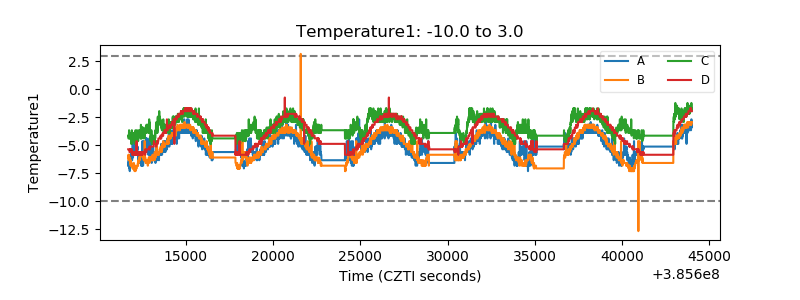 |
| Veto HV Monitor | 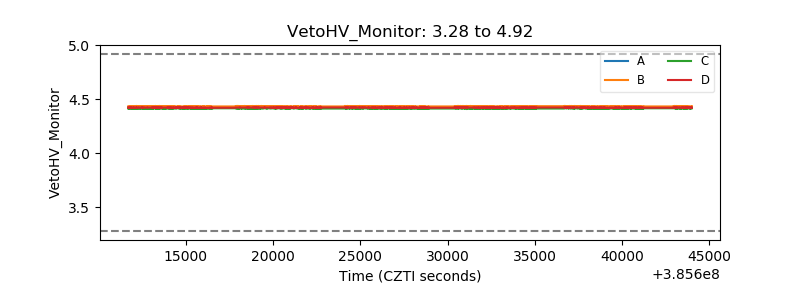 |
| Veto LLD | 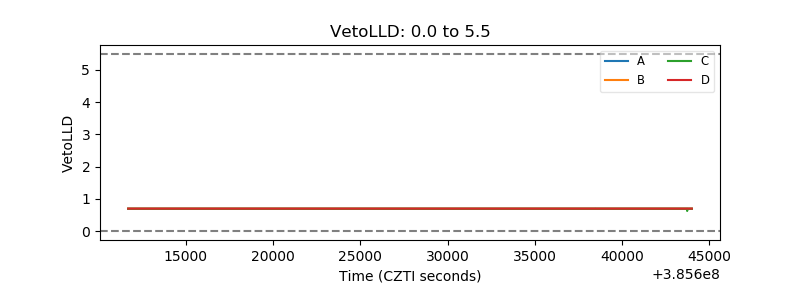 |
| Alpha Counter | 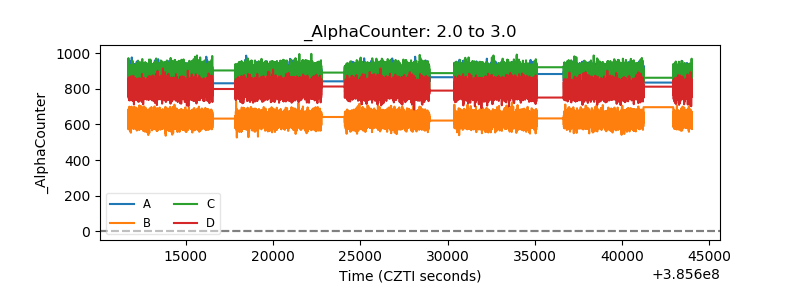 |
| _CPM_Rate | 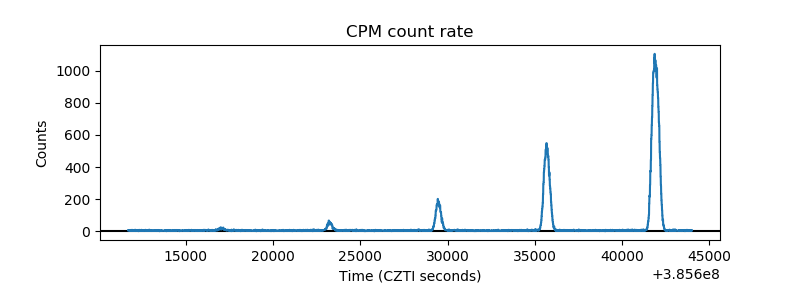 |
| CZT Counter | 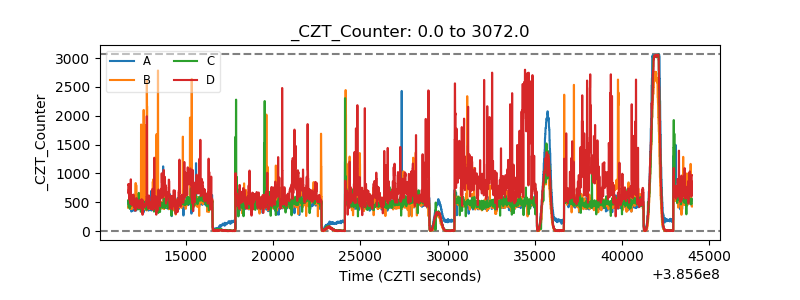 |
| +2.5 Volts monitor | 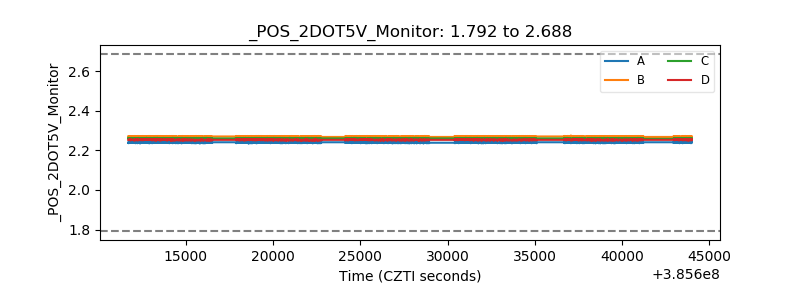 |
| +5 Volts monitor | 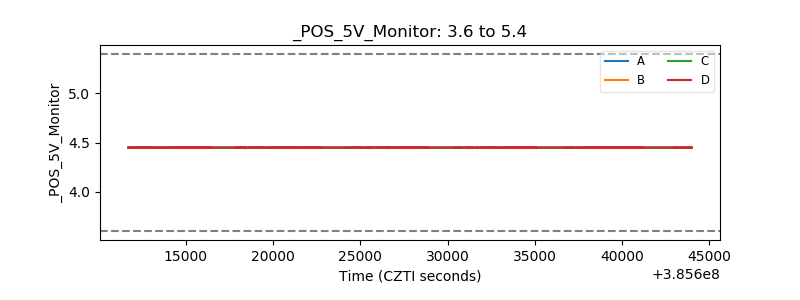 |
| _ROLL_ROT | 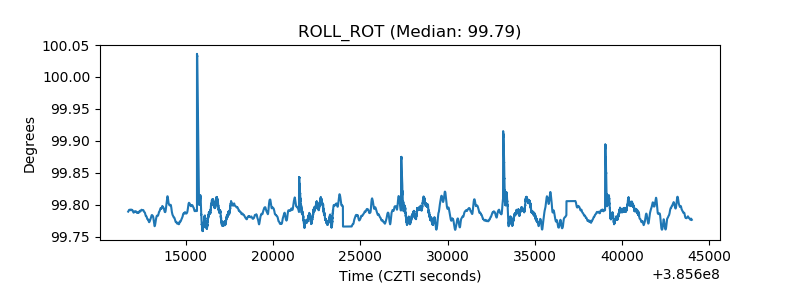 |
| _Roll_DEC | 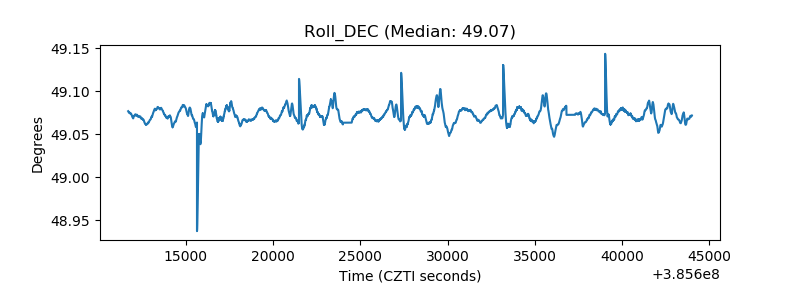 |
| _Roll_RA | 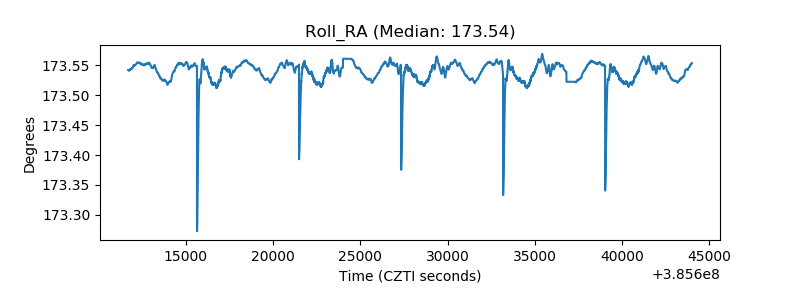 |
| Veto Counter | 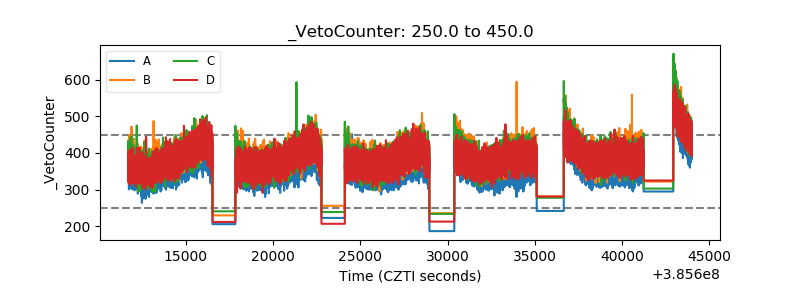 |