| Param | Original file | Final file |
|---|---|---|
| Filename | modeM0/AS1A10_123T17_9000005018_35035cztM0_level2.evt | modeM0/AS1A10_123T17_9000005018_35035cztM0_level2_quad_clean.evt |
| Size (bytes) | 95,849,280 | 24,013,440 |
| Size | 91.4 MB | 22.9 MB |
| Events in quadrant A | 601,942 | 157,507 |
| Events in quadrant B | 679,646 | 160,168 |
| Events in quadrant C | 670,963 | 160,228 |
| Events in quadrant D | 860,012 | 152,514 |
| Mode M0 | |||
|---|---|---|---|
| Quadrant | BADHDUFLAG | Total packets | Discarded packets |
| A | 0 | 2635 | 2 |
| B | 0 | 2932 | 1 |
| C | 0 | 2774 | 1 |
| D | 0 | 3438 | 1 |
| Mode SS | |||
|---|---|---|---|
| Quadrant | BADHDUFLAG | Total packets | Discarded packets |
| A | 0 | 28 | 0 |
| B | 0 | 28 | 0 |
| C | 0 | 28 | 0 |
| D | 0 | 28 | 0 |
| Mode M9 | |||
|---|---|---|---|
| Quadrant | BADHDUFLAG | Total packets | Discarded packets |
| A | 0 | 13 | 0 |
| B | 0 | 13 | 0 |
| C | 0 | 13 | 0 |
| D | 0 | 13 | 0 |
| Quadrant | Total seconds | Saturated seconds | Saturation percentage |
|---|---|---|---|
| A | 1282 | 1 | 0.078003% |
| B | 1282 | 9 | 0.702028% |
| C | 1282 | 6 | 0.468019% |
| D | 1282 | 18 | 1.404056% |
Noise dominated data is calculated using 1-second bins in cleaned event files. If a bin has >2000 counts, and if more than 50% of those come from <1% of pixels, then it is considered to be noise-dominated and hence unusable.
| Quadrant | # 1 sec bins | Bins with >0 counts | Bins with >2000 counts | High rate bins dominated by noise | Noise dominated (total time) | Noise dominated (detector-on time) | Marked lightcurve |
|---|---|---|---|---|---|---|---|
| A | 2625 | 1281 | 0 | 0 | 0.00% | 0.00% | 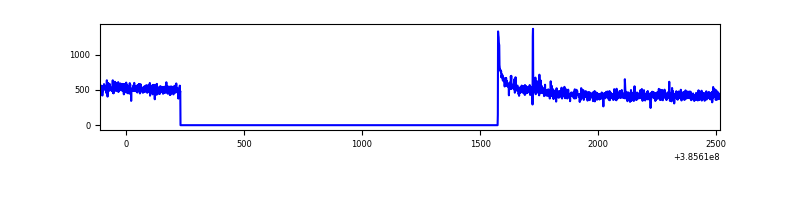 |
| B | 2625 | 1281 | 3 | 3 | 0.11% | 0.23% | 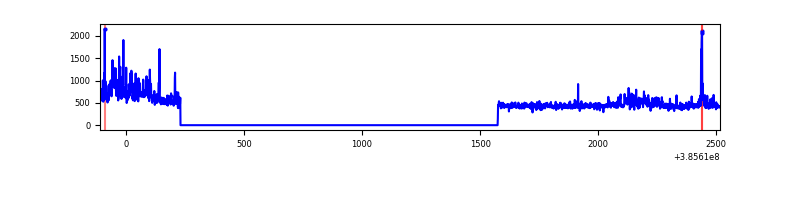 |
| C | 2625 | 1281 | 6 | 6 | 0.23% | 0.47% | 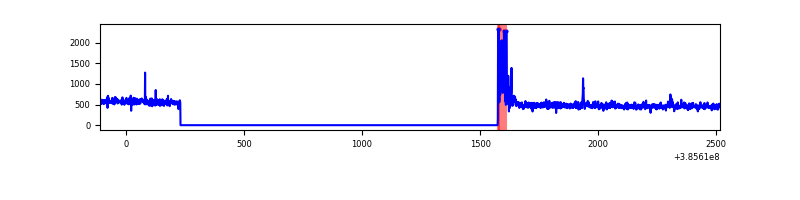 |
| D | 2625 | 1282 | 15 | 15 | 0.57% | 1.17% | 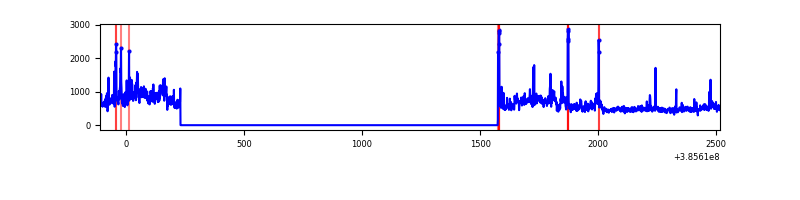 |
Top three noisy pixels from each quadrant. If the there are fewer than three noisy pixels in the level2.evt file, extra rows are filled as -1
| Pixel properties | Quadrant properties | ||||||
|---|---|---|---|---|---|---|---|
| Quadrant | DetID | PixID | Counts | Sigma | Mean | Median | Sigma |
| A | 10 | 83 | 32225 | 1016.05 | 144 | 140 | 31.6 |
| A | 13 | 6 | 4423 | 135.63 | 144 | 140 | 31.6 |
| A | 10 | 255 | 2988 | 90.19 | 144 | 140 | 31.6 |
| B | 0 | 197 | 30387 | 1000.82 | 145 | 142 | 30.2 |
| B | 5 | 172 | 29601 | 974.81 | 145 | 142 | 30.2 |
| B | 0 | 199 | 20592 | 676.7 | 145 | 142 | 30.2 |
| C | 15 | 214 | 57516 | 1625.35 | 144 | 145 | 35.3 |
| C | 0 | 10 | 37703 | 1064.04 | 144 | 145 | 35.3 |
| C | 15 | 159 | 6240 | 172.67 | 144 | 145 | 35.3 |
| D | 8 | 195 | 206944 | 5734.46 | 141 | 137 | 36.1 |
| D | 1 | 47 | 29966 | 827.12 | 141 | 137 | 36.1 |
| D | 5 | 223 | 28152 | 776.82 | 141 | 137 | 36.1 |
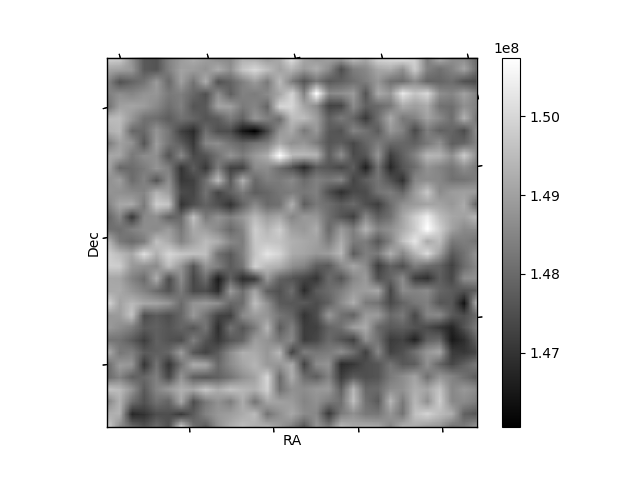
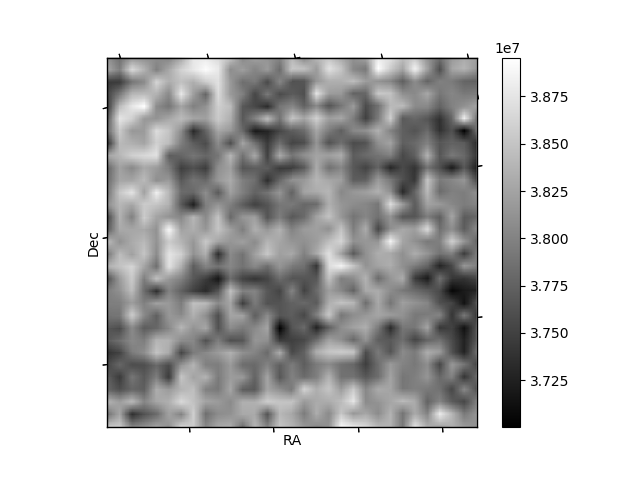
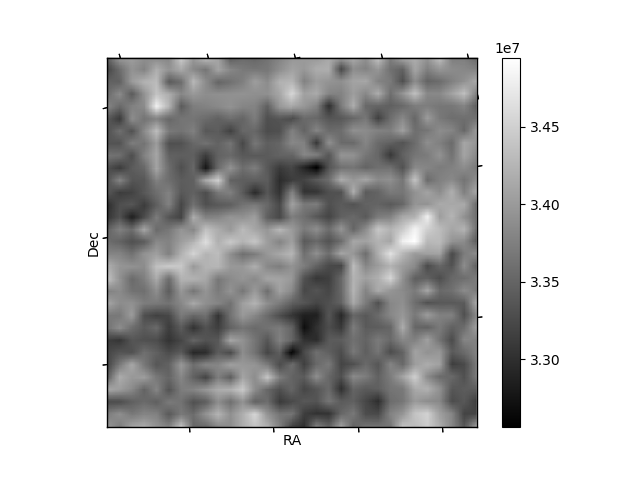
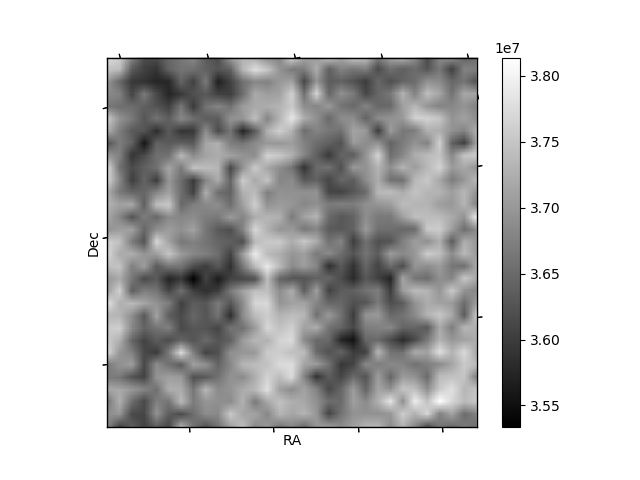
Histogram calculated using DETX and DETY for each event in the final _common_clean file
| Quadrant A | 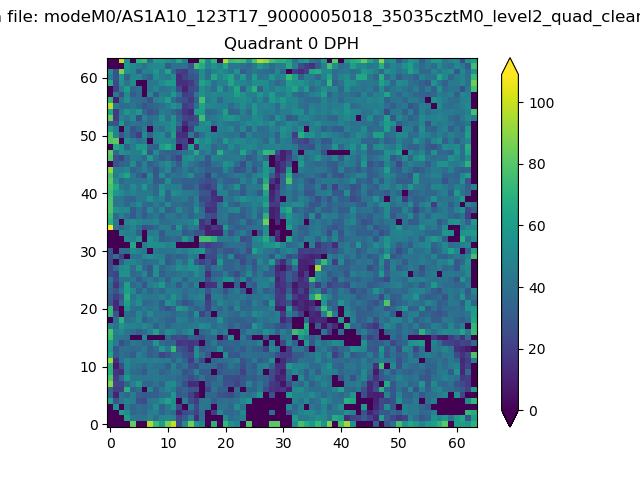 |
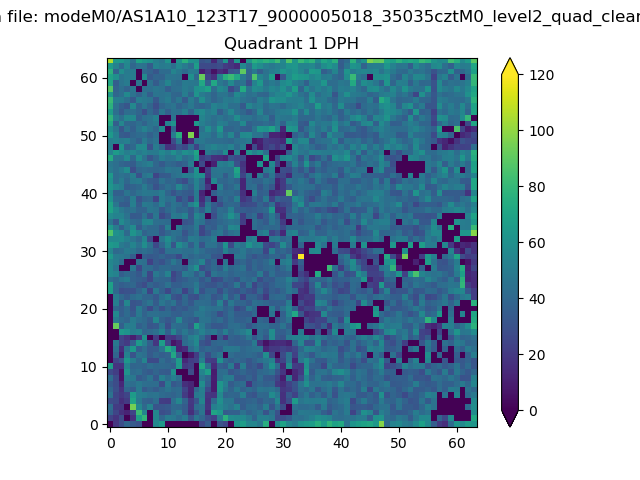 |
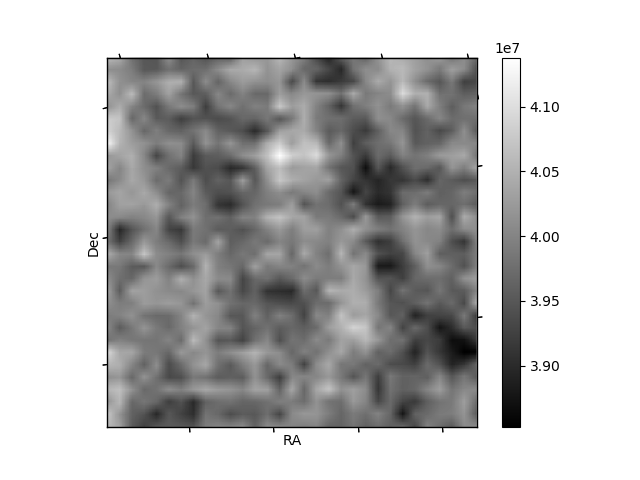
Quadrant B |
|---|---|---|---|
| Quadrant D | 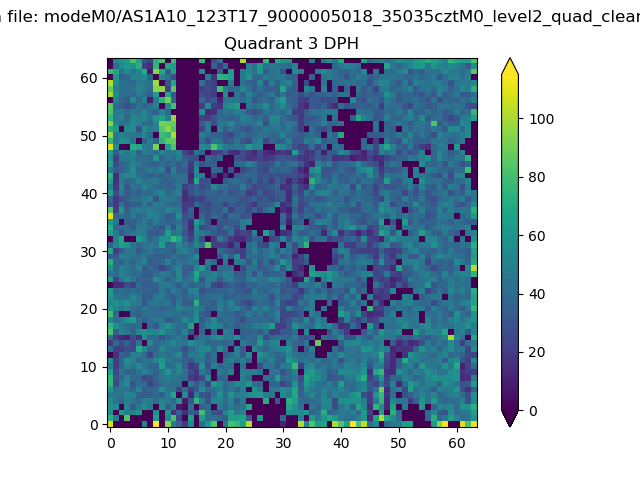 |
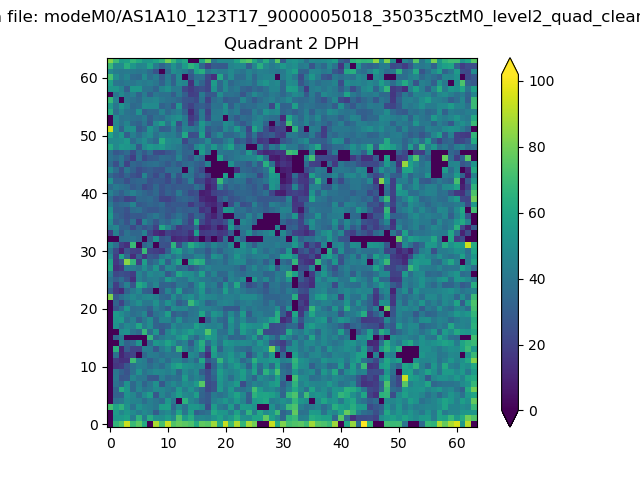 |
Quadrant C |
| Plot type | Count rate plots | Images |
|---|---|---|
| Comparison with Poisson distribution Blue bars denote a histogram of data divided into 1 sec bins. Red curve is a Poisson curve with rate = median count rate of data. |
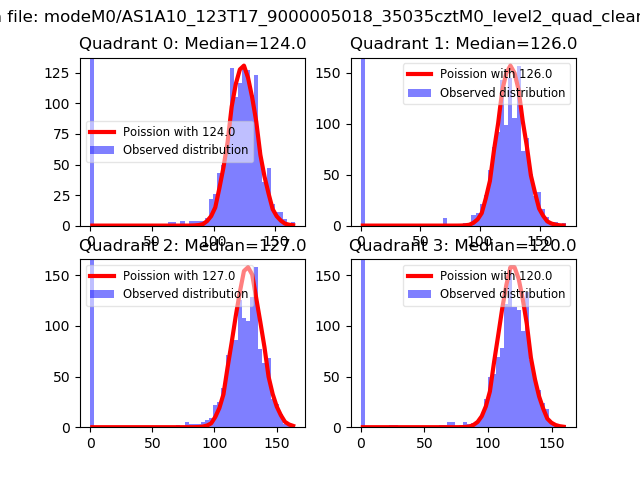 |
 |
| Quadrant-wise count rates Data is divided into 100 sec bins |
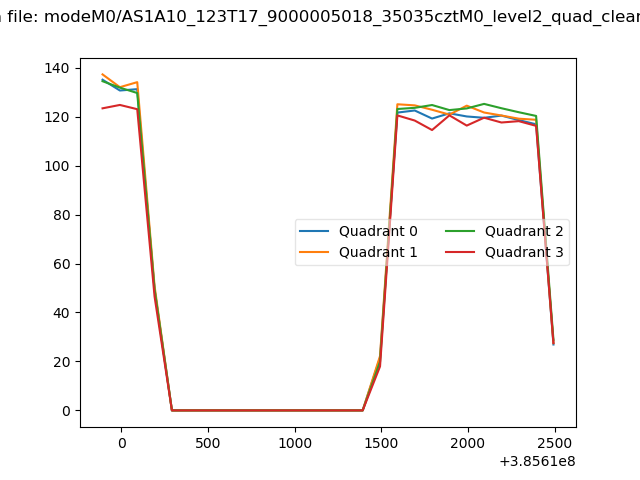 |
|
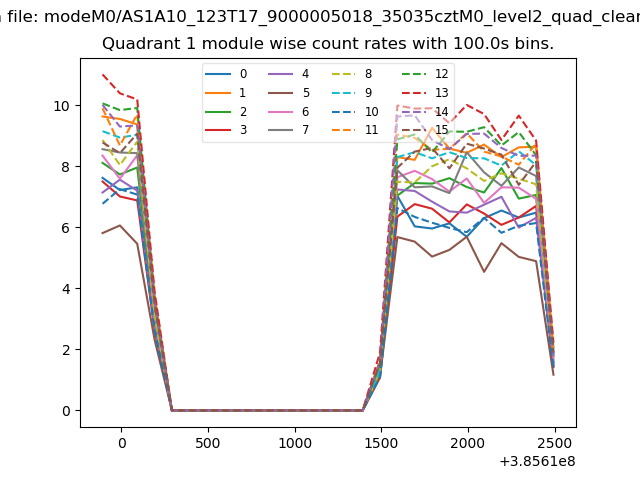
| Module-wise count rates for Quadrant A Data is divided into 100 sec bins |
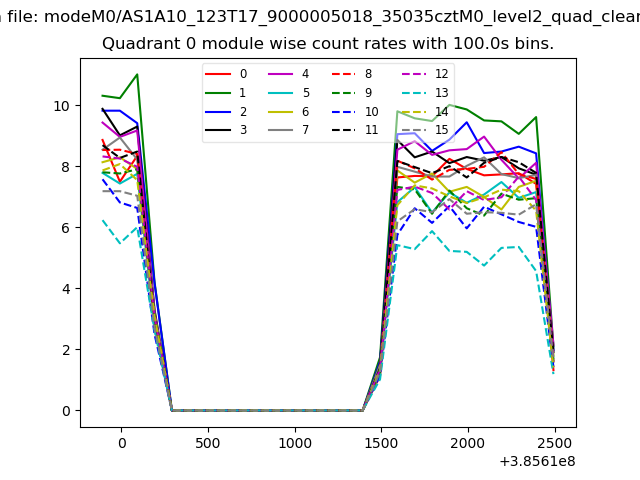 |
 |
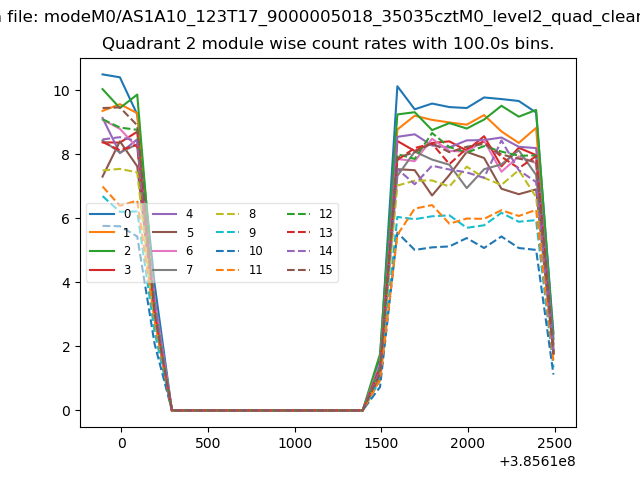
| Module-wise count rates for Quadrant B Data is divided into 100 sec bins |
 |
 |
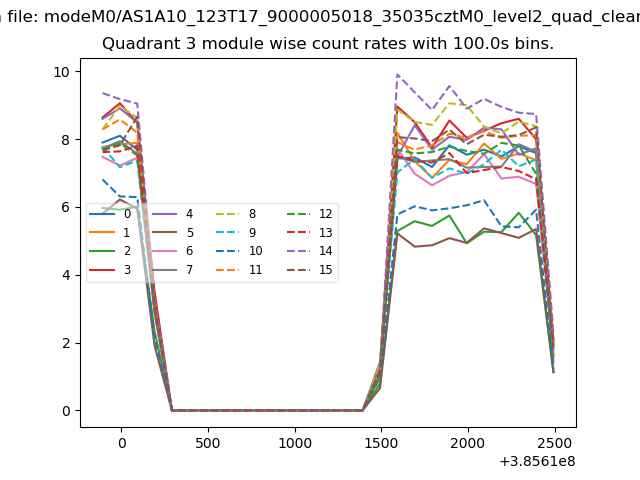
| Module-wise count rates for Quadrant C Data is divided into 100 sec bins |
 |
 |
| Module-wise count rates for Quadrant D Data is divided into 100 sec bins |
 |
 |
| Parameter | Plot |
|---|---|
| CZT HV Monitor | 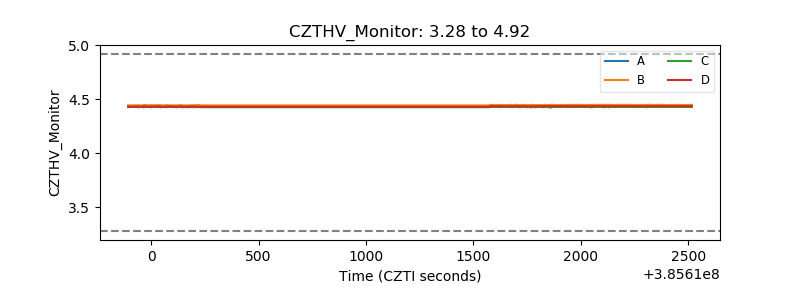 |
| D_VDD | 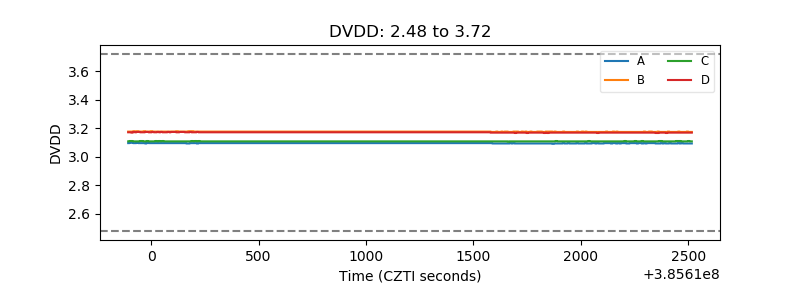 |
| Temperature 1 | 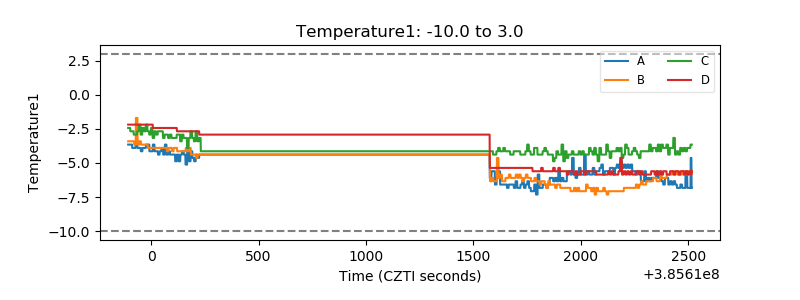 |
| Veto HV Monitor | 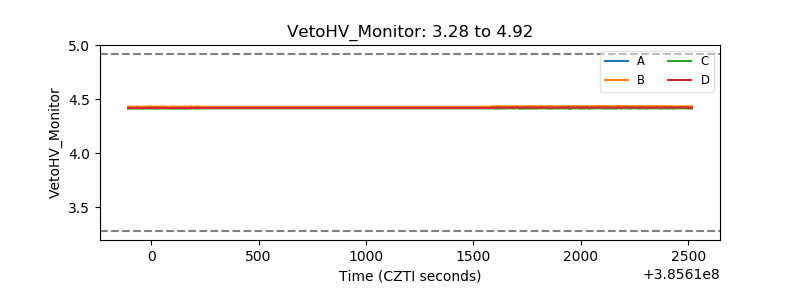 |
| Veto LLD | 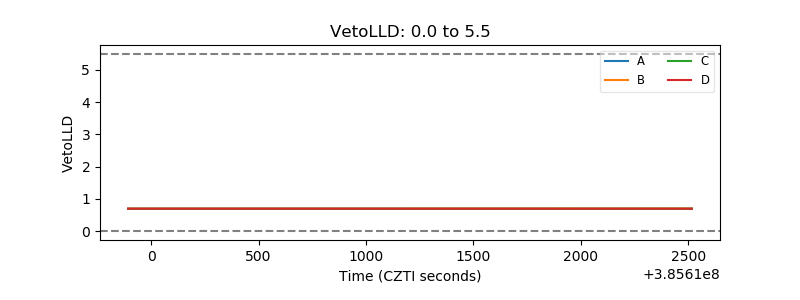 |
| Alpha Counter | 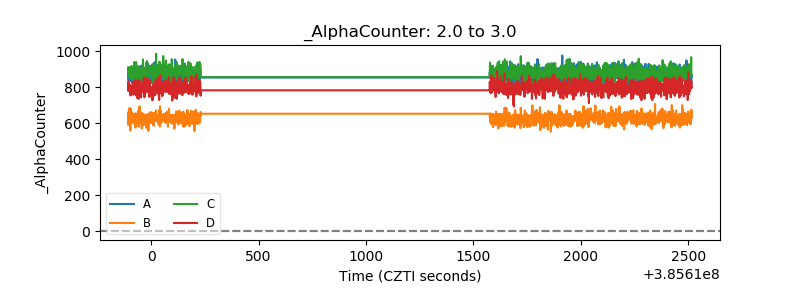 |
| _CPM_Rate | 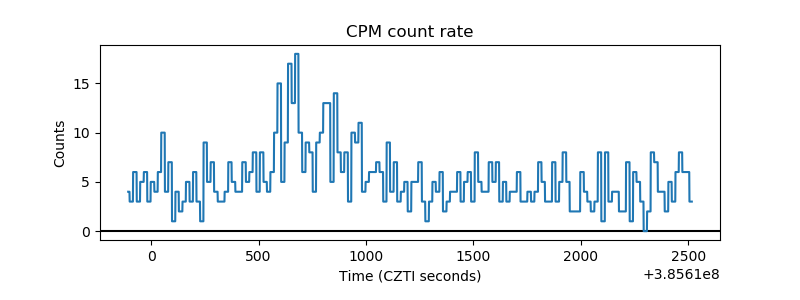 |
| CZT Counter | 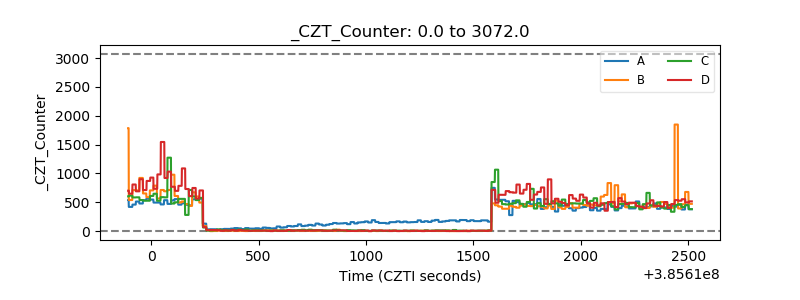 |
| +2.5 Volts monitor | 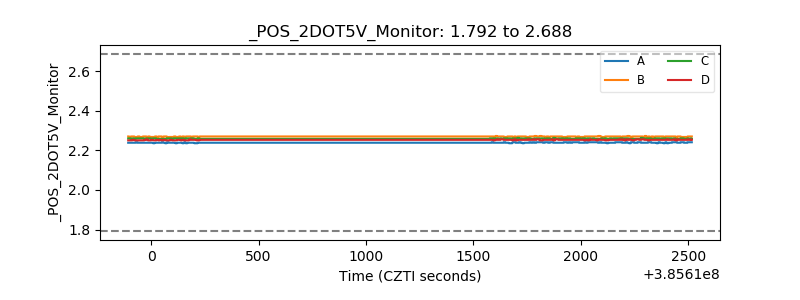 |
| +5 Volts monitor | 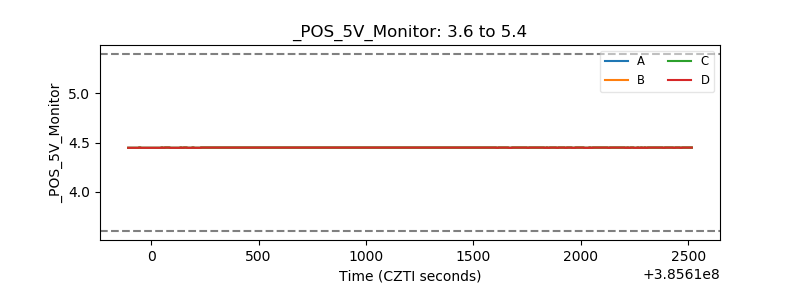 |
| _ROLL_ROT | 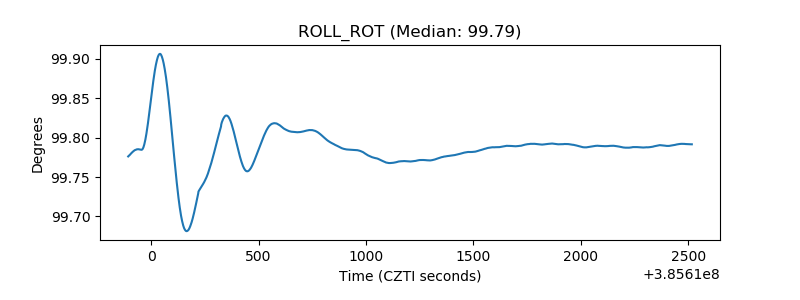 |
| _Roll_DEC | 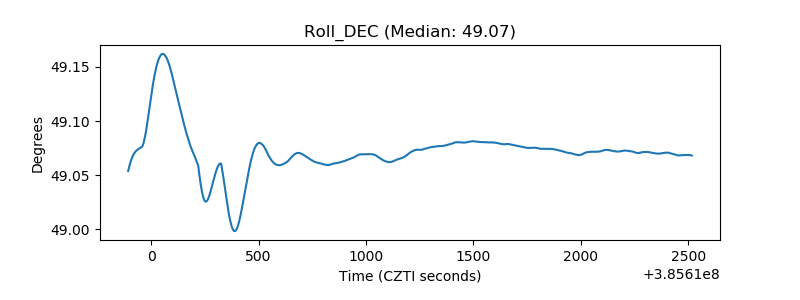 |
| _Roll_RA | 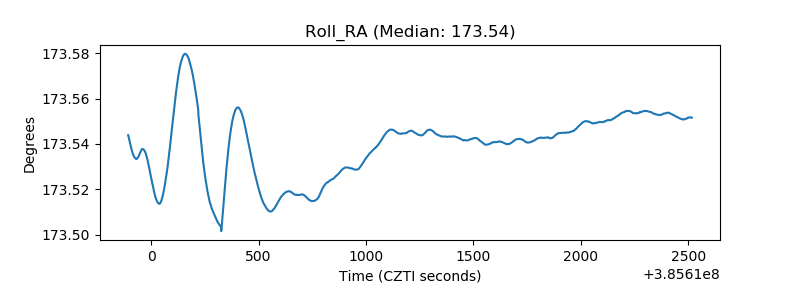 |
| Veto Counter | 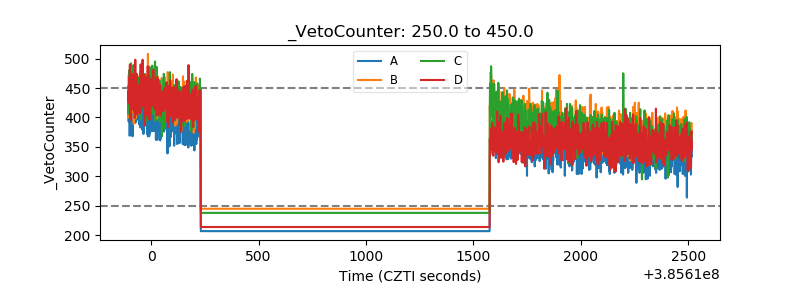 |