| Param | Original file | Final file |
|---|---|---|
| Filename | modeM0/AS1A10_057T01_9000005022_35057cztM0_level2.evt | modeM0/AS1A10_057T01_9000005022_35057cztM0_level2_quad_clean.evt |
| Size (bytes) | 456,140,160 | 90,328,320 |
| Size | 435.0 MB | 86.1 MB |
| Events in quadrant A | 2,575,385 | 626,297 |
| Events in quadrant B | 3,454,361 | 604,851 |
| Events in quadrant C | 2,762,664 | 600,467 |
| Events in quadrant D | 4,678,932 | 549,380 |
| Mode M0 | |||
|---|---|---|---|
| Quadrant | BADHDUFLAG | Total packets | Discarded packets |
| A | 0 | 10822 | 2 |
| B | 0 | 13489 | 1 |
| C | 0 | 11165 | 1 |
| D | 0 | 17411 | 1 |
| Mode M9 | |||
|---|---|---|---|
| Quadrant | BADHDUFLAG | Total packets | Discarded packets |
| A | 0 | 19 | 0 |
| B | 0 | 19 | 0 |
| C | 0 | 19 | 0 |
| D | 0 | 19 | 0 |
| Mode SS | |||
|---|---|---|---|
| Quadrant | BADHDUFLAG | Total packets | Discarded packets |
| A | 0 | 102 | 0 |
| B | 0 | 102 | 0 |
| C | 0 | 102 | 0 |
| D | 0 | 102 | 0 |
| Quadrant | Total seconds | Saturated seconds | Saturation percentage |
|---|---|---|---|
| A | 5059 | 27 | 0.533702% |
| B | 5059 | 261 | 5.159122% |
| C | 5059 | 26 | 0.513936% |
| D | 5059 | 366 | 7.234631% |
Noise dominated data is calculated using 1-second bins in cleaned event files. If a bin has >2000 counts, and if more than 50% of those come from <1% of pixels, then it is considered to be noise-dominated and hence unusable.
| Quadrant | # 1 sec bins | Bins with >0 counts | Bins with >2000 counts | High rate bins dominated by noise | Noise dominated (total time) | Noise dominated (detector-on time) | Marked lightcurve |
|---|---|---|---|---|---|---|---|
| A | 6942 | 5060 | 18 | 18 | 0.26% | 0.36% | 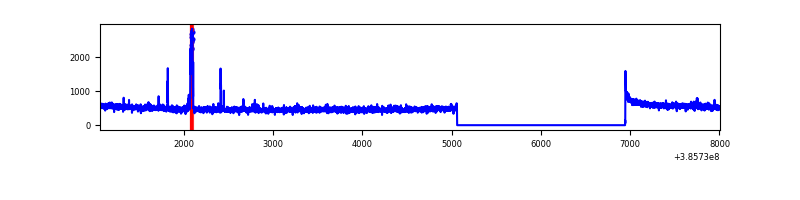 |
| B | 6942 | 5060 | 211 | 211 | 3.04% | 4.17% | 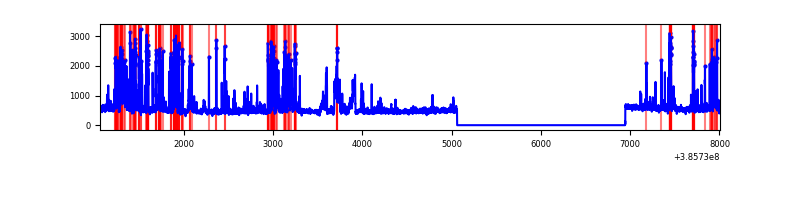 |
| C | 6942 | 5060 | 14 | 14 | 0.20% | 0.28% | 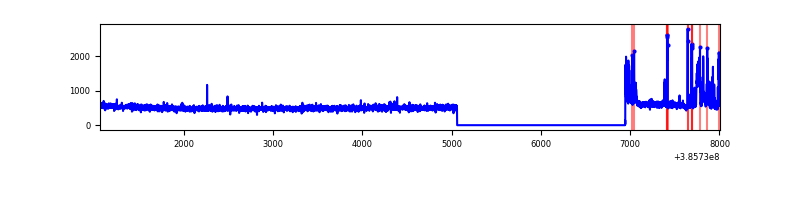 |
| D | 6942 | 5060 | 358 | 358 | 5.16% | 7.08% | 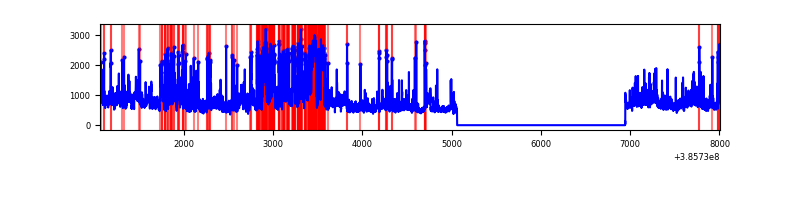 |
Top three noisy pixels from each quadrant. If the there are fewer than three noisy pixels in the level2.evt file, extra rows are filled as -1
| Pixel properties | Quadrant properties | ||||||
|---|---|---|---|---|---|---|---|
| Quadrant | DetID | PixID | Counts | Sigma | Mean | Median | Sigma |
| A | 15 | 174 | 82804 | 662.37 | 626 | 615 | 124.1 |
| A | 10 | 83 | 53845 | 428.99 | 626 | 615 | 124.1 |
| A | 13 | 6 | 9354 | 70.43 | 626 | 615 | 124.1 |
| B | 5 | 172 | 564708 | 4932.68 | 603 | 588 | 114.4 |
| B | 0 | 190 | 330448 | 2884.31 | 603 | 588 | 114.4 |
| B | 5 | 200 | 145972 | 1271.24 | 603 | 588 | 114.4 |
| C | 15 | 214 | 207471 | 1493.39 | 601 | 606 | 138.5 |
| C | 1 | 23 | 159895 | 1149.93 | 601 | 606 | 138.5 |
| C | 0 | 10 | 29902 | 211.49 | 601 | 606 | 138.5 |
| D | 8 | 195 | 896368 | 6223.94 | 593 | 578 | 143.9 |
| D | 10 | 118 | 530059 | 3678.83 | 593 | 578 | 143.9 |
| D | 2 | 153 | 283508 | 1965.8 | 593 | 578 | 143.9 |
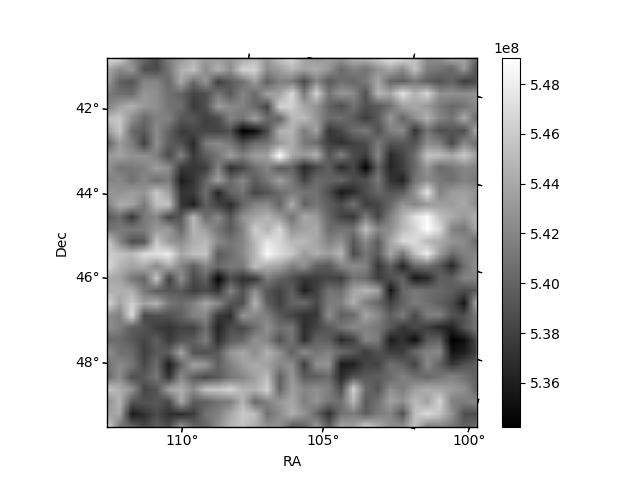
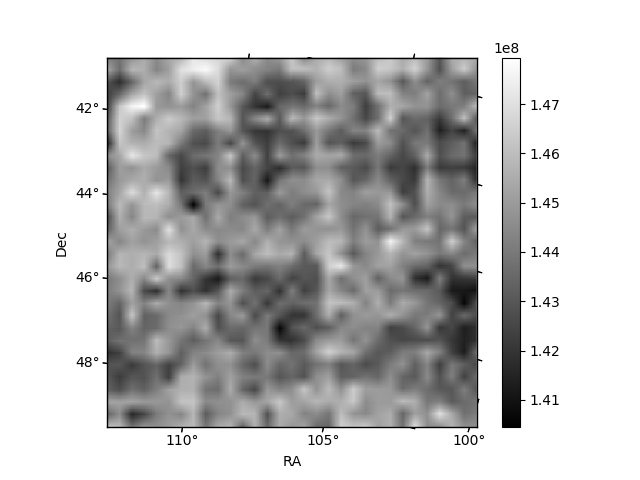
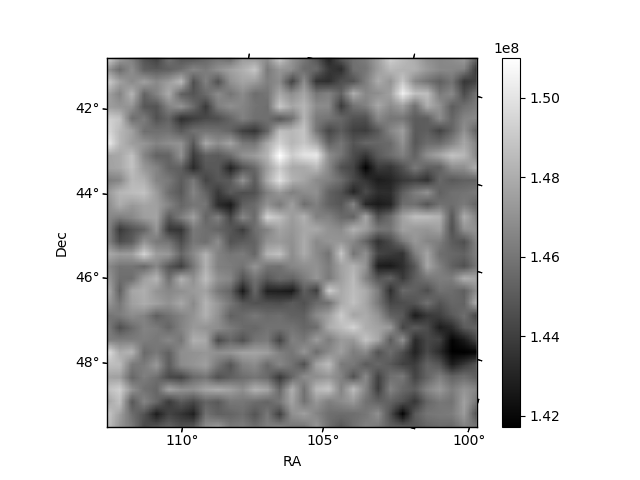
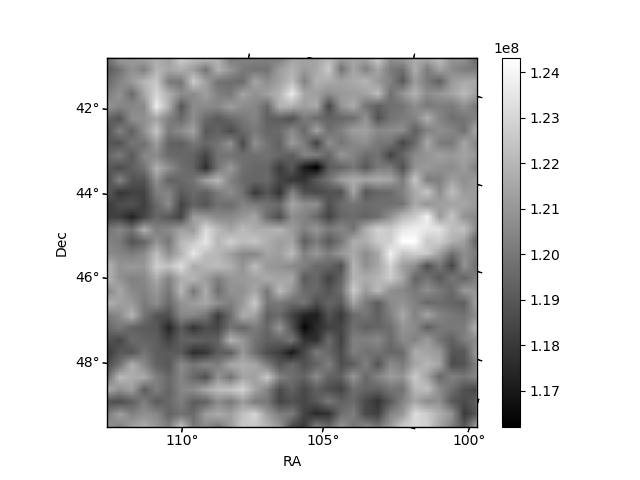
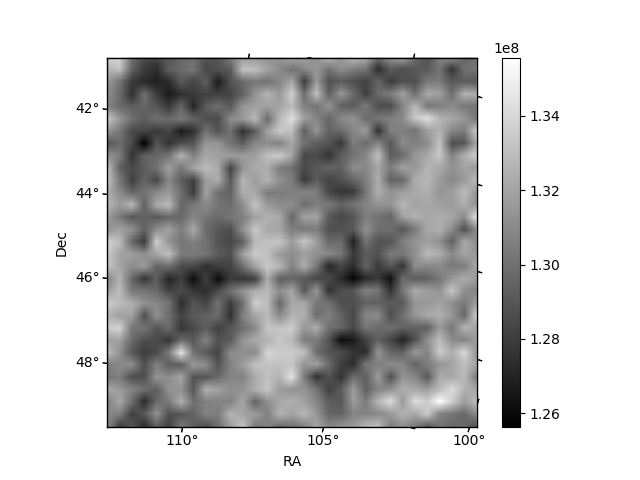
Histogram calculated using DETX and DETY for each event in the final _common_clean file
| Quadrant A | 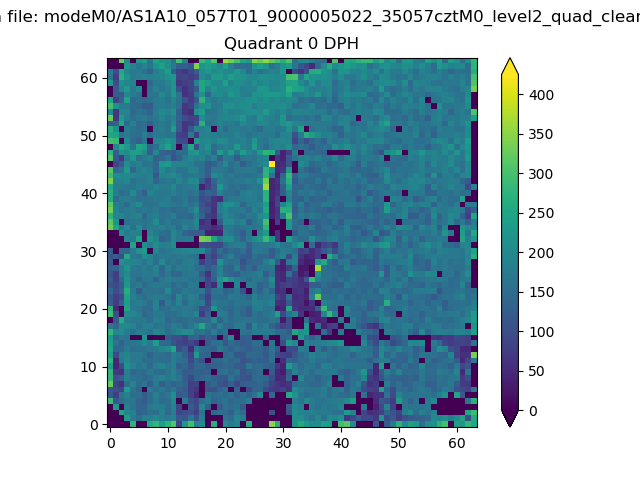 |
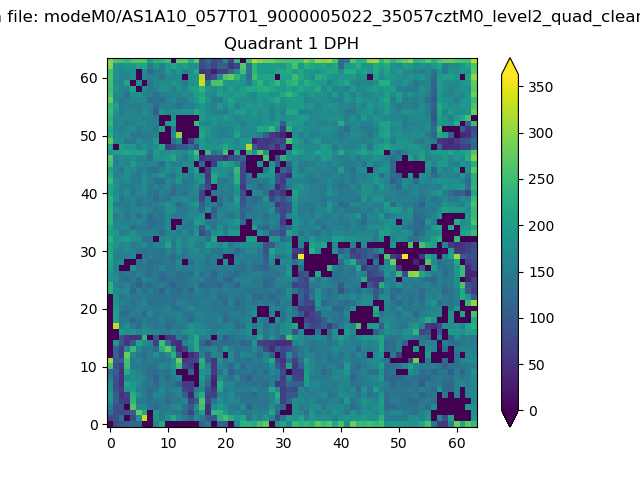 |
Quadrant B |
|---|---|---|---|
| Quadrant D | 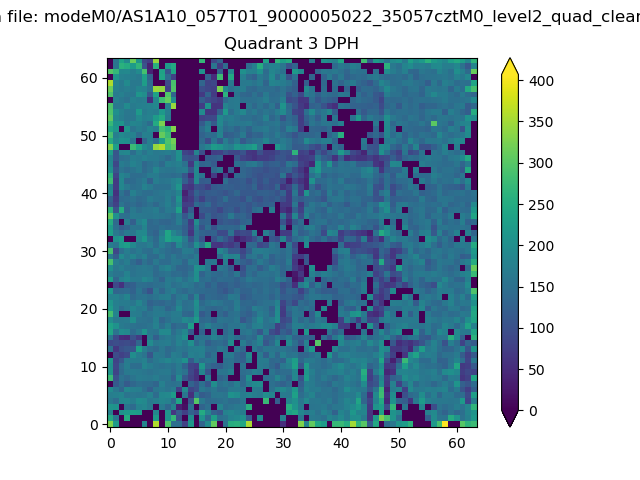 |
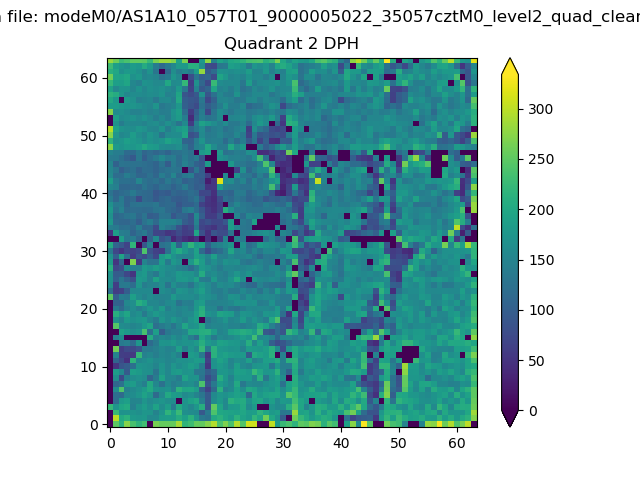 |
Quadrant C |
| Plot type | Count rate plots | Images |
|---|---|---|
| Comparison with Poisson distribution Blue bars denote a histogram of data divided into 1 sec bins. Red curve is a Poisson curve with rate = median count rate of data. |
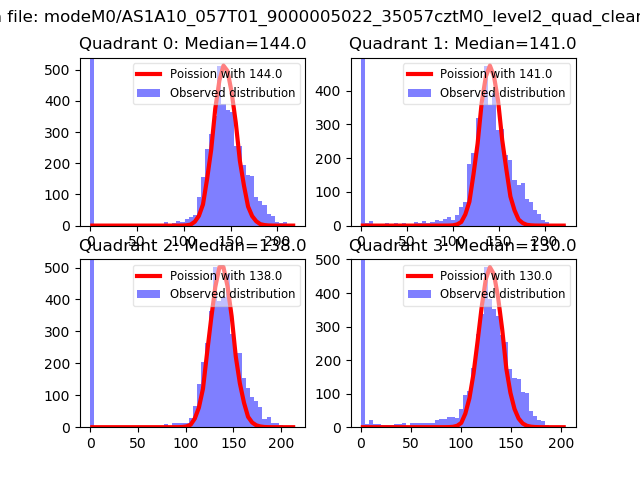 |
 |
| Quadrant-wise count rates Data is divided into 100 sec bins |
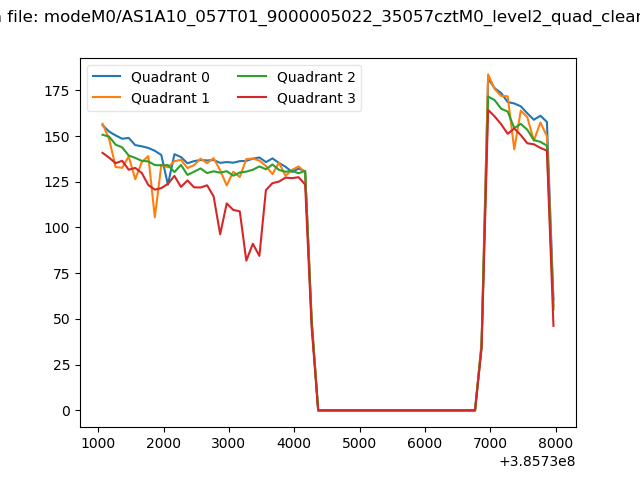 |
|
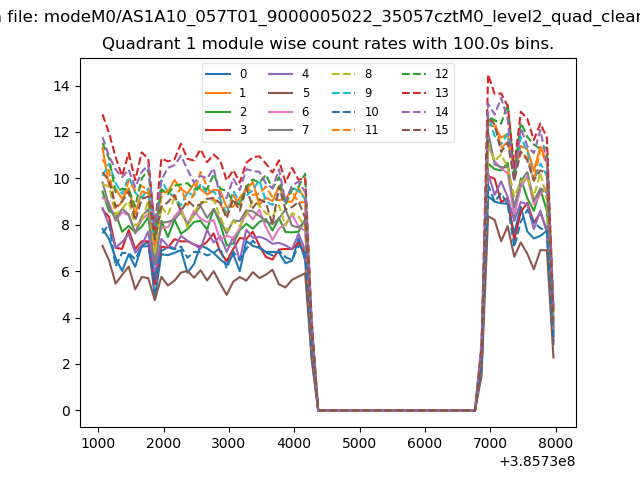
| Module-wise count rates for Quadrant A Data is divided into 100 sec bins |
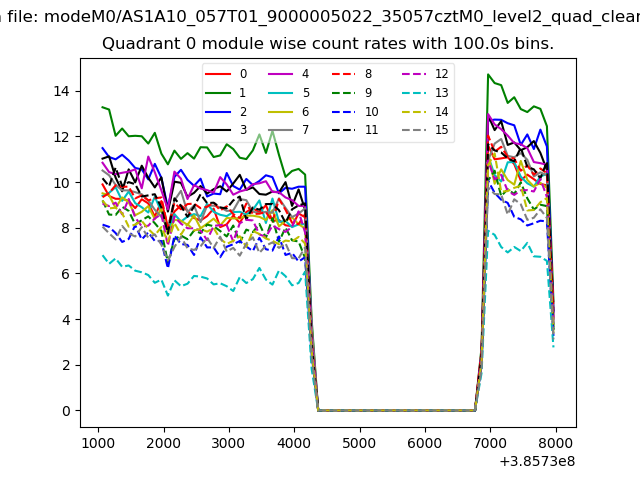 |
 |
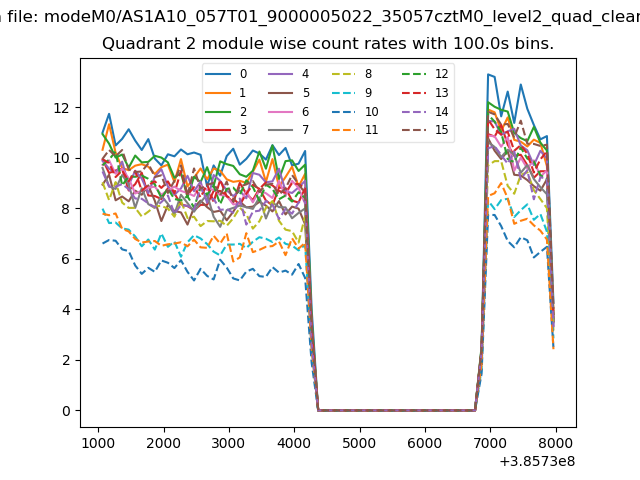
| Module-wise count rates for Quadrant B Data is divided into 100 sec bins |
 |
 |
| Module-wise count rates for Quadrant C Data is divided into 100 sec bins |
 |
 |
| Module-wise count rates for Quadrant D Data is divided into 100 sec bins |
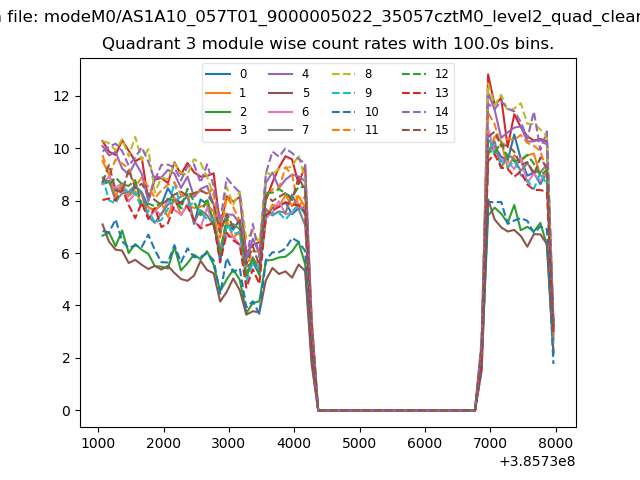 |
 |
| Parameter | Plot |
|---|---|
| CZT HV Monitor | 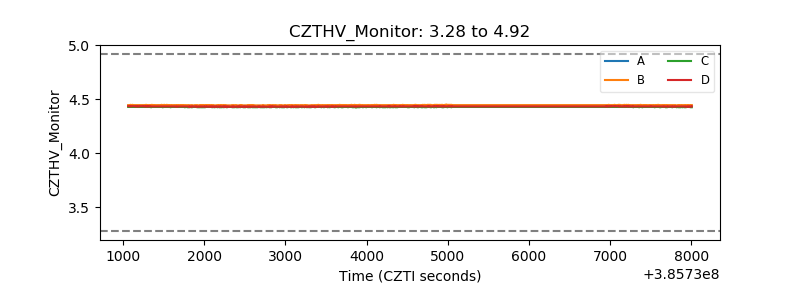 |
| D_VDD | 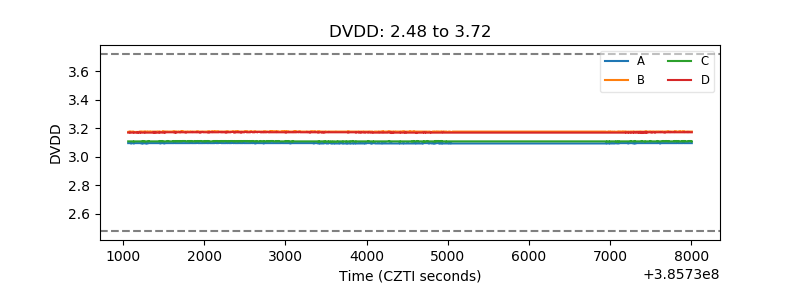 |
| Temperature 1 | 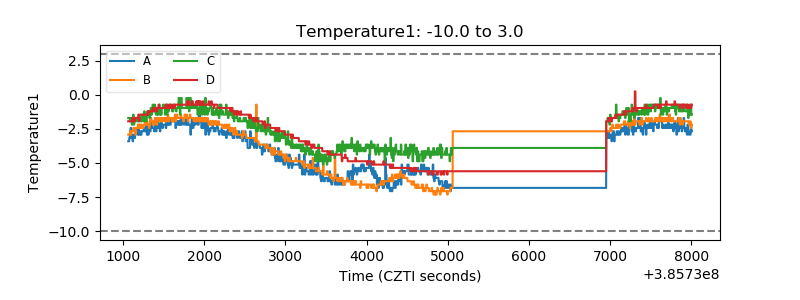 |
| Veto HV Monitor | 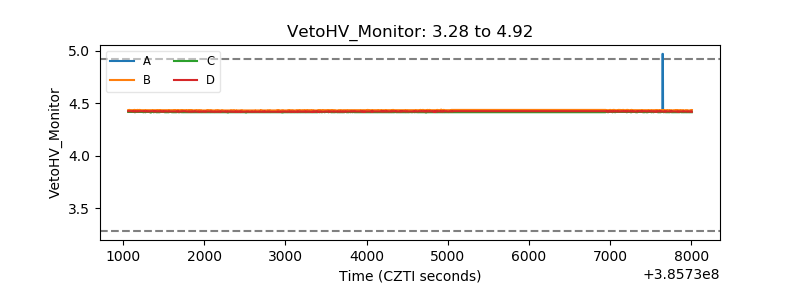 |
| Veto LLD | 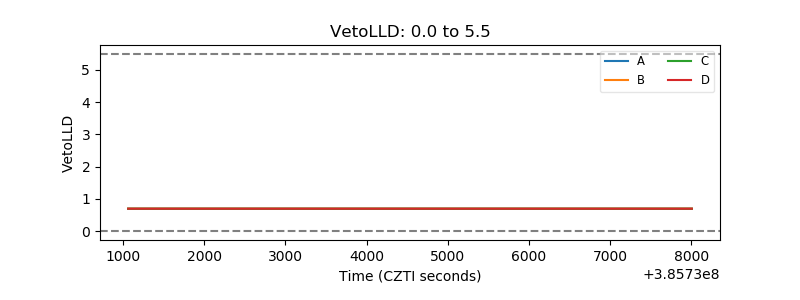 |
| Alpha Counter | 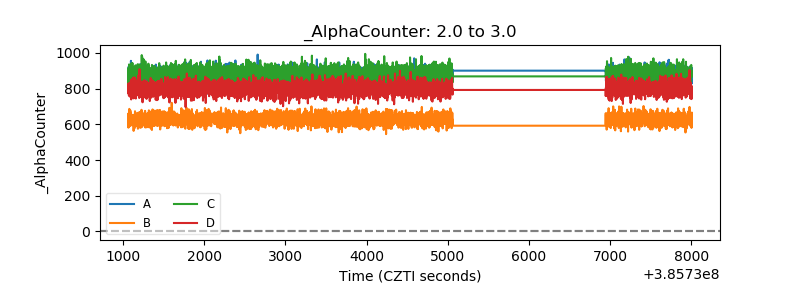 |
| _CPM_Rate | 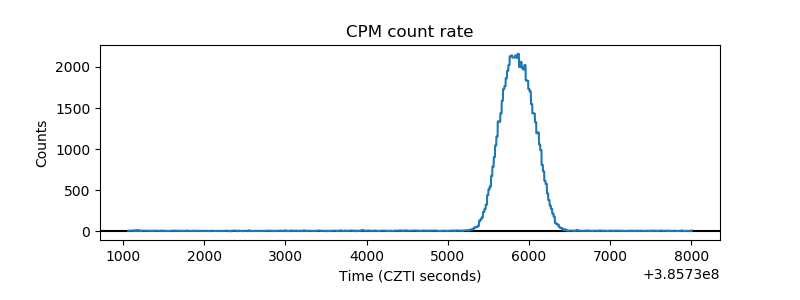 |
| CZT Counter | 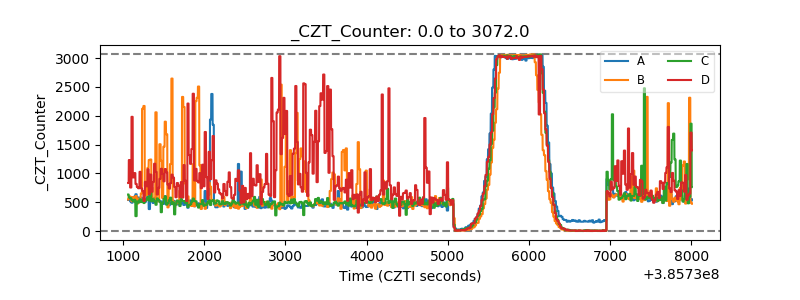 |
| +2.5 Volts monitor | 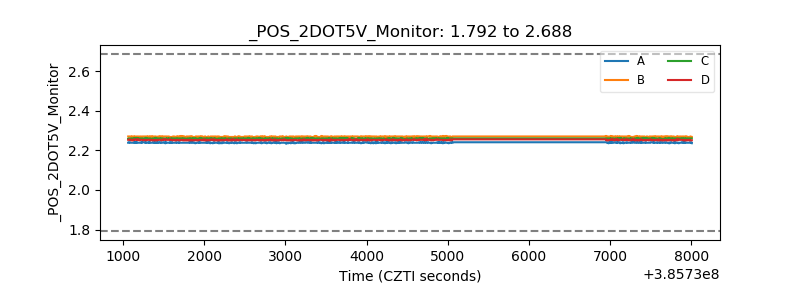 |
| +5 Volts monitor | 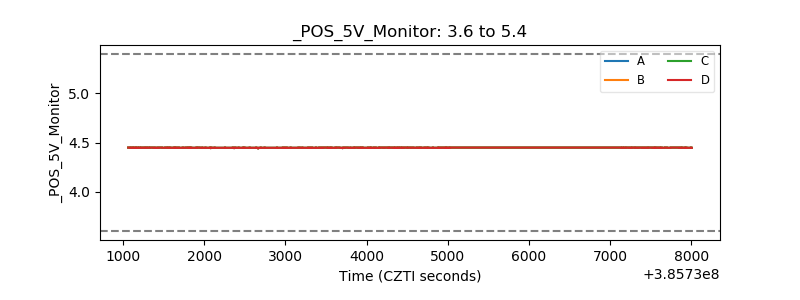 |
| _ROLL_ROT | 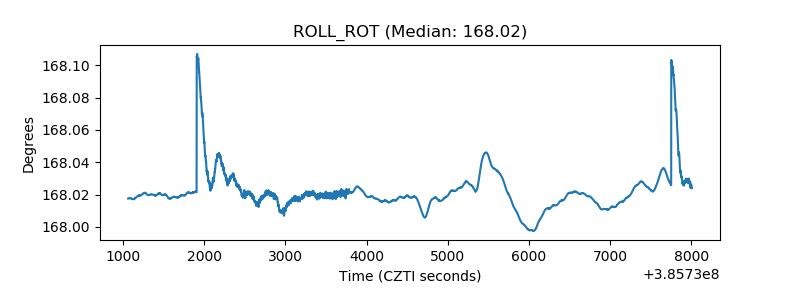 |
| _Roll_DEC | 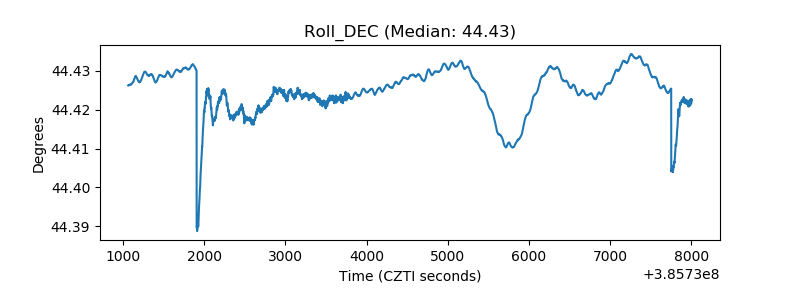 |
| _Roll_RA | 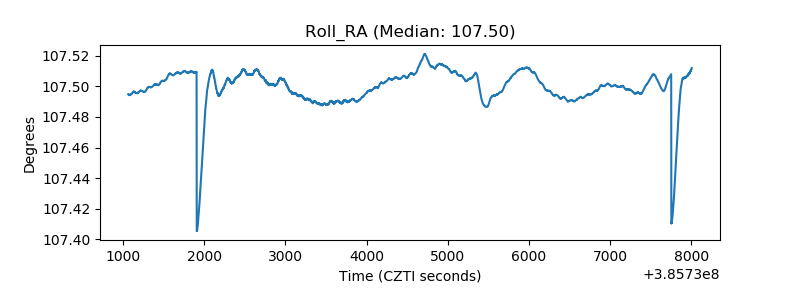 |
| Veto Counter | 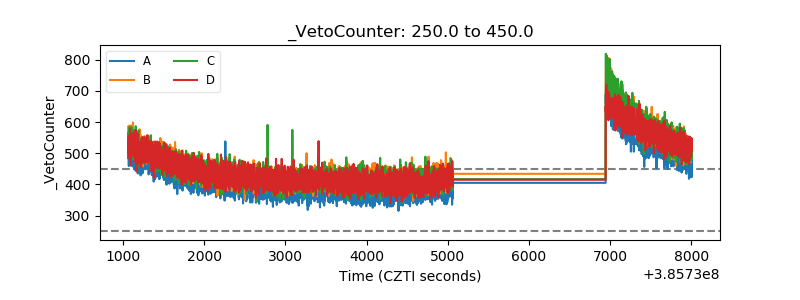 |