| Param | Original file | Final file |
|---|---|---|
| Filename | modeM0/AS1A10_057T01_9000005022_35054cztM0_level2.evt | modeM0/AS1A10_057T01_9000005022_35054cztM0_level2_quad_clean.evt |
| Size (bytes) | 514,157,760 | 84,908,160 |
| Size | 490.3 MB | 81.0 MB |
| Events in quadrant A | 2,672,550 | 564,647 |
| Events in quadrant B | 3,738,324 | 556,944 |
| Events in quadrant C | 2,886,855 | 554,598 |
| Events in quadrant D | 5,895,287 | 504,600 |
| Mode M0 | |||
|---|---|---|---|
| Quadrant | BADHDUFLAG | Total packets | Discarded packets |
| A | 0 | 11514 | 3 |
| B | 0 | 14704 | 4 |
| C | 0 | 11748 | 2 |
| D | 0 | 21480 | 2 |
| Mode M9 | |||
|---|---|---|---|
| Quadrant | BADHDUFLAG | Total packets | Discarded packets |
| A | 0 | 17 | 0 |
| B | 0 | 17 | 0 |
| C | 0 | 17 | 0 |
| D | 0 | 18 | 0 |
| Mode SS | |||
|---|---|---|---|
| Quadrant | BADHDUFLAG | Total packets | Discarded packets |
| A | 0 | 114 | 0 |
| B | 0 | 114 | 0 |
| C | 0 | 114 | 0 |
| D | 0 | 114 | 0 |
| Quadrant | Total seconds | Saturated seconds | Saturation percentage |
|---|---|---|---|
| A | 5580 | 4 | 0.071685% |
| B | 5579 | 349 | 6.255601% |
| C | 5580 | 14 | 0.250896% |
| D | 5580 | 587 | 10.519713% |
Noise dominated data is calculated using 1-second bins in cleaned event files. If a bin has >2000 counts, and if more than 50% of those come from <1% of pixels, then it is considered to be noise-dominated and hence unusable.
| Quadrant | # 1 sec bins | Bins with >0 counts | Bins with >2000 counts | High rate bins dominated by noise | Noise dominated (total time) | Noise dominated (detector-on time) | Marked lightcurve |
|---|---|---|---|---|---|---|---|
| A | 7194 | 5581 | 1 | 1 | 0.01% | 0.02% | 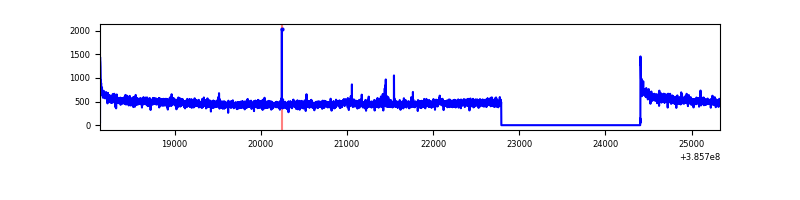 |
| B | 7194 | 5581 | 236 | 236 | 3.28% | 4.23% | 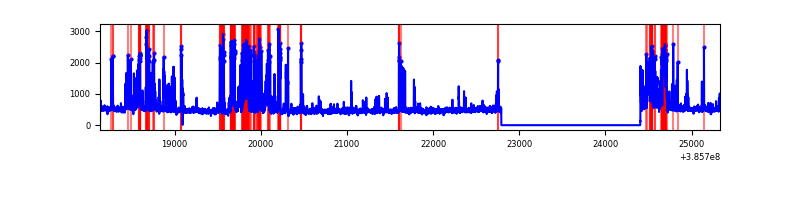 |
| C | 7194 | 5581 | 13 | 13 | 0.18% | 0.23% | 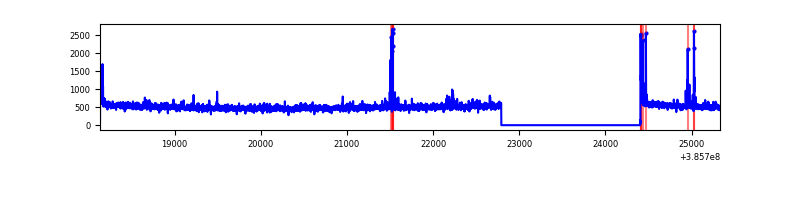 |
| D | 7194 | 5581 | 574 | 574 | 7.98% | 10.28% | 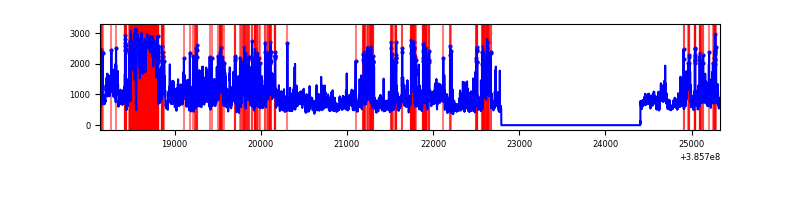 |
Top three noisy pixels from each quadrant. If the there are fewer than three noisy pixels in the level2.evt file, extra rows are filled as -1
| Pixel properties | Quadrant properties | ||||||
|---|---|---|---|---|---|---|---|
| Quadrant | DetID | PixID | Counts | Sigma | Mean | Median | Sigma |
| A | 10 | 83 | 79753 | 590.22 | 664 | 652 | 134.0 |
| A | 13 | 6 | 16197 | 115.99 | 664 | 652 | 134.0 |
| A | 13 | 254 | 8463 | 58.28 | 664 | 652 | 134.0 |
| B | 5 | 172 | 1085220 | 8692.51 | 643 | 625 | 124.8 |
| B | 4 | 232 | 54608 | 432.65 | 643 | 625 | 124.8 |
| B | 5 | 200 | 31595 | 248.21 | 643 | 625 | 124.8 |
| C | 15 | 214 | 235287 | 1576.52 | 641 | 647 | 148.8 |
| C | 15 | 159 | 57087 | 379.21 | 641 | 647 | 148.8 |
| C | 14 | 67 | 43083 | 285.12 | 641 | 647 | 148.8 |
| D | 8 | 195 | 1403772 | 9364.36 | 614 | 597 | 149.8 |
| D | 13 | 249 | 1015533 | 6773.37 | 614 | 597 | 149.8 |
| D | 1 | 47 | 289206 | 1926.09 | 614 | 597 | 149.8 |
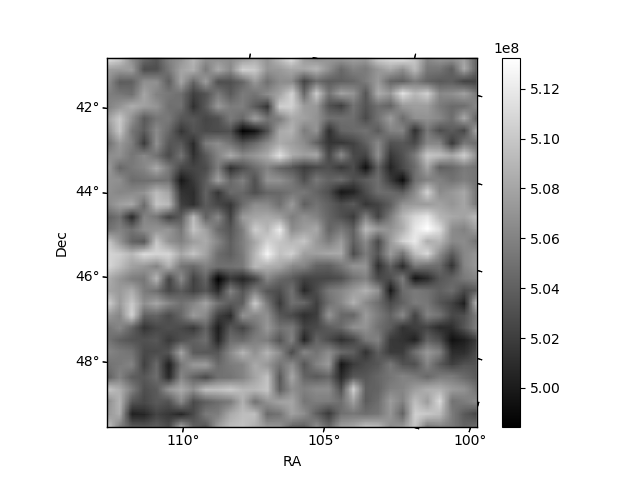
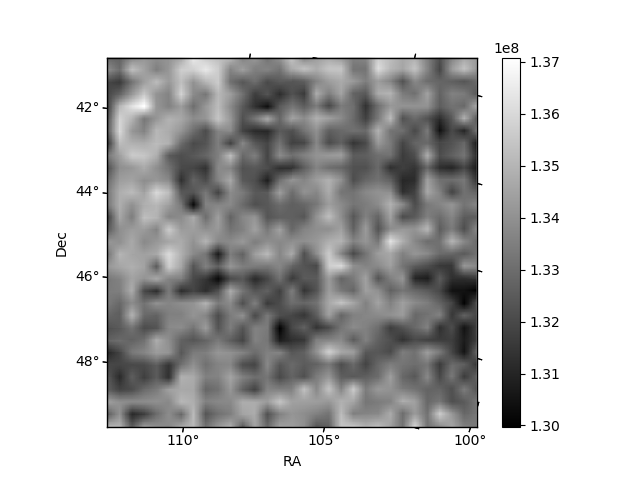
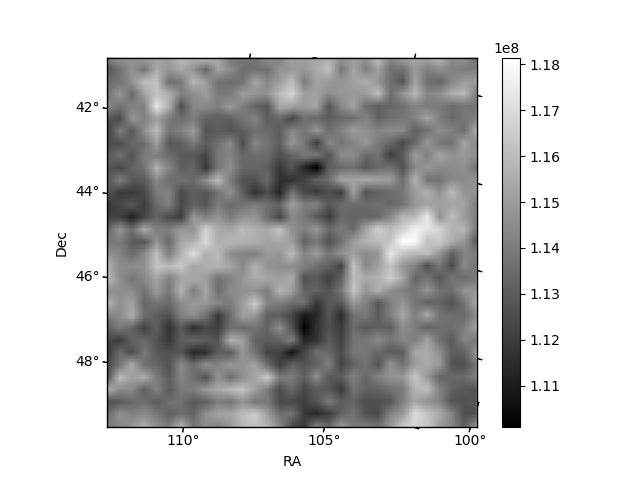
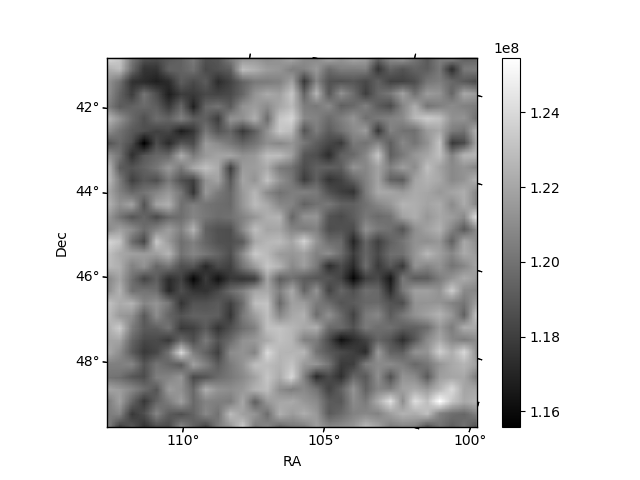
Histogram calculated using DETX and DETY for each event in the final _common_clean file
| Quadrant A | 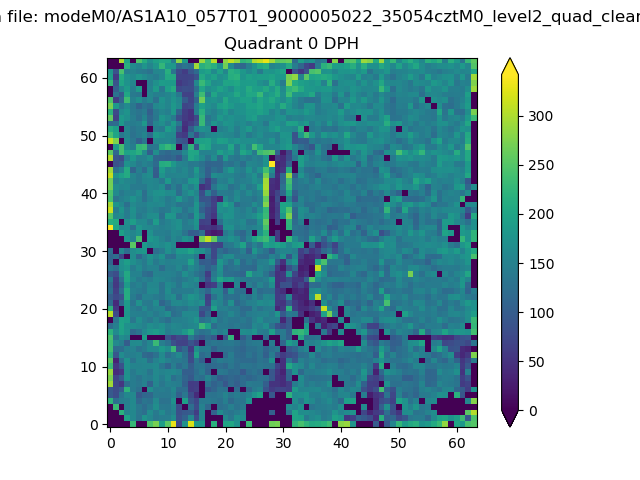 |
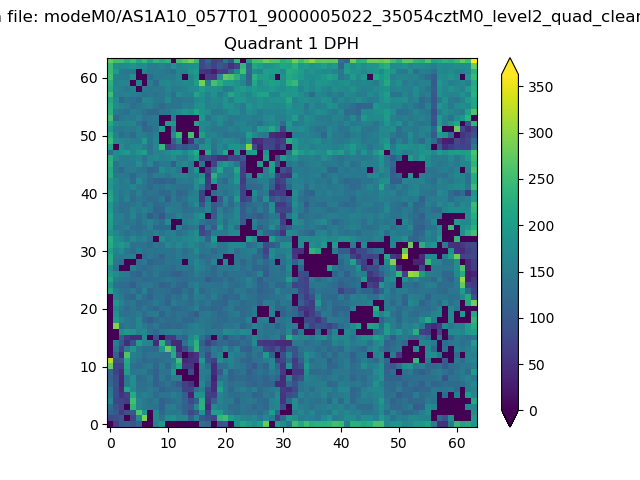 |
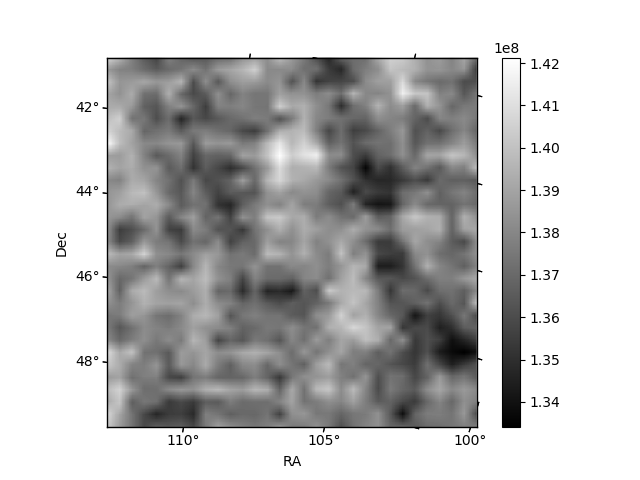
Quadrant B |
|---|---|---|---|
| Quadrant D | 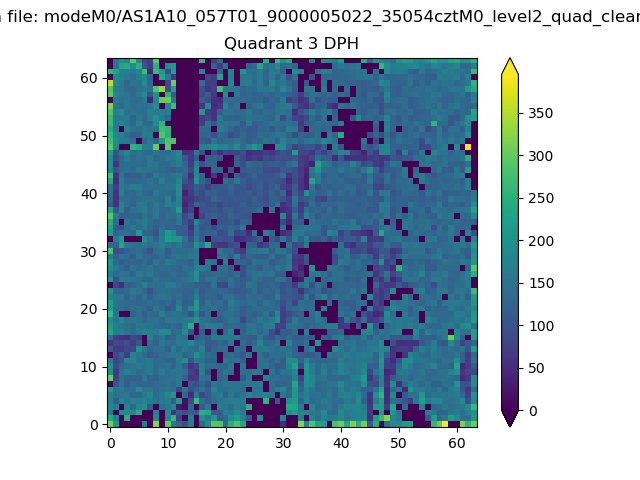 |
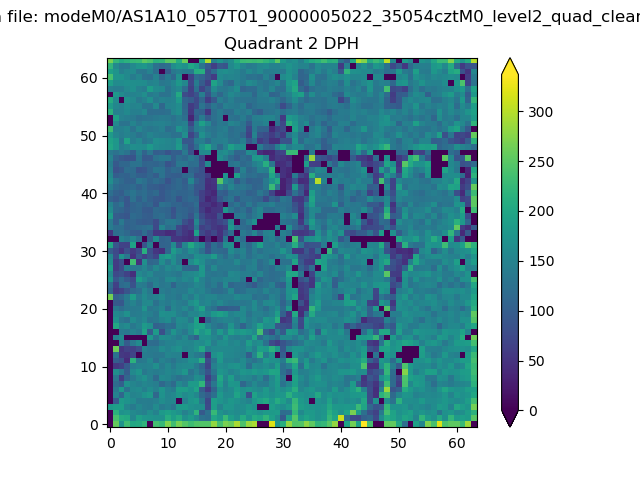 |
Quadrant C |
| Plot type | Count rate plots | Images |
|---|---|---|
| Comparison with Poisson distribution Blue bars denote a histogram of data divided into 1 sec bins. Red curve is a Poisson curve with rate = median count rate of data. |
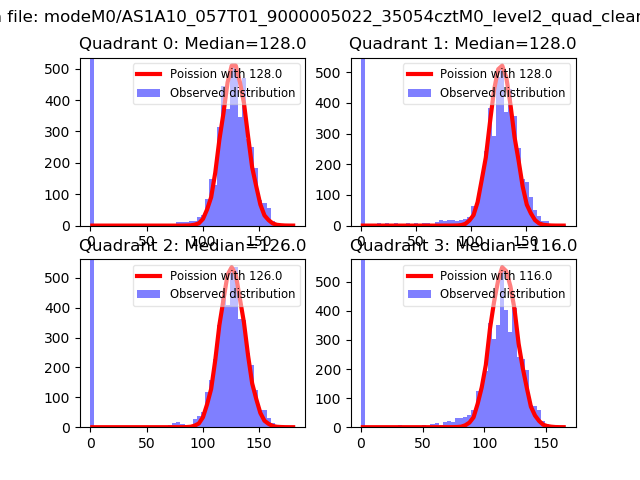 |
 |
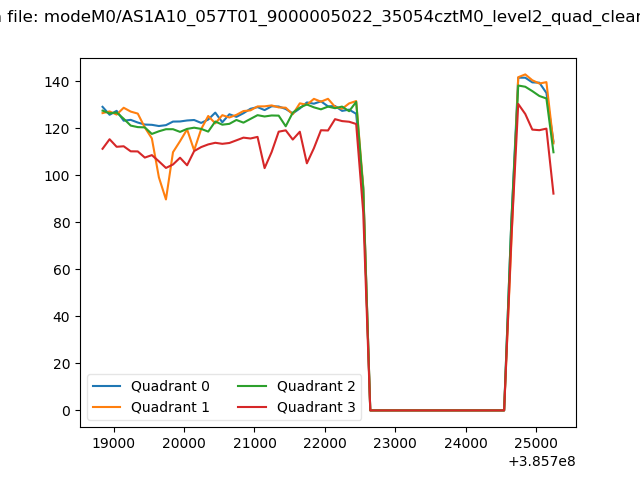
| Quadrant-wise count rates Data is divided into 100 sec bins |
 |
|
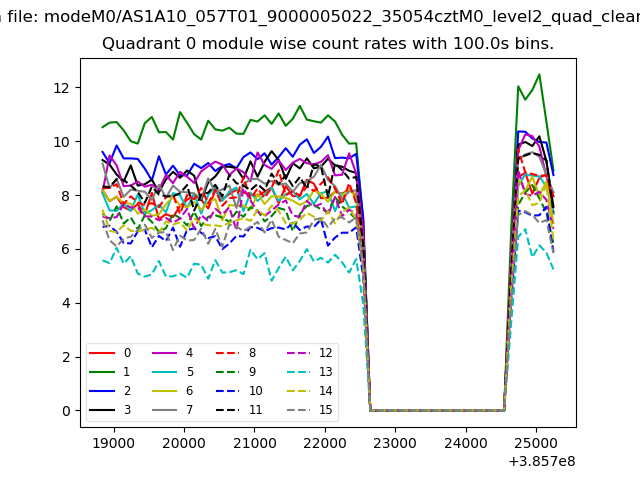
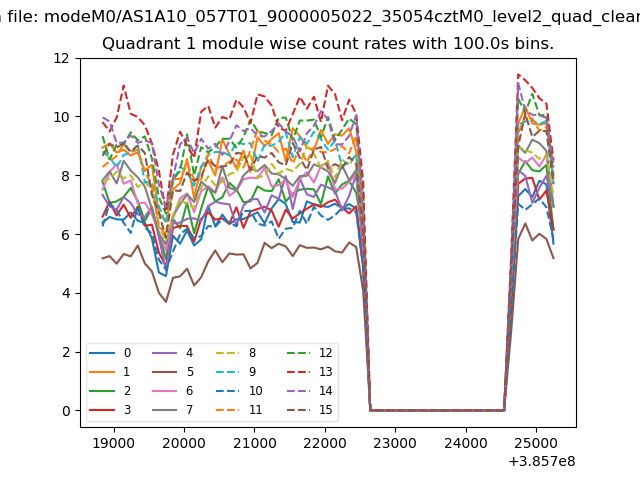
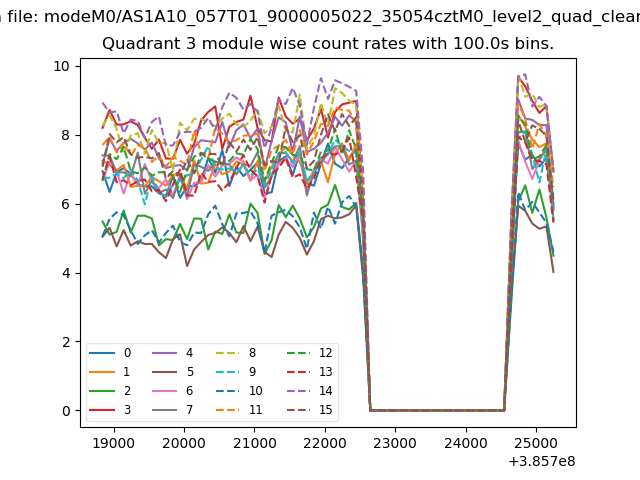
| Module-wise count rates for Quadrant A Data is divided into 100 sec bins |
 |
 |
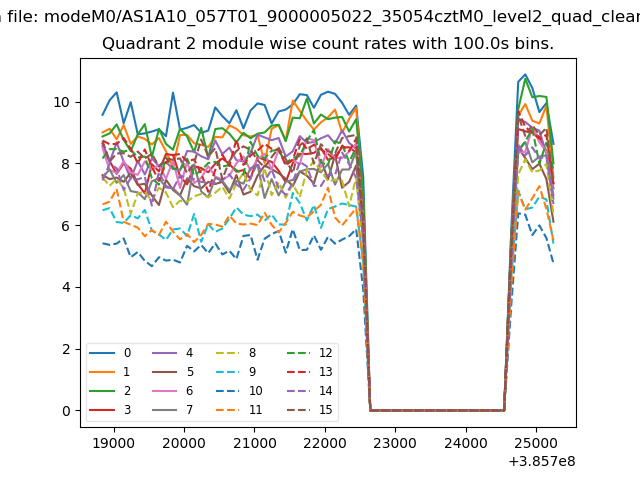
| Module-wise count rates for Quadrant B Data is divided into 100 sec bins |
 |
 |
| Module-wise count rates for Quadrant C Data is divided into 100 sec bins |
 |
 |
| Module-wise count rates for Quadrant D Data is divided into 100 sec bins |
 |
 |
| Parameter | Plot |
|---|---|
| CZT HV Monitor | 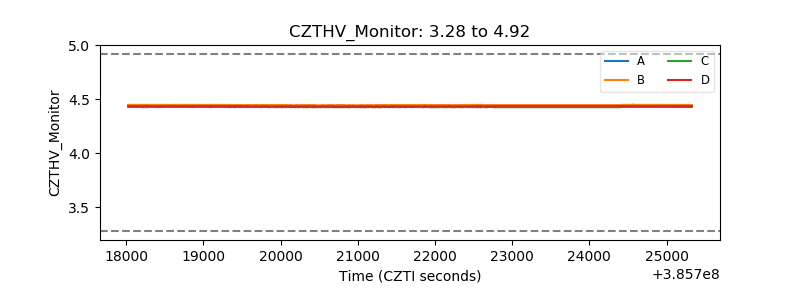 |
| D_VDD | 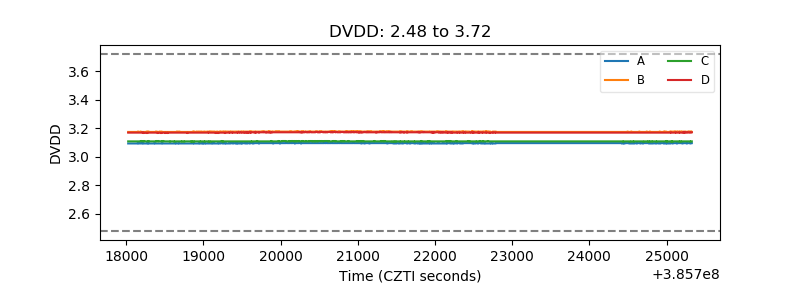 |
| Temperature 1 | 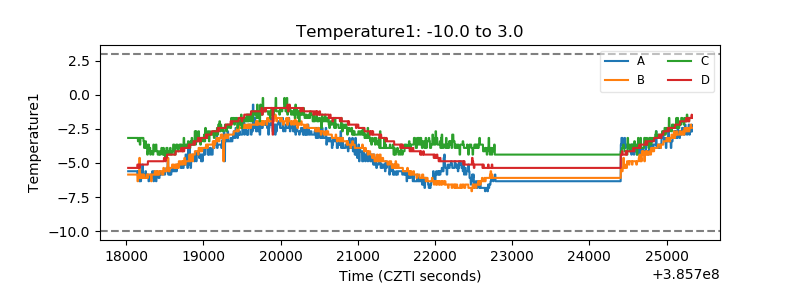 |
| Veto HV Monitor | 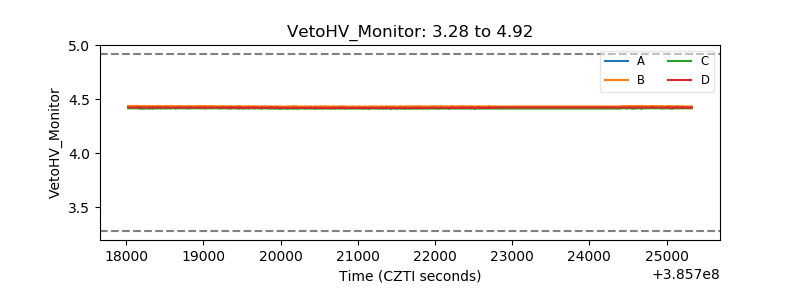 |
| Veto LLD | 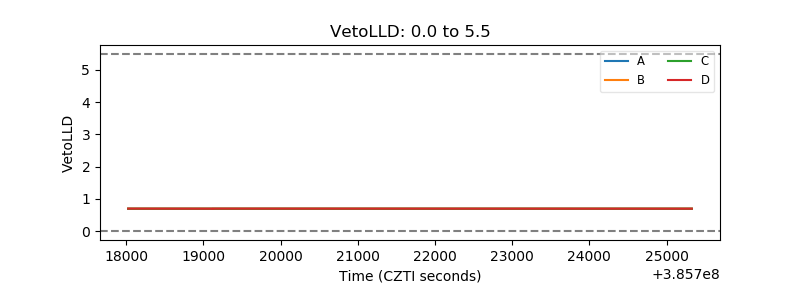 |
| Alpha Counter | 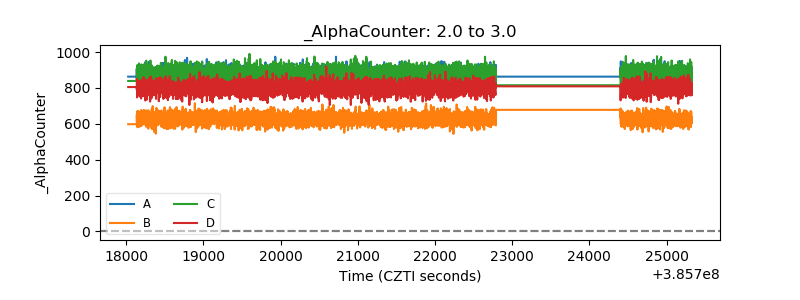 |
| _CPM_Rate | 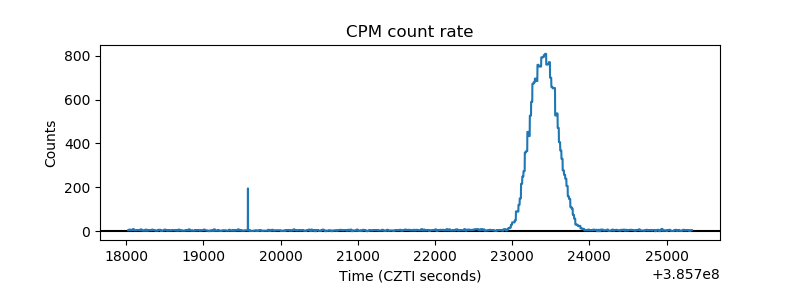 |
| CZT Counter | 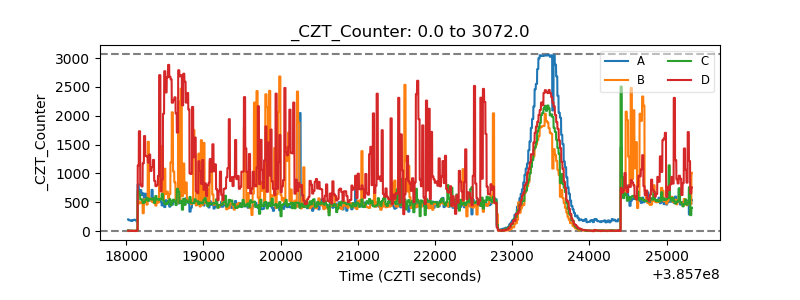 |
| +2.5 Volts monitor | 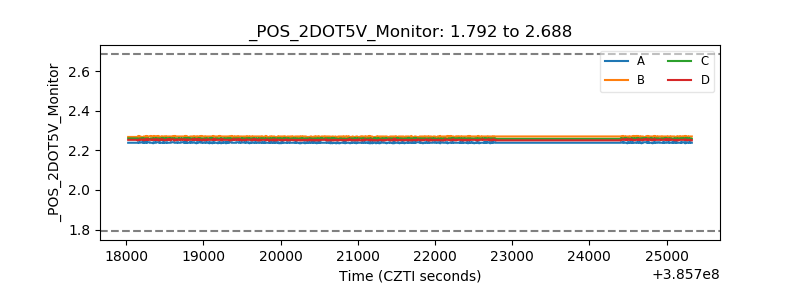 |
| +5 Volts monitor | 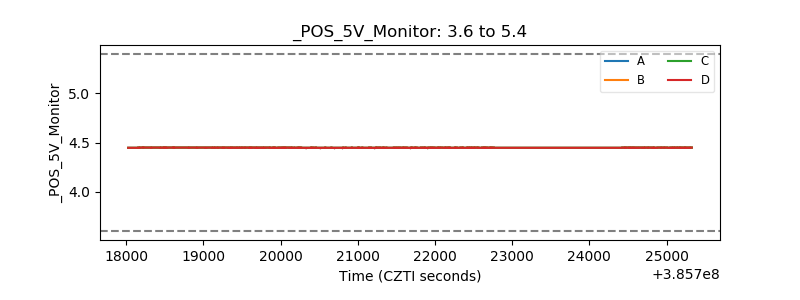 |
| _ROLL_ROT | 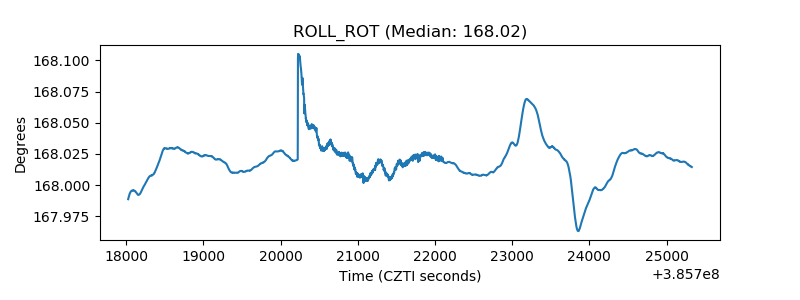 |
| _Roll_DEC | 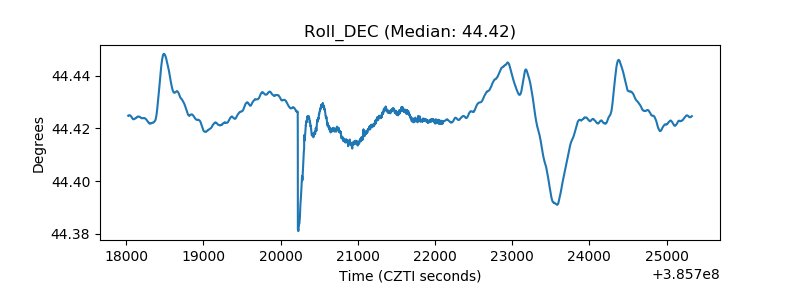 |
| _Roll_RA |  |
| Veto Counter | 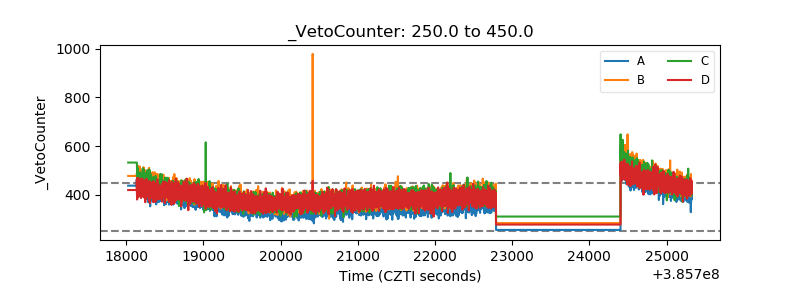 |