| Param | Original file | Final file |
|---|---|---|
| Filename | modeM0/AS1A10_057T01_9000005022_35049cztM0_level2.evt | modeM0/AS1A10_057T01_9000005022_35049cztM0_level2_quad_clean.evt |
| Size (bytes) | 498,355,200 | 64,886,400 |
| Size | 475.3 MB | 61.9 MB |
| Events in quadrant A | 2,764,243 | 407,810 |
| Events in quadrant B | 3,630,295 | 387,011 |
| Events in quadrant C | 3,353,459 | 397,153 |
| Events in quadrant D | 4,952,801 | 368,549 |
| Mode M0 | |||
|---|---|---|---|
| Quadrant | BADHDUFLAG | Total packets | Discarded packets |
| A | 0 | 12002 | 3 |
| B | 0 | 14659 | 2 |
| C | 0 | 13390 | 2 |
| D | 0 | 18854 | 2 |
| Mode M9 | |||
|---|---|---|---|
| Quadrant | BADHDUFLAG | Total packets | Discarded packets |
| A | 0 | 27 | 0 |
| B | 0 | 27 | 0 |
| C | 0 | 27 | 0 |
| D | 0 | 28 | 0 |
| Mode SS | |||
|---|---|---|---|
| Quadrant | BADHDUFLAG | Total packets | Discarded packets |
| A | 0 | 118 | 0 |
| B | 0 | 118 | 0 |
| C | 0 | 118 | 0 |
| D | 0 | 118 | 0 |
| Quadrant | Total seconds | Saturated seconds | Saturation percentage |
|---|---|---|---|
| A | 5776 | 16 | 0.277008% |
| B | 5776 | 418 | 7.236842% |
| C | 5776 | 130 | 2.250693% |
| D | 5776 | 229 | 3.964681% |
Noise dominated data is calculated using 1-second bins in cleaned event files. If a bin has >2000 counts, and if more than 50% of those come from <1% of pixels, then it is considered to be noise-dominated and hence unusable.
| Quadrant | # 1 sec bins | Bins with >0 counts | Bins with >2000 counts | High rate bins dominated by noise | Noise dominated (total time) | Noise dominated (detector-on time) | Marked lightcurve |
|---|---|---|---|---|---|---|---|
| A | 7179 | 5777 | 5 | 5 | 0.07% | 0.09% | 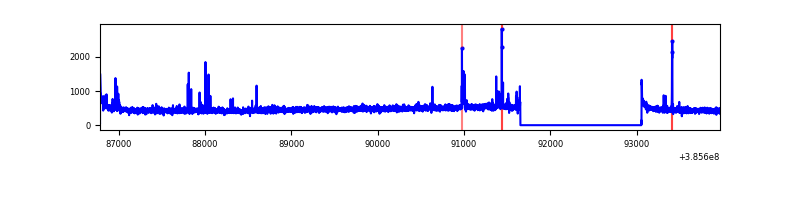 |
| B | 7179 | 5777 | 308 | 308 | 4.29% | 5.33% | 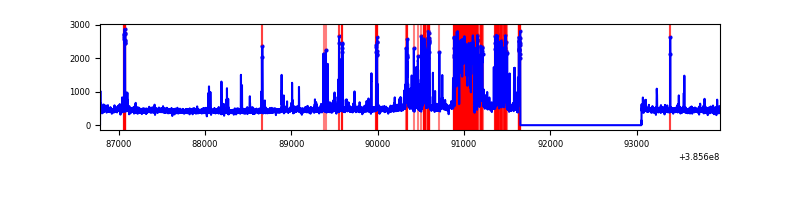 |
| C | 7179 | 5777 | 134 | 134 | 1.87% | 2.32% | 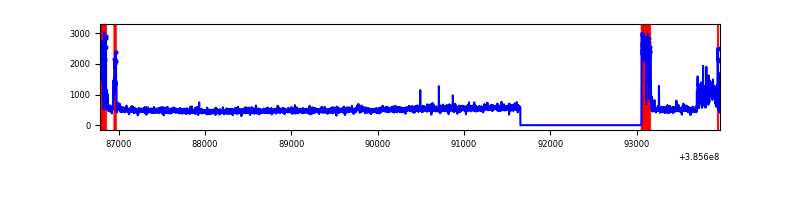 |
| D | 7179 | 5777 | 207 | 207 | 2.88% | 3.58% | 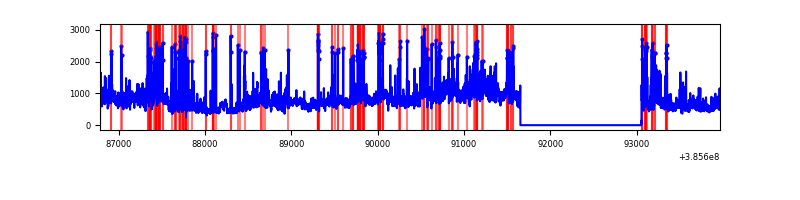 |
Top three noisy pixels from each quadrant. If the there are fewer than three noisy pixels in the level2.evt file, extra rows are filled as -1
| Pixel properties | Quadrant properties | ||||||
|---|---|---|---|---|---|---|---|
| Quadrant | DetID | PixID | Counts | Sigma | Mean | Median | Sigma |
| A | 10 | 83 | 78990 | 580.01 | 663 | 652 | 135.1 |
| A | 7 | 3 | 31788 | 230.53 | 663 | 652 | 135.1 |
| A | 15 | 174 | 25523 | 184.14 | 663 | 652 | 135.1 |
| B | 5 | 172 | 797442 | 6535.37 | 639 | 622 | 121.9 |
| B | 5 | 200 | 154289 | 1260.35 | 639 | 622 | 121.9 |
| B | 0 | 190 | 84835 | 690.7 | 639 | 622 | 121.9 |
| C | 0 | 10 | 320537 | 2138.79 | 643 | 648 | 149.6 |
| C | 15 | 214 | 239145 | 1594.6 | 643 | 648 | 149.6 |
| C | 9 | 54 | 168822 | 1124.42 | 643 | 648 | 149.6 |
| D | 8 | 195 | 1099433 | 7081.12 | 635 | 615 | 155.2 |
| D | 13 | 249 | 291721 | 1875.97 | 635 | 615 | 155.2 |
| D | 5 | 223 | 231881 | 1490.35 | 635 | 615 | 155.2 |
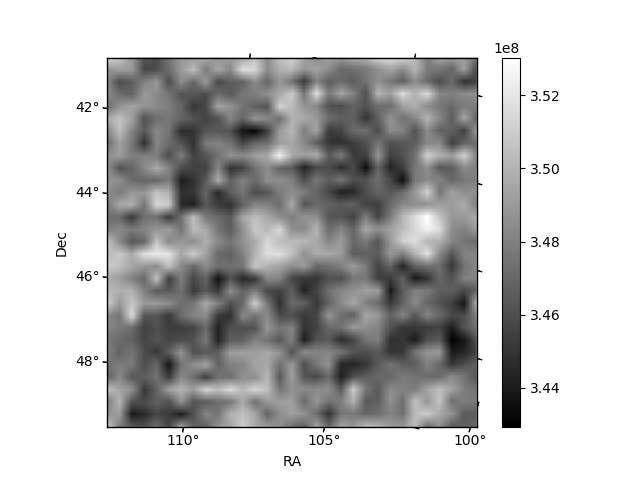
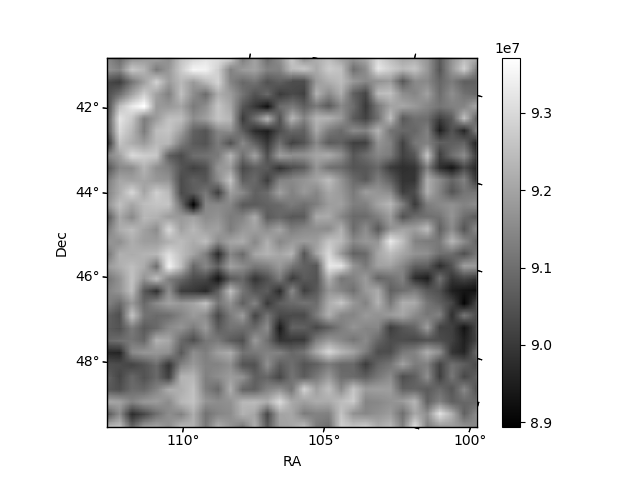
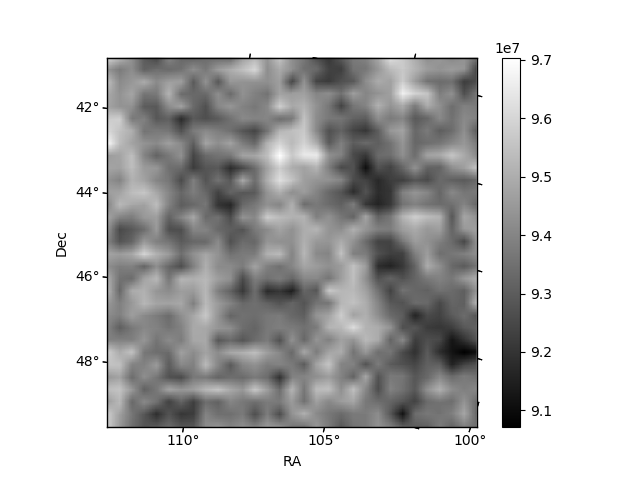
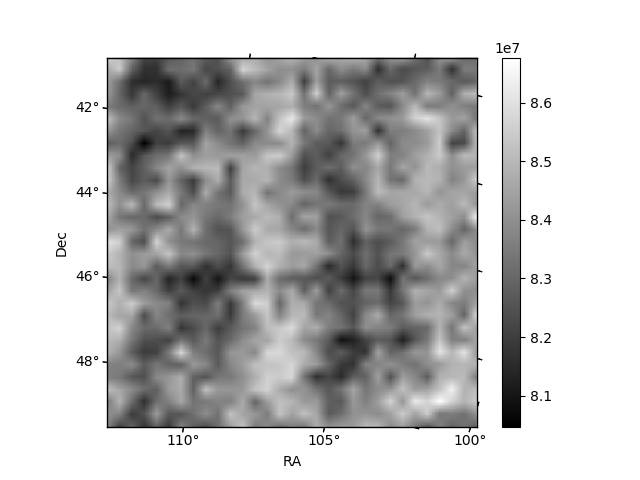
Histogram calculated using DETX and DETY for each event in the final _common_clean file
| Quadrant A | 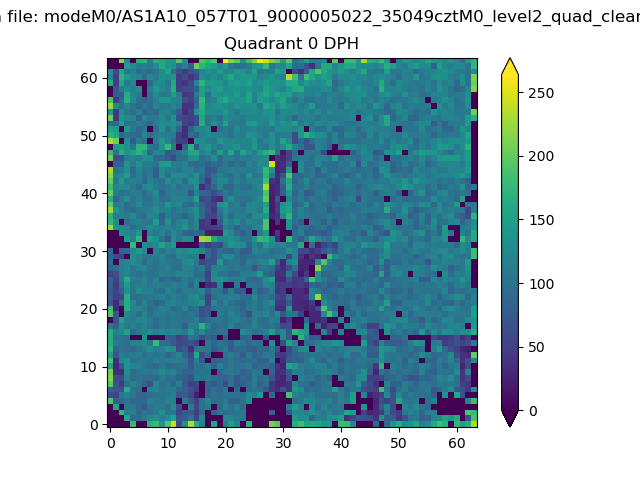 |
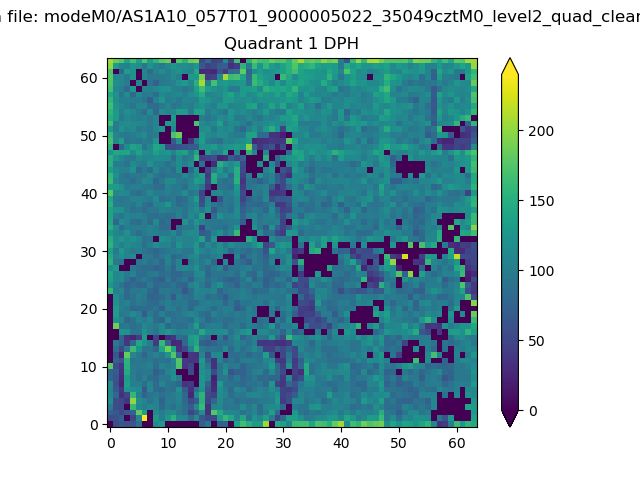 |
Quadrant B |
|---|---|---|---|
| Quadrant D | 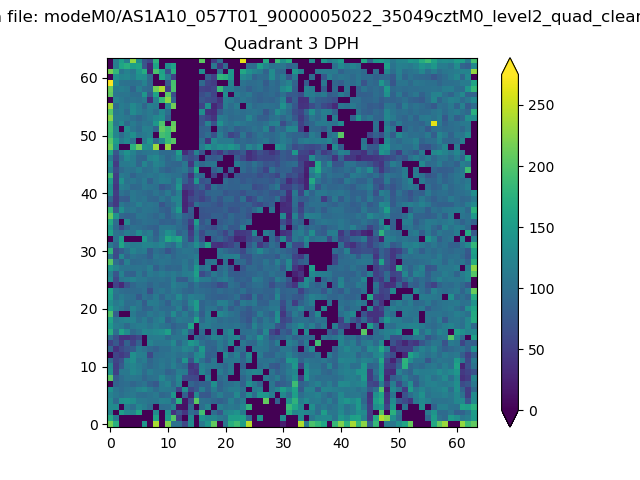 |
 |
Quadrant C |
| Plot type | Count rate plots | Images |
|---|---|---|
| Comparison with Poisson distribution Blue bars denote a histogram of data divided into 1 sec bins. Red curve is a Poisson curve with rate = median count rate of data. |
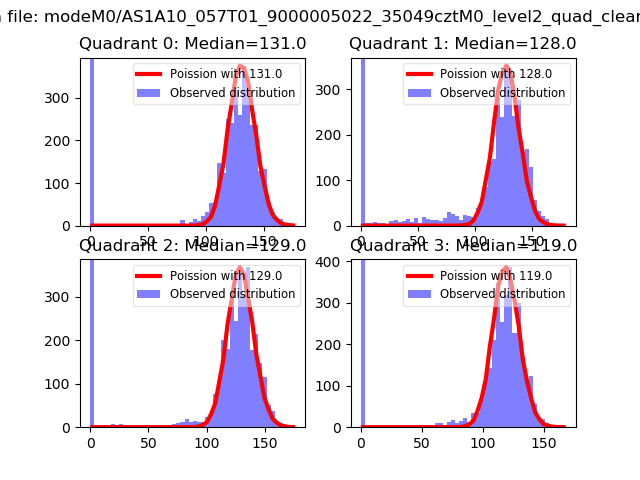 |
 |
| Quadrant-wise count rates Data is divided into 100 sec bins |
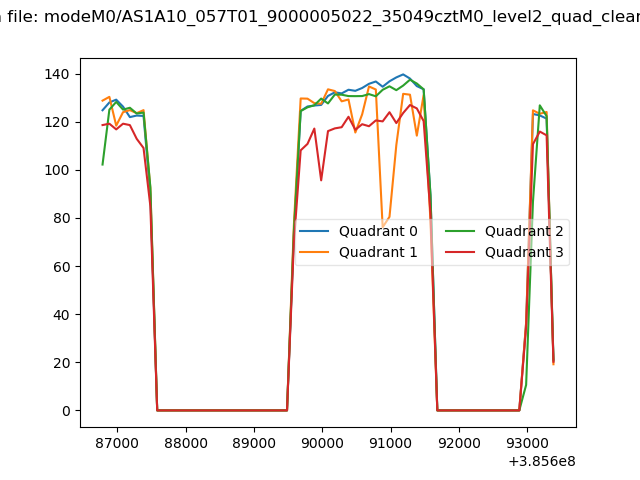 |
|
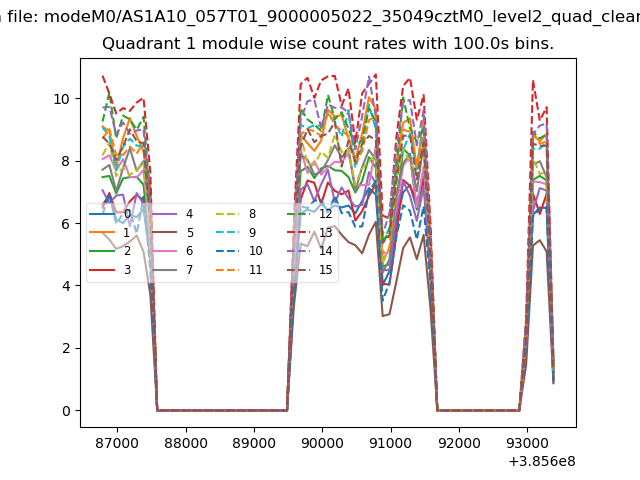
| Module-wise count rates for Quadrant A Data is divided into 100 sec bins |
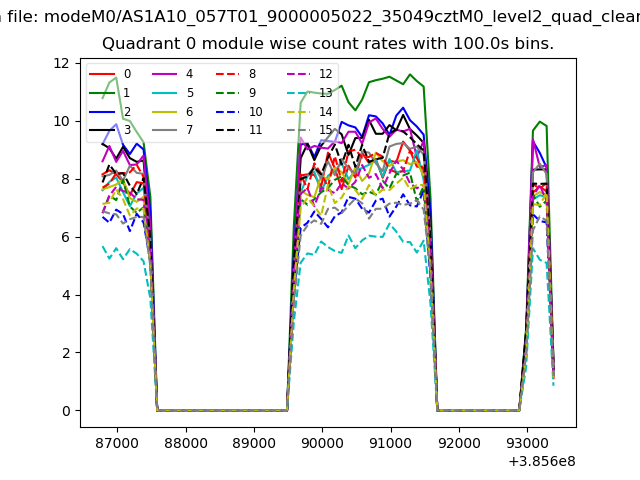 |
 |
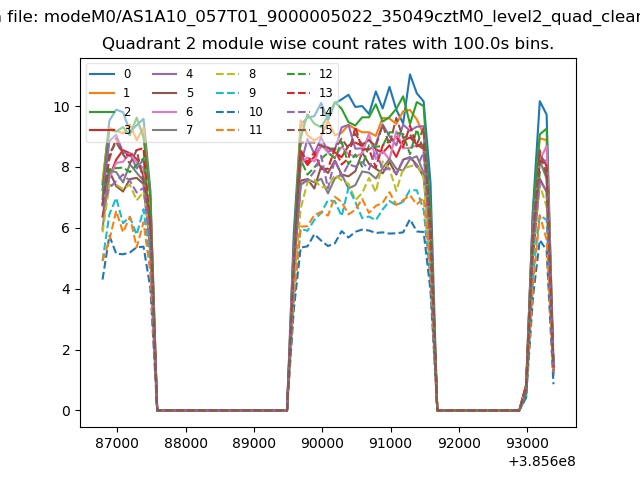
| Module-wise count rates for Quadrant B Data is divided into 100 sec bins |
 |
 |
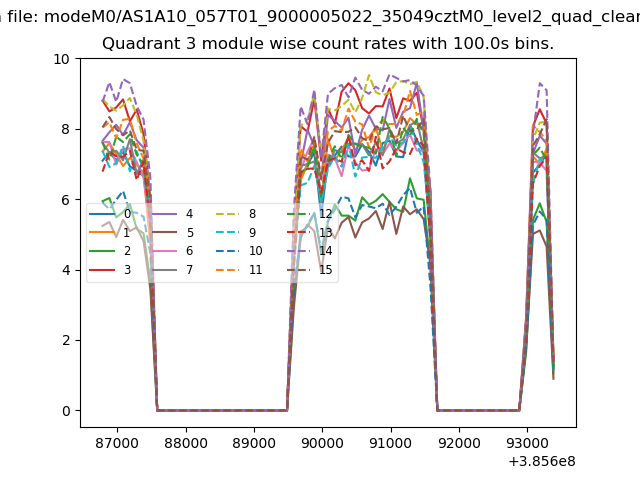
| Module-wise count rates for Quadrant C Data is divided into 100 sec bins |
 |
 |
| Module-wise count rates for Quadrant D Data is divided into 100 sec bins |
 |
 |
| Parameter | Plot |
|---|---|
| CZT HV Monitor | 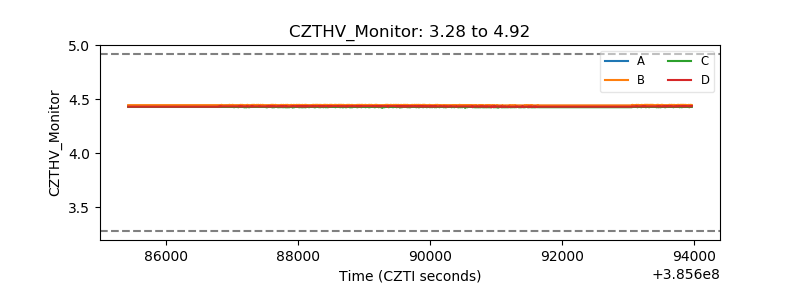 |
| D_VDD | 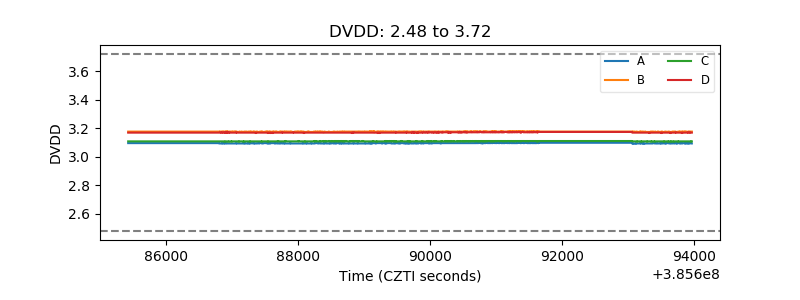 |
| Temperature 1 | 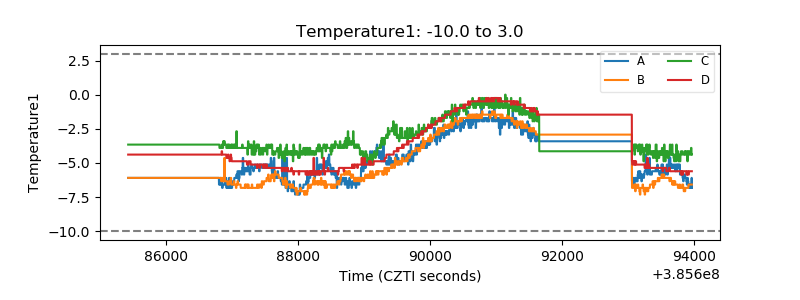 |
| Veto HV Monitor | 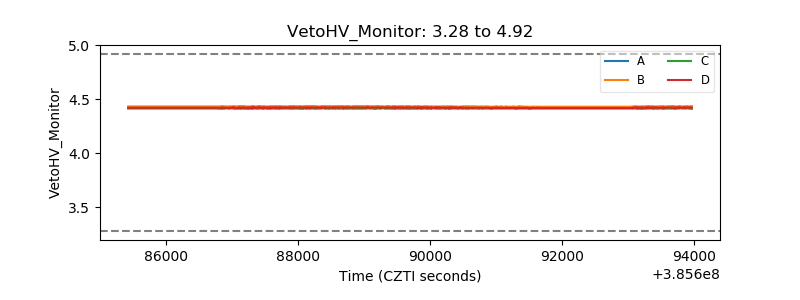 |
| Veto LLD |  |
| Alpha Counter | 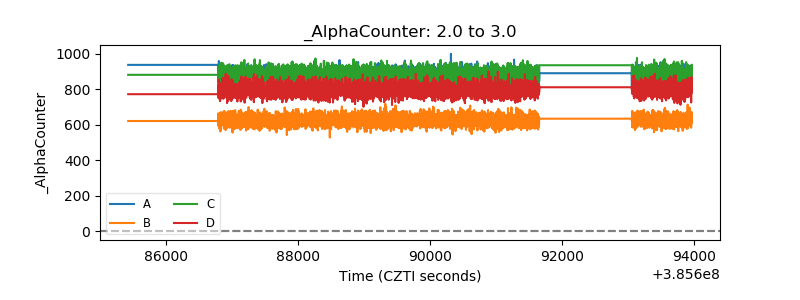 |
| _CPM_Rate | 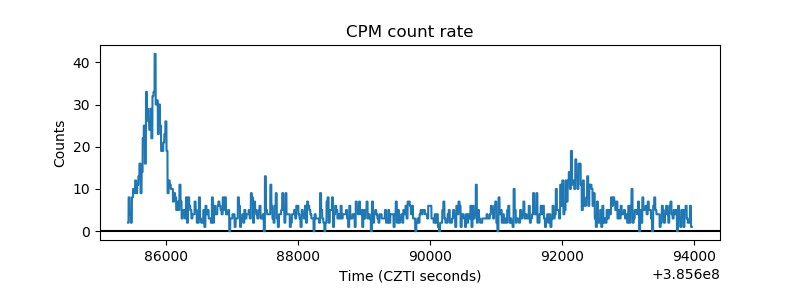 |
| CZT Counter | 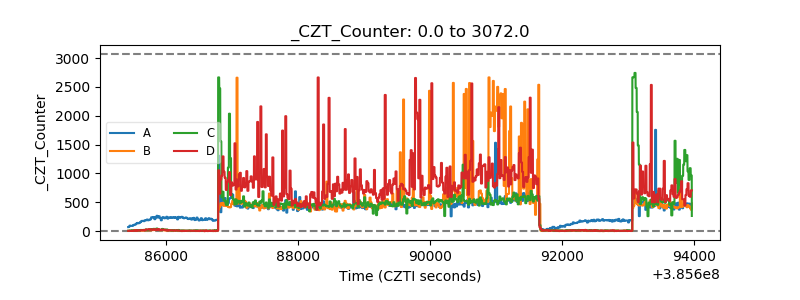 |
| +2.5 Volts monitor | 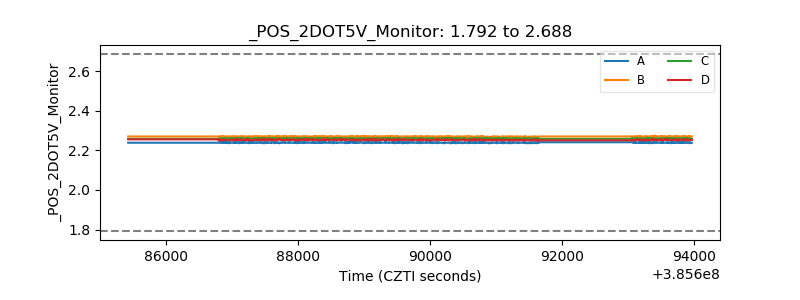 |
| +5 Volts monitor | 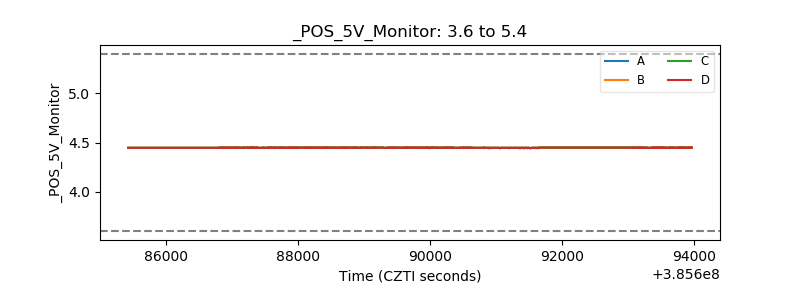 |
| _ROLL_ROT | 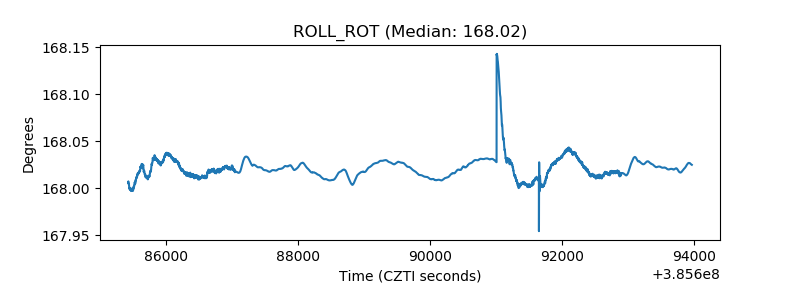 |
| _Roll_DEC | 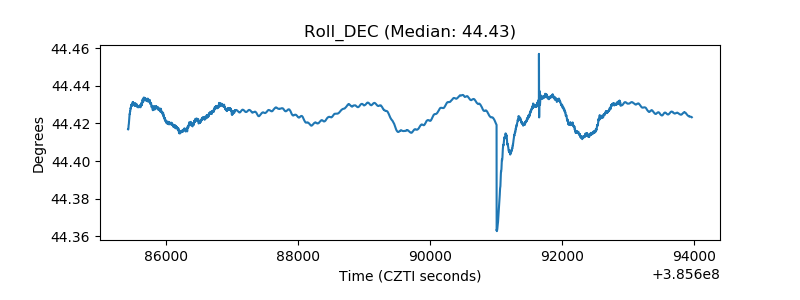 |
| _Roll_RA | 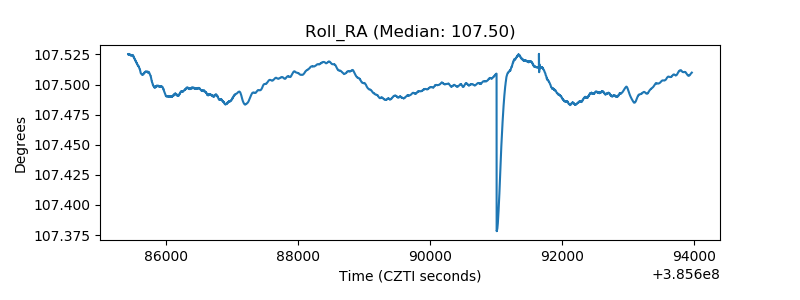 |
| Veto Counter | 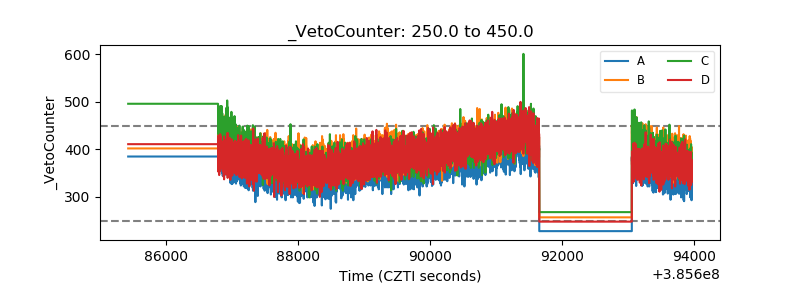 |