| Param | Original file | Final file |
|---|---|---|
| Filename | modeM0/AS1A10_057T01_9000005022_35047cztM0_level2.evt | modeM0/AS1A10_057T01_9000005022_35047cztM0_level2_quad_clean.evt |
| Size (bytes) | 409,320,000 | 62,043,840 |
| Size | 390.4 MB | 59.2 MB |
| Events in quadrant A | 2,351,702 | 393,587 |
| Events in quadrant B | 2,564,678 | 399,005 |
| Events in quadrant C | 2,805,151 | 391,635 |
| Events in quadrant D | 4,336,661 | 345,177 |
| Mode M0 | |||
|---|---|---|---|
| Quadrant | BADHDUFLAG | Total packets | Discarded packets |
| A | 0 | 10260 | 3 |
| B | 0 | 10793 | 2 |
| C | 0 | 11301 | 2 |
| D | 0 | 16448 | 2 |
| Mode M9 | |||
|---|---|---|---|
| Quadrant | BADHDUFLAG | Total packets | Discarded packets |
| A | 0 | 27 | 0 |
| B | 0 | 27 | 0 |
| C | 0 | 27 | 0 |
| D | 0 | 28 | 0 |
| Mode SS | |||
|---|---|---|---|
| Quadrant | BADHDUFLAG | Total packets | Discarded packets |
| A | 0 | 102 | 0 |
| B | 0 | 102 | 0 |
| C | 0 | 102 | 0 |
| D | 0 | 102 | 0 |
| Quadrant | Total seconds | Saturated seconds | Saturation percentage |
|---|---|---|---|
| A | 4975 | 7 | 0.140704% |
| B | 4975 | 70 | 1.407035% |
| C | 4975 | 59 | 1.185930% |
| D | 4975 | 291 | 5.849246% |
Noise dominated data is calculated using 1-second bins in cleaned event files. If a bin has >2000 counts, and if more than 50% of those come from <1% of pixels, then it is considered to be noise-dominated and hence unusable.
| Quadrant | # 1 sec bins | Bins with >0 counts | Bins with >2000 counts | High rate bins dominated by noise | Noise dominated (total time) | Noise dominated (detector-on time) | Marked lightcurve |
|---|---|---|---|---|---|---|---|
| A | 6978 | 4976 | 0 | 0 | 0.00% | 0.00% | 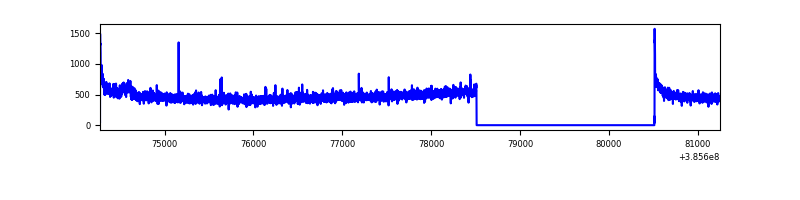 |
| B | 6978 | 4976 | 51 | 51 | 0.73% | 1.02% | 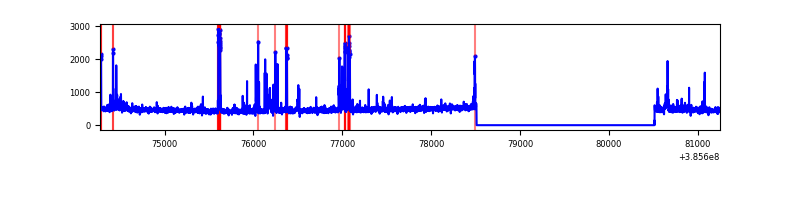 |
| C | 6978 | 4976 | 60 | 60 | 0.86% | 1.21% | 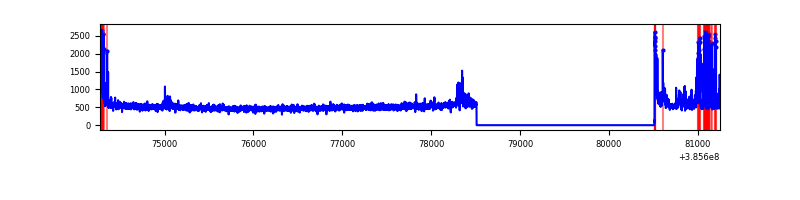 |
| D | 6978 | 4976 | 289 | 289 | 4.14% | 5.81% | 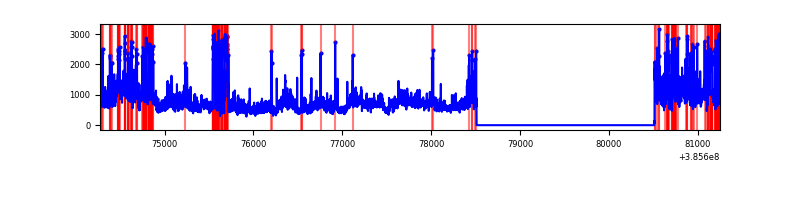 |
Top three noisy pixels from each quadrant. If the there are fewer than three noisy pixels in the level2.evt file, extra rows are filled as -1
| Pixel properties | Quadrant properties | ||||||
|---|---|---|---|---|---|---|---|
| Quadrant | DetID | PixID | Counts | Sigma | Mean | Median | Sigma |
| A | 10 | 83 | 73316 | 625.87 | 579 | 569 | 116.2 |
| A | 15 | 169 | 20633 | 172.62 | 579 | 569 | 116.2 |
| A | 13 | 6 | 11731 | 96.03 | 579 | 569 | 116.2 |
| B | 5 | 172 | 143547 | 1298.56 | 576 | 562 | 110.1 |
| B | 5 | 200 | 106690 | 963.83 | 576 | 562 | 110.1 |
| B | 4 | 232 | 44029 | 394.76 | 576 | 562 | 110.1 |
| C | 3 | 233 | 241722 | 1810.44 | 571 | 575 | 133.2 |
| C | 15 | 214 | 206855 | 1548.68 | 571 | 575 | 133.2 |
| C | 0 | 10 | 107586 | 803.4 | 571 | 575 | 133.2 |
| D | 8 | 195 | 1155837 | 8695.22 | 549 | 534 | 132.9 |
| D | 13 | 249 | 407820 | 3065.38 | 549 | 534 | 132.9 |
| D | 12 | 227 | 160498 | 1203.95 | 549 | 534 | 132.9 |
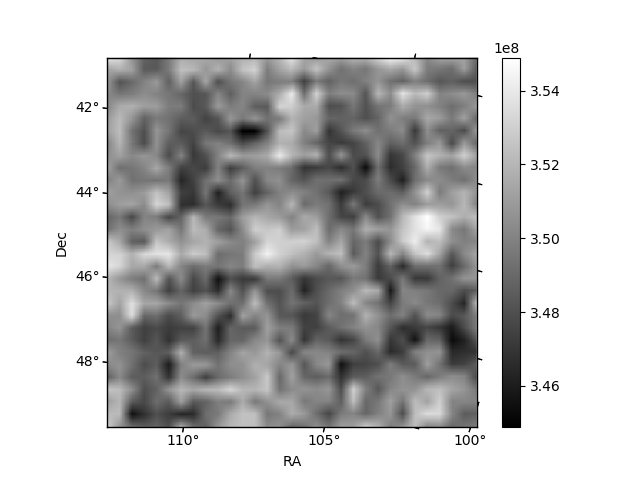
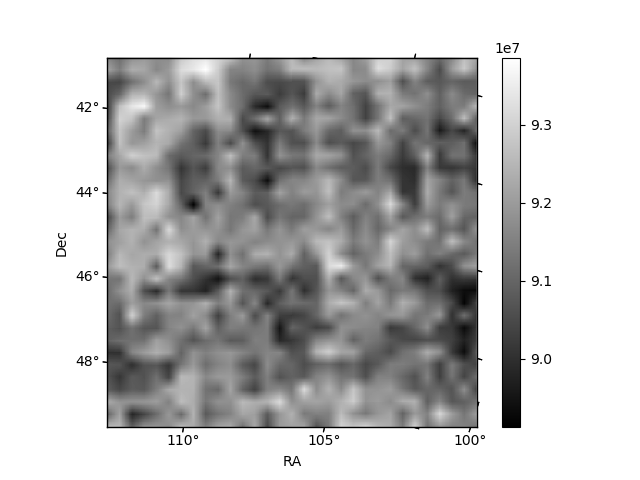
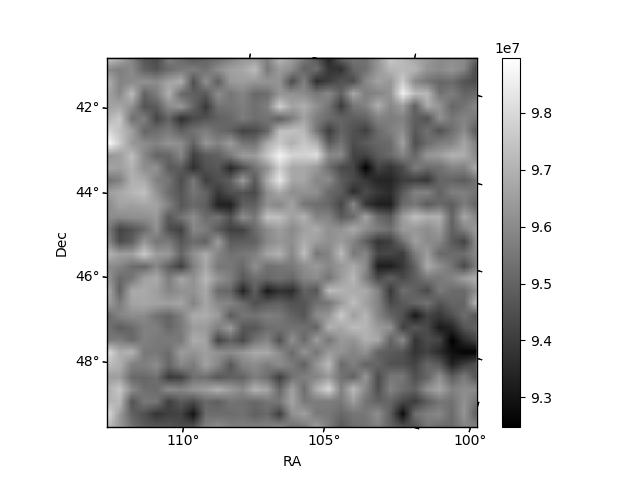
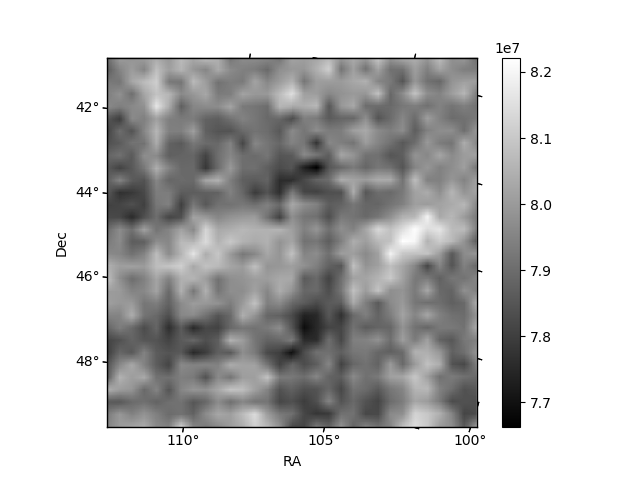
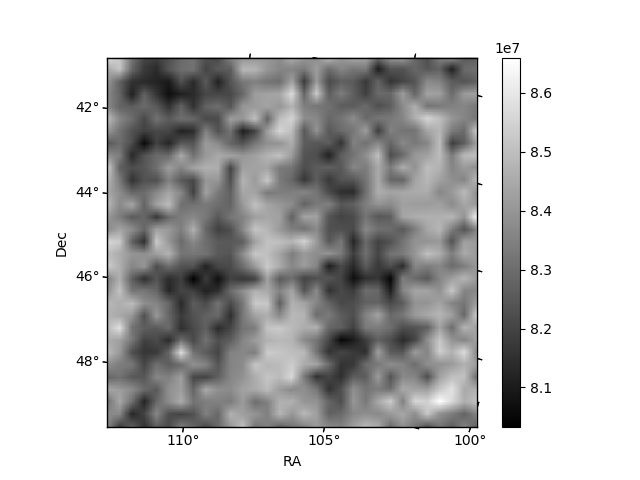
Histogram calculated using DETX and DETY for each event in the final _common_clean file
| Quadrant A | 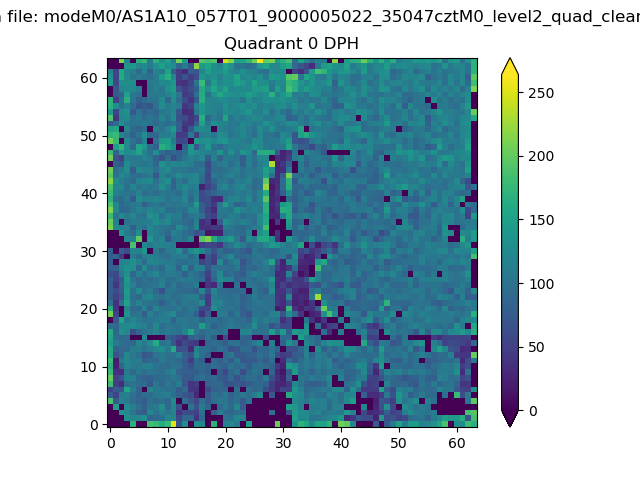 |
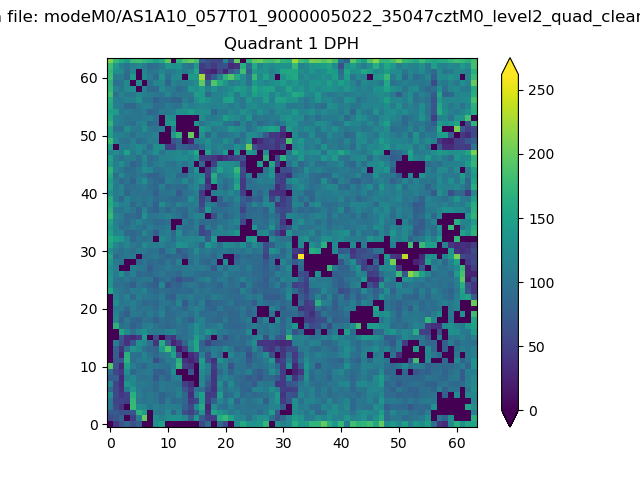 |
Quadrant B |
|---|---|---|---|
| Quadrant D | 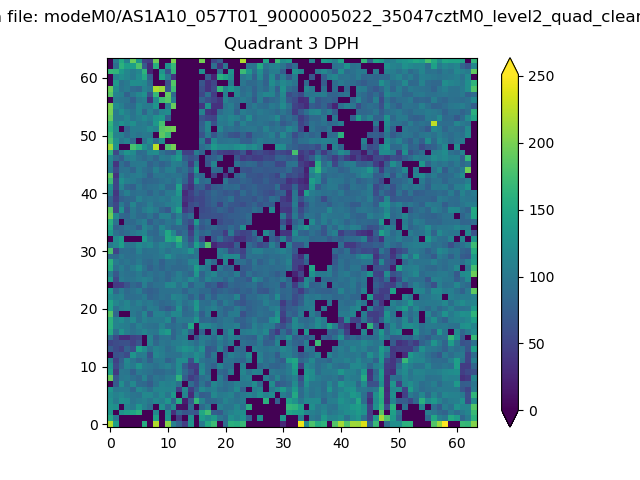 |
 |
Quadrant C |
| Plot type | Count rate plots | Images |
|---|---|---|
| Comparison with Poisson distribution Blue bars denote a histogram of data divided into 1 sec bins. Red curve is a Poisson curve with rate = median count rate of data. |
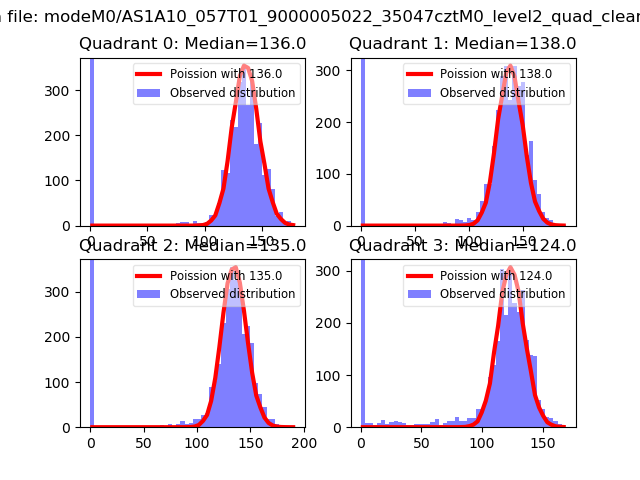 |
 |
| Quadrant-wise count rates Data is divided into 100 sec bins |
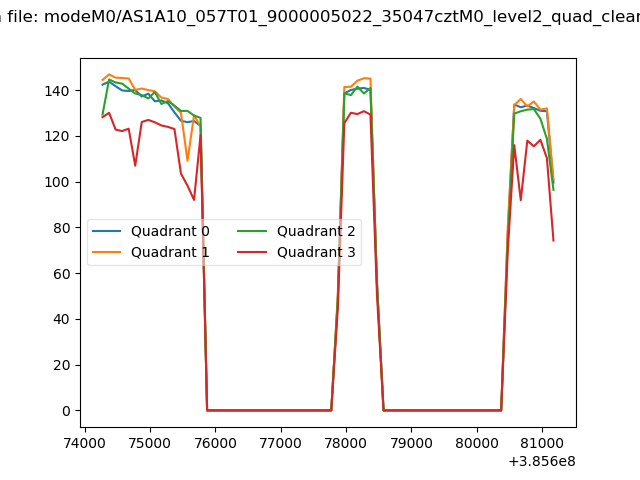 |
|
| Module-wise count rates for Quadrant A Data is divided into 100 sec bins |
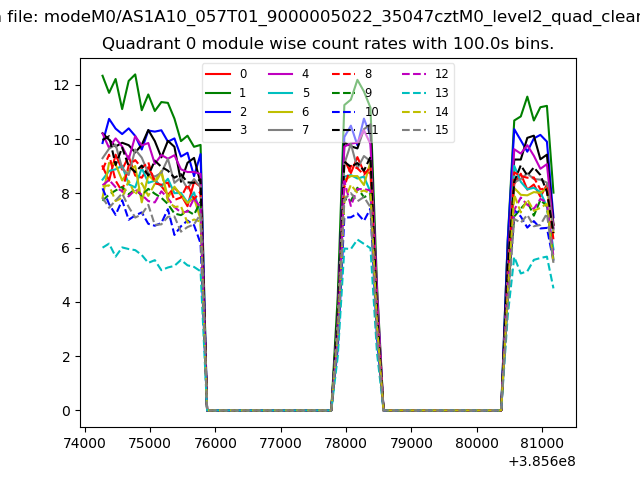 |
 |
| Module-wise count rates for Quadrant B Data is divided into 100 sec bins |
 |
 |
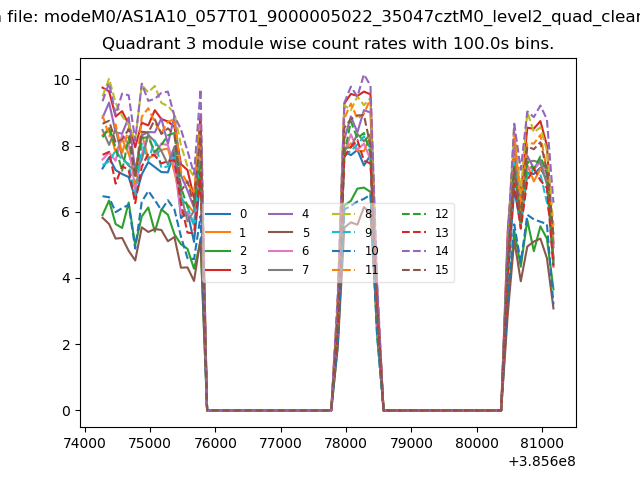
| Module-wise count rates for Quadrant C Data is divided into 100 sec bins |
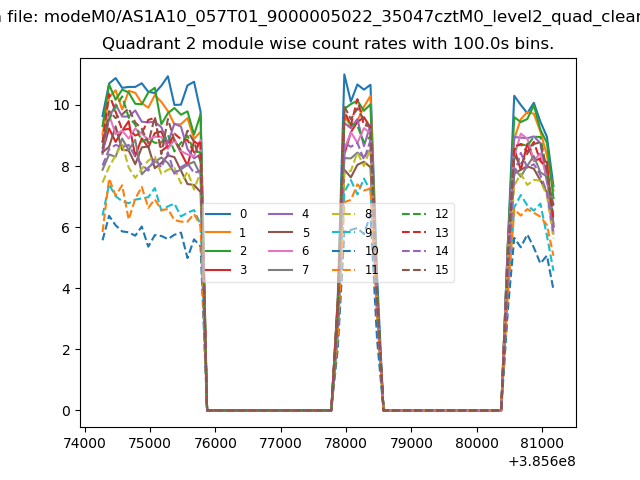 |
 |
| Module-wise count rates for Quadrant D Data is divided into 100 sec bins |
 |
 |
| Parameter | Plot |
|---|---|
| CZT HV Monitor | 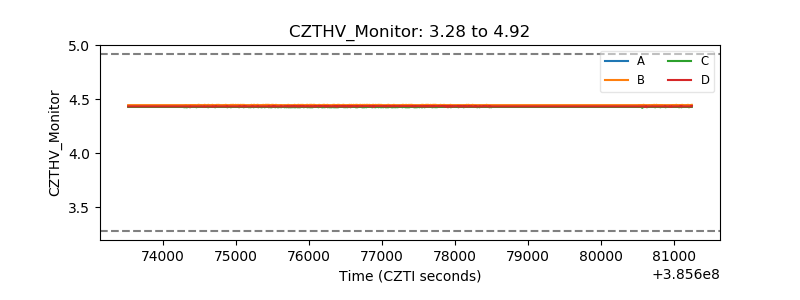 |
| D_VDD | 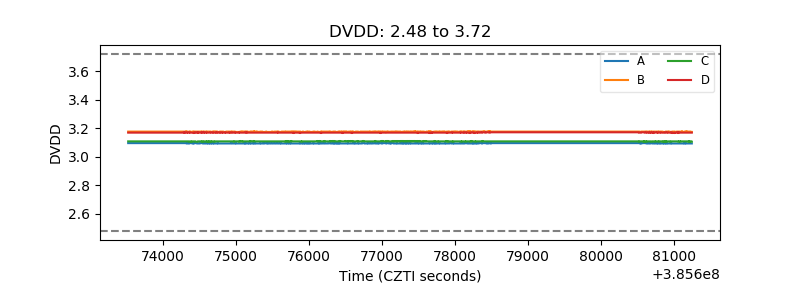 |
| Temperature 1 | 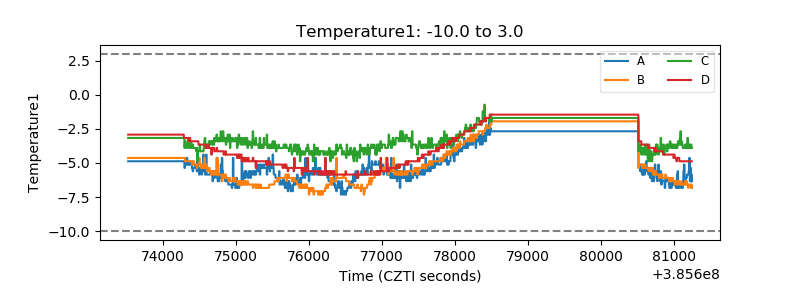 |
| Veto HV Monitor | 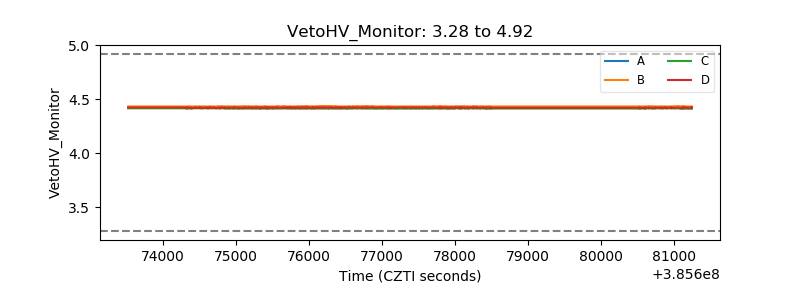 |
| Veto LLD | 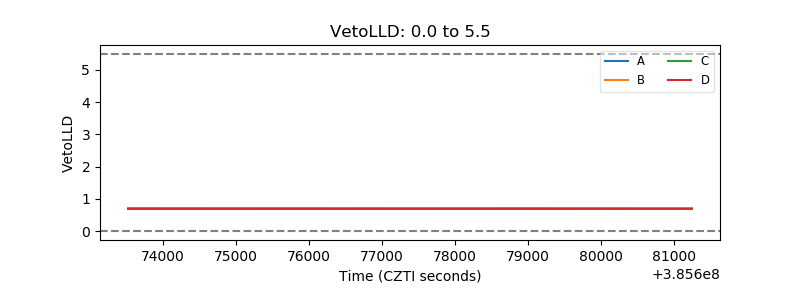 |
| Alpha Counter | 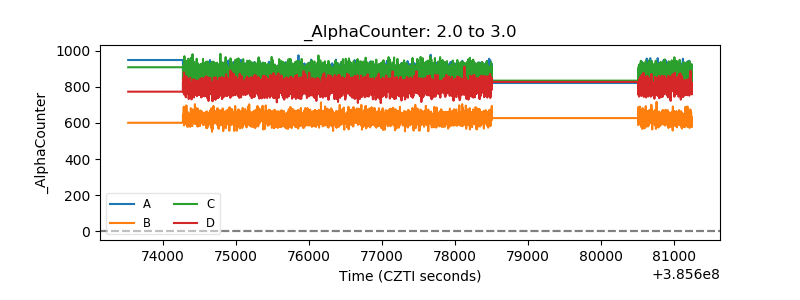 |
| _CPM_Rate | 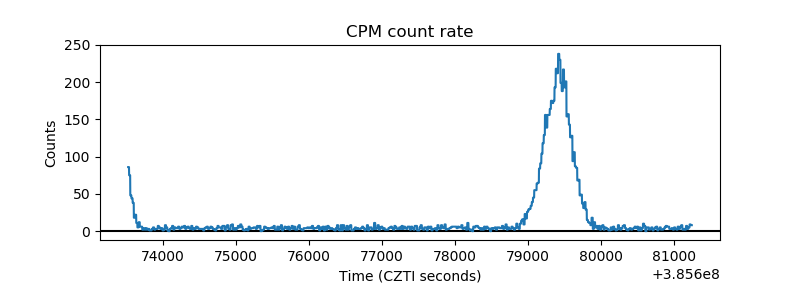 |
| CZT Counter | 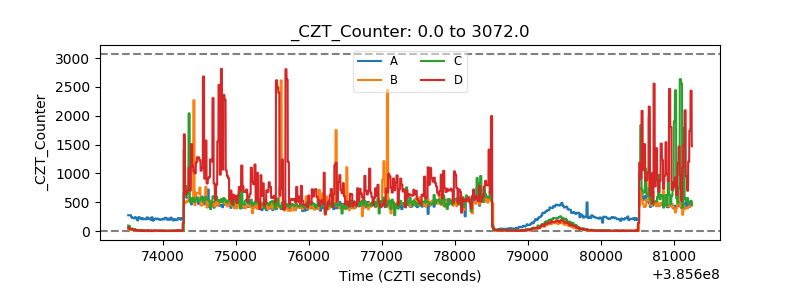 |
| +2.5 Volts monitor |  |
| +5 Volts monitor | 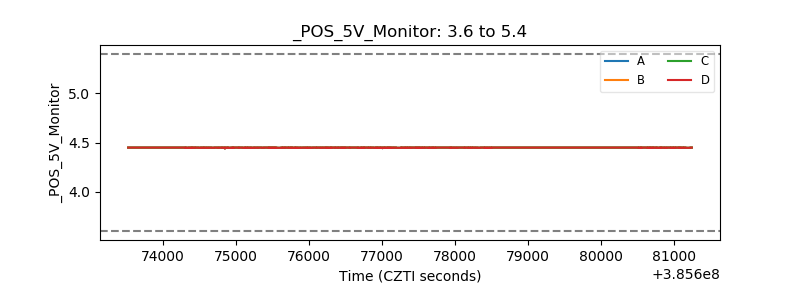 |
| _ROLL_ROT | 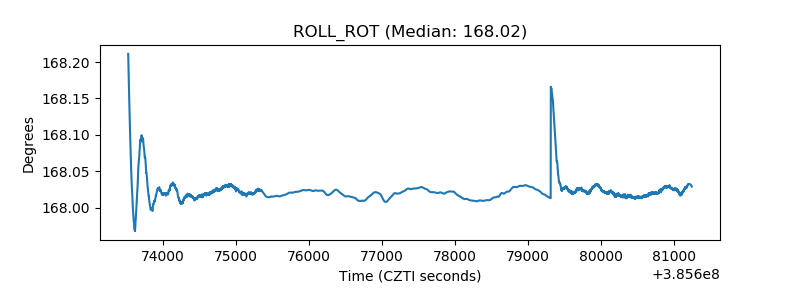 |
| _Roll_DEC | 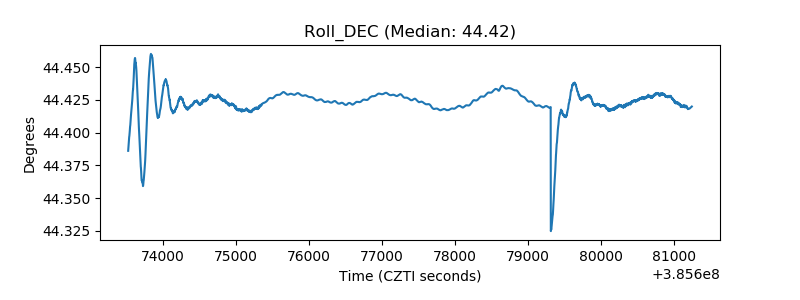 |
| _Roll_RA |  |
| Veto Counter | 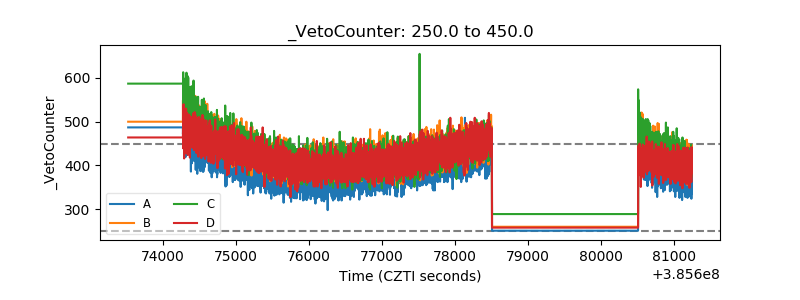 |