| Param | Original file | Final file |
|---|---|---|
| Filename | modeM0/AS1A10_053T44_9000005020_35045cztM0_level2.evt | modeM0/AS1A10_053T44_9000005020_35045cztM0_level2_quad_clean.evt |
| Size (bytes) | 195,868,800 | 42,408,000 |
| Size | 186.8 MB | 40.4 MB |
| Events in quadrant A | 1,160,342 | 281,949 |
| Events in quadrant B | 1,324,024 | 285,589 |
| Events in quadrant C | 1,321,707 | 286,418 |
| Events in quadrant D | 1,969,503 | 266,025 |
| Mode M0 | |||
|---|---|---|---|
| Quadrant | BADHDUFLAG | Total packets | Discarded packets |
| A | 0 | 4803 | 2 |
| B | 0 | 5252 | 1 |
| C | 0 | 5261 | 1 |
| D | 0 | 7394 | 1 |
| Mode M9 | |||
|---|---|---|---|
| Quadrant | BADHDUFLAG | Total packets | Discarded packets |
| A | 0 | 21 | 0 |
| B | 0 | 21 | 0 |
| C | 0 | 21 | 0 |
| D | 0 | 21 | 0 |
| Mode SS | |||
|---|---|---|---|
| Quadrant | BADHDUFLAG | Total packets | Discarded packets |
| A | 0 | 48 | 0 |
| B | 0 | 48 | 0 |
| C | 0 | 48 | 0 |
| D | 0 | 48 | 0 |
| Quadrant | Total seconds | Saturated seconds | Saturation percentage |
|---|---|---|---|
| A | 2270 | 9 | 0.396476% |
| B | 2270 | 56 | 2.466960% |
| C | 2270 | 37 | 1.629956% |
| D | 2270 | 98 | 4.317181% |
Noise dominated data is calculated using 1-second bins in cleaned event files. If a bin has >2000 counts, and if more than 50% of those come from <1% of pixels, then it is considered to be noise-dominated and hence unusable.
| Quadrant | # 1 sec bins | Bins with >0 counts | Bins with >2000 counts | High rate bins dominated by noise | Noise dominated (total time) | Noise dominated (detector-on time) | Marked lightcurve |
|---|---|---|---|---|---|---|---|
| A | 4394 | 2271 | 2 | 2 | 0.05% | 0.09% | 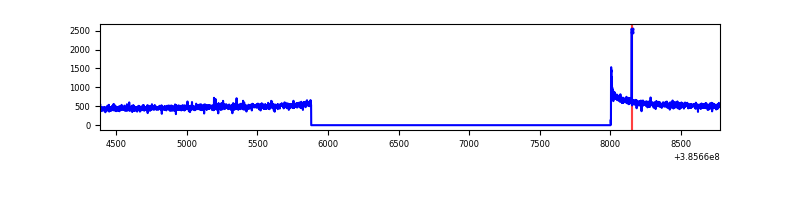 |
| B | 4394 | 2271 | 52 | 52 | 1.18% | 2.29% | 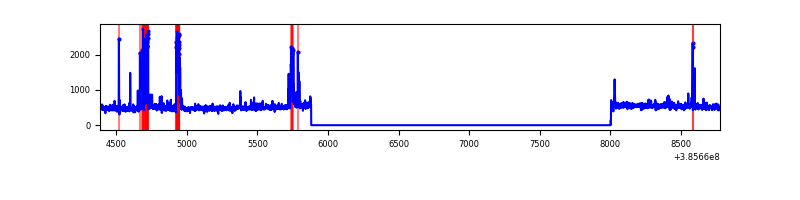 |
| C | 4394 | 2271 | 29 | 29 | 0.66% | 1.28% | 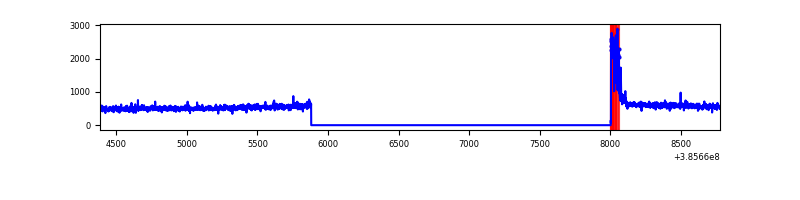 |
| D | 4394 | 2271 | 82 | 82 | 1.87% | 3.61% | 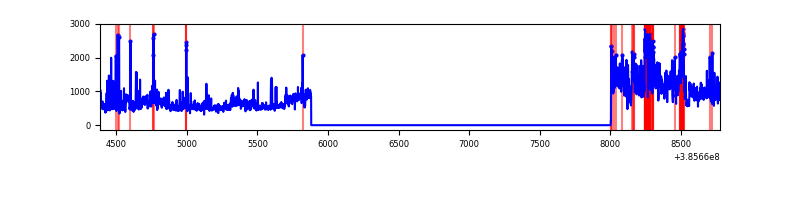 |
Top three noisy pixels from each quadrant. If the there are fewer than three noisy pixels in the level2.evt file, extra rows are filled as -1
| Pixel properties | Quadrant properties | ||||||
|---|---|---|---|---|---|---|---|
| Quadrant | DetID | PixID | Counts | Sigma | Mean | Median | Sigma |
| A | 10 | 83 | 36269 | 610.35 | 287 | 281 | 59.0 |
| A | 15 | 169 | 7003 | 114.0 | 287 | 281 | 59.0 |
| A | 13 | 6 | 5290 | 84.95 | 287 | 281 | 59.0 |
| B | 5 | 172 | 175704 | 3146.29 | 284 | 277 | 55.8 |
| B | 5 | 200 | 10028 | 174.88 | 284 | 277 | 55.8 |
| B | 15 | 32 | 9621 | 167.59 | 284 | 277 | 55.8 |
| C | 0 | 10 | 99613 | 1519.33 | 282 | 284 | 65.4 |
| C | 15 | 214 | 95364 | 1454.34 | 282 | 284 | 65.4 |
| C | 14 | 67 | 24158 | 365.17 | 282 | 284 | 65.4 |
| D | 8 | 195 | 616693 | 9001.39 | 277 | 269 | 68.5 |
| D | 5 | 223 | 110704 | 1612.64 | 277 | 269 | 68.5 |
| D | 2 | 250 | 27806 | 402.11 | 277 | 269 | 68.5 |
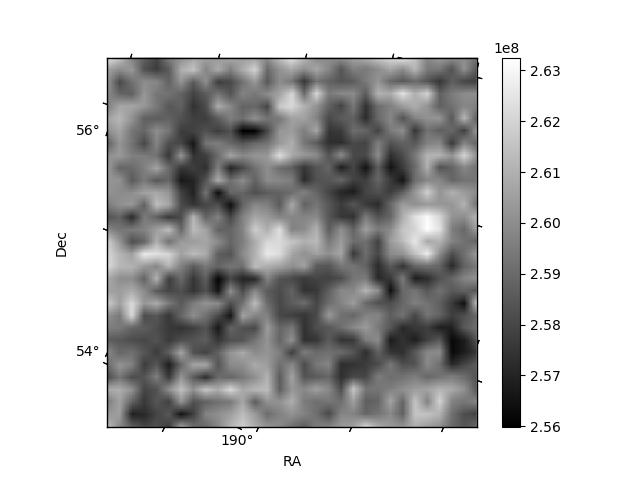
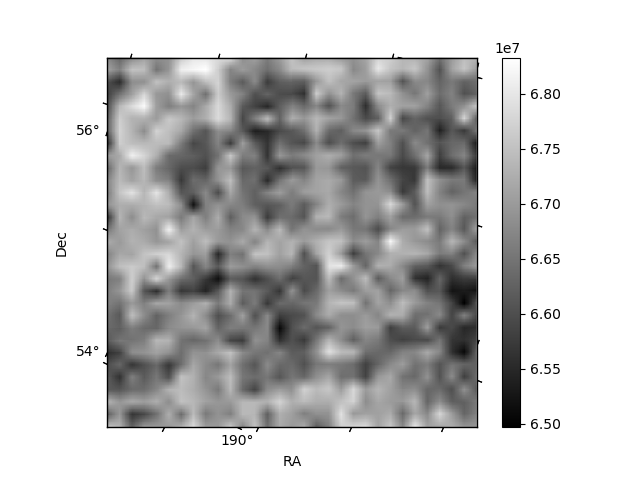
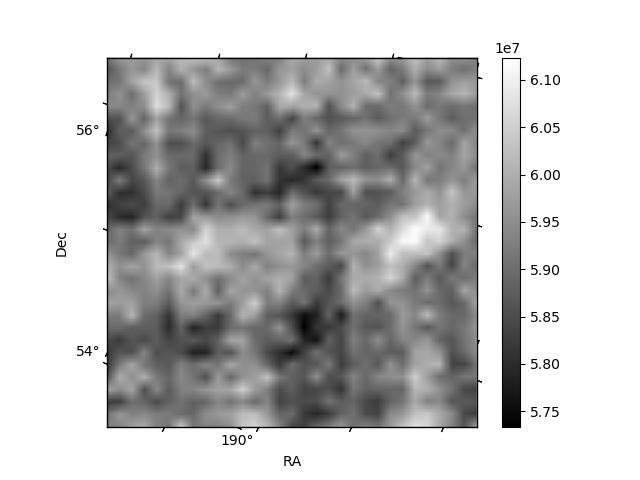
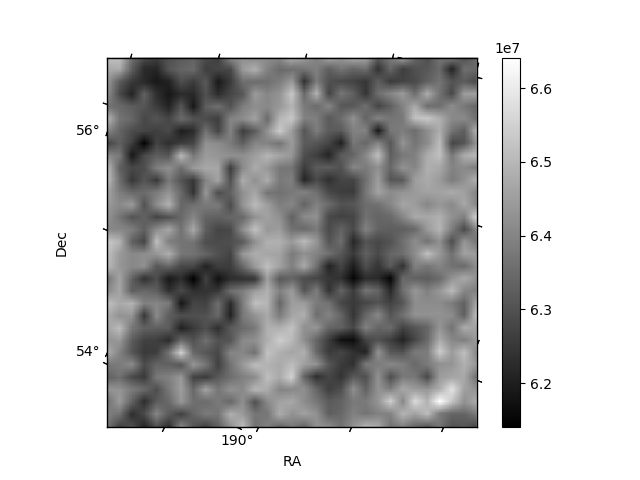
Histogram calculated using DETX and DETY for each event in the final _common_clean file
| Quadrant A | 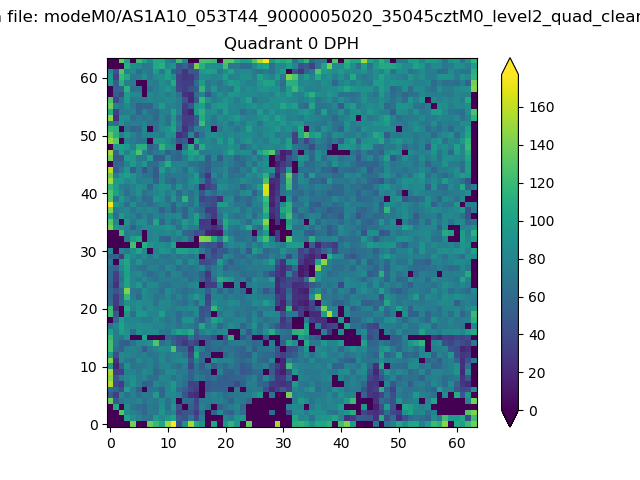 |
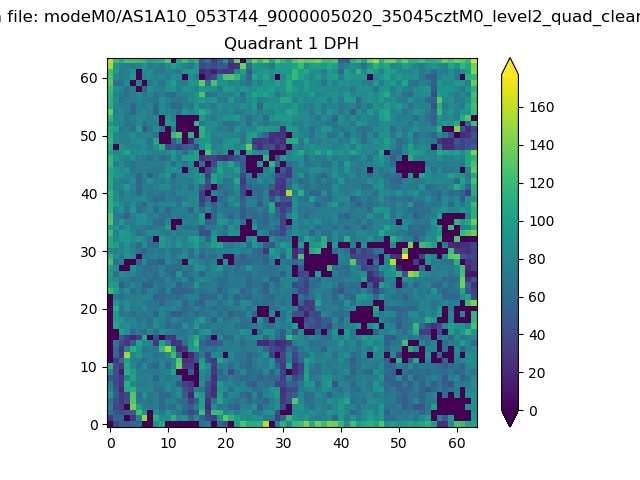 |
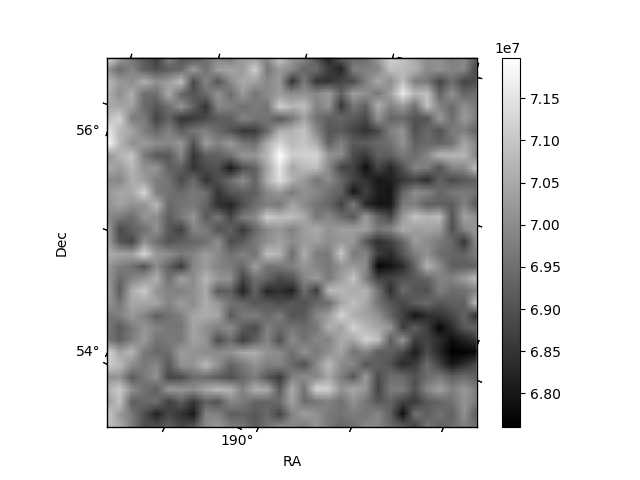
Quadrant B |
|---|---|---|---|
| Quadrant D | 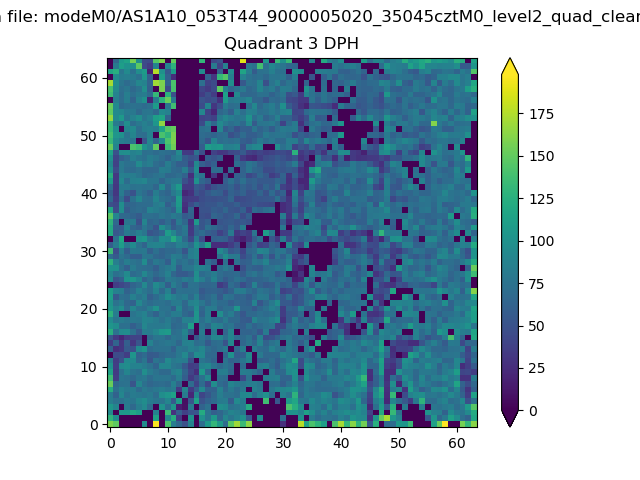 |
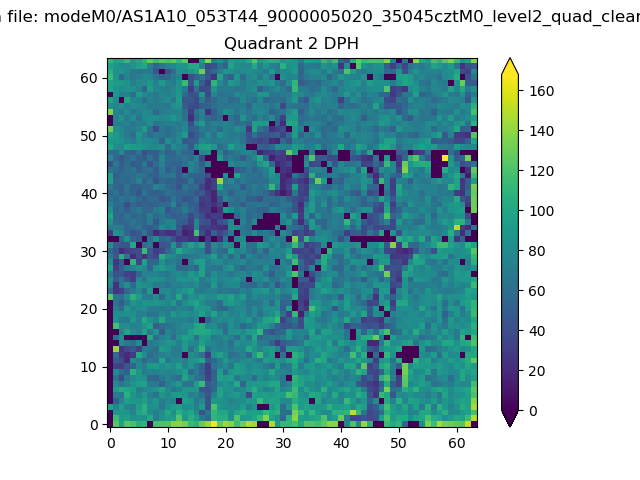 |
Quadrant C |
| Plot type | Count rate plots | Images |
|---|---|---|
| Comparison with Poisson distribution Blue bars denote a histogram of data divided into 1 sec bins. Red curve is a Poisson curve with rate = median count rate of data. |
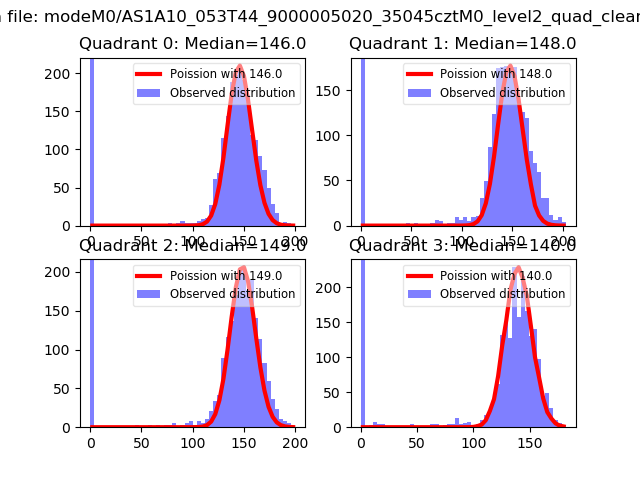 |
 |
| Quadrant-wise count rates Data is divided into 100 sec bins |
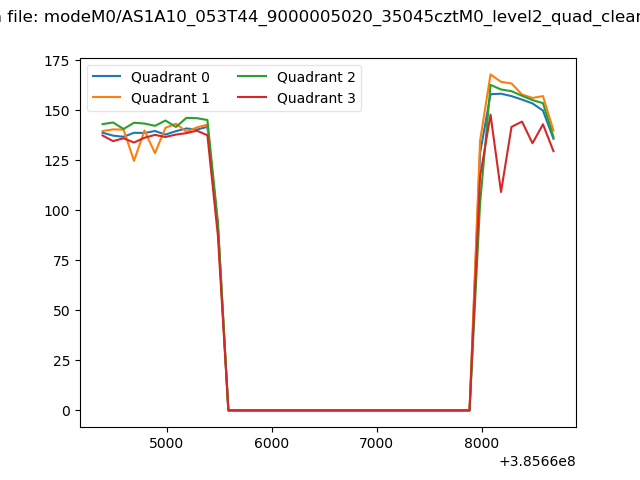 |
|
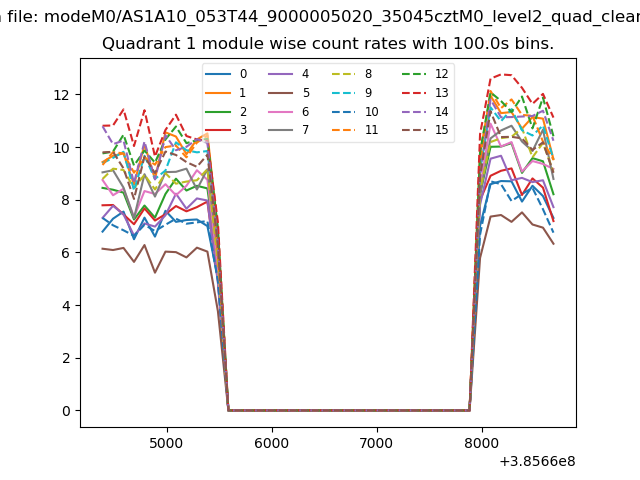
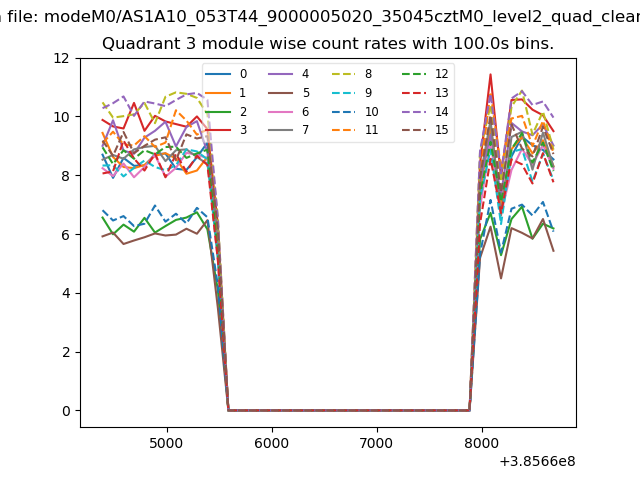
| Module-wise count rates for Quadrant A Data is divided into 100 sec bins |
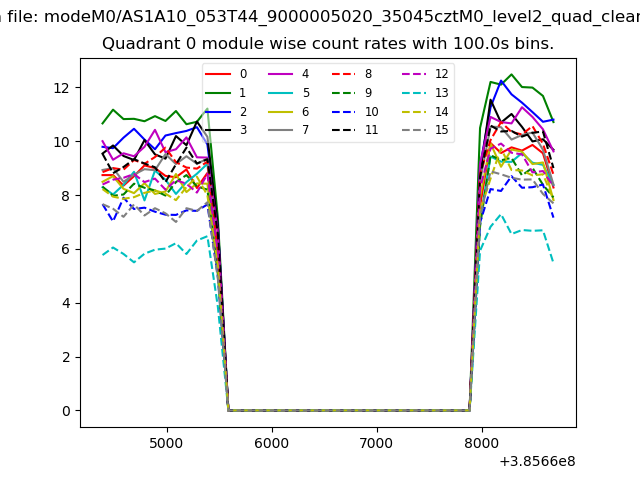 |
 |
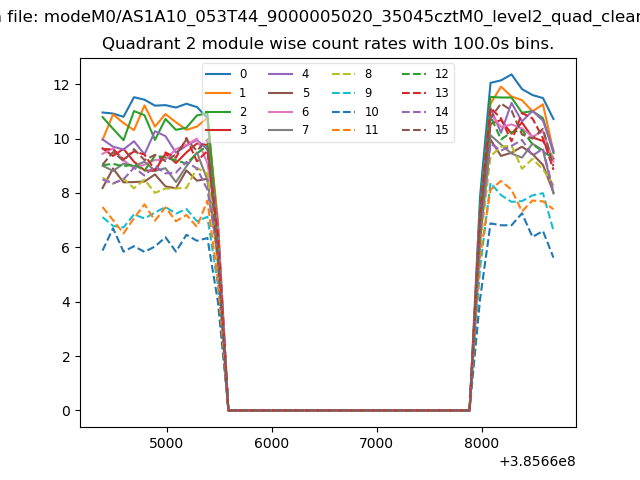
| Module-wise count rates for Quadrant B Data is divided into 100 sec bins |
 |
 |
| Module-wise count rates for Quadrant C Data is divided into 100 sec bins |
 |
 |
| Module-wise count rates for Quadrant D Data is divided into 100 sec bins |
 |
 |
| Parameter | Plot |
|---|---|
| CZT HV Monitor | 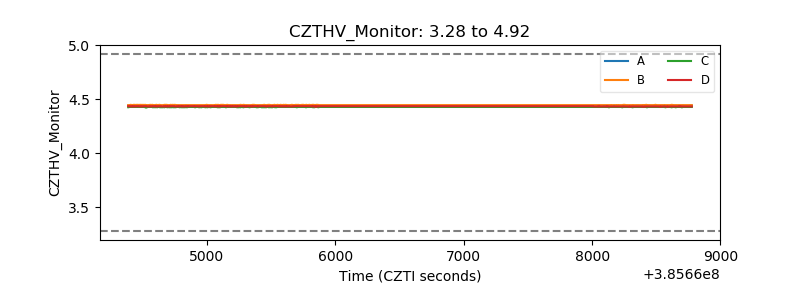 |
| D_VDD | 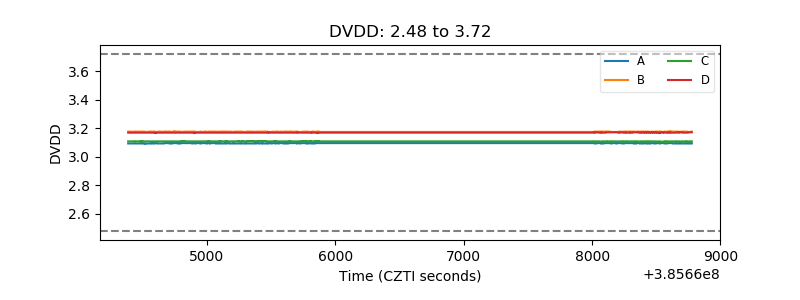 |
| Temperature 1 | 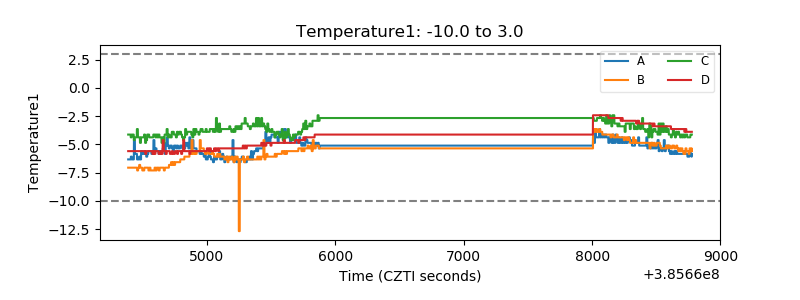 |
| Veto HV Monitor | 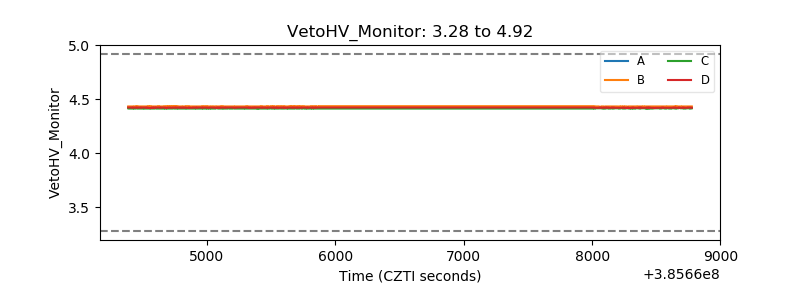 |
| Veto LLD | 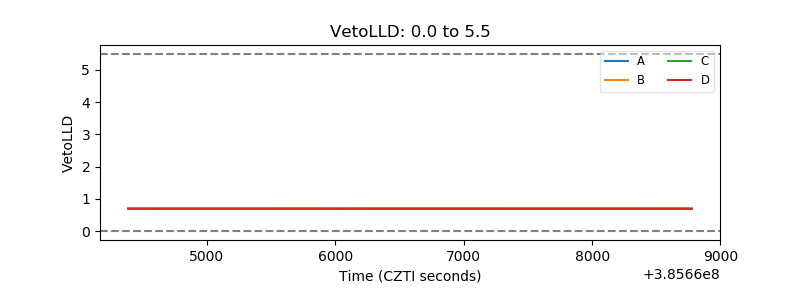 |
| Alpha Counter |  |
| _CPM_Rate | 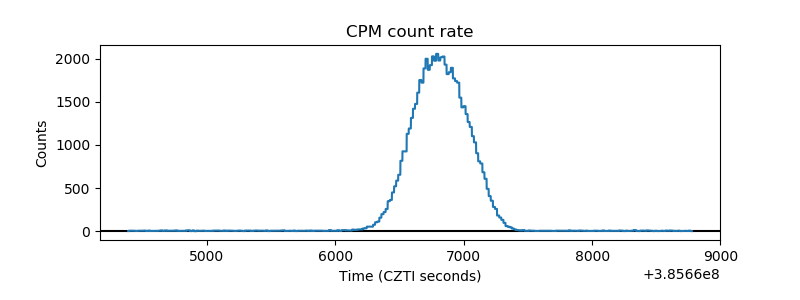 |
| CZT Counter | 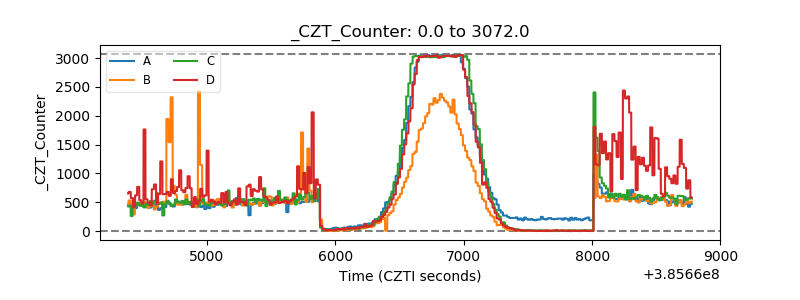 |
| +2.5 Volts monitor | 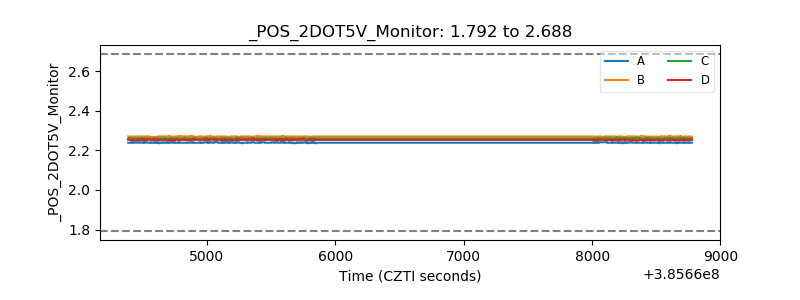 |
| +5 Volts monitor | 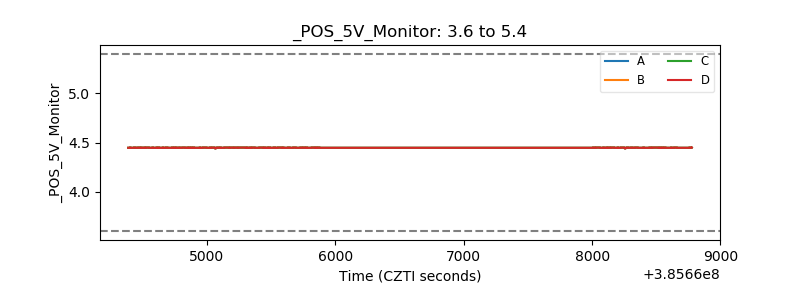 |
| _ROLL_ROT | 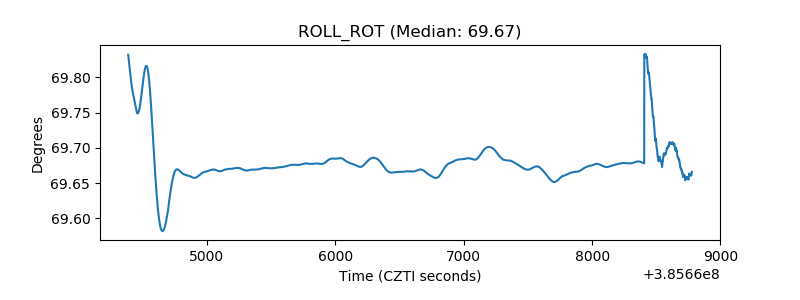 |
| _Roll_DEC | 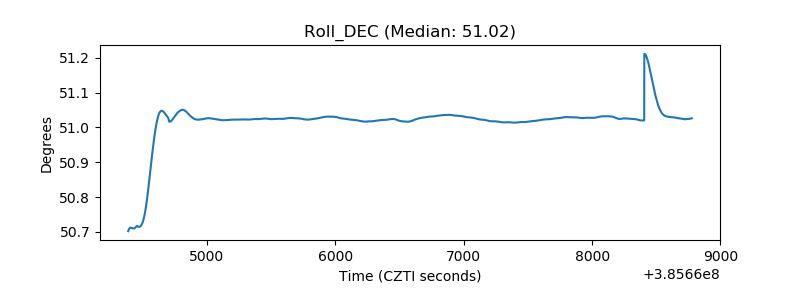 |
| _Roll_RA | 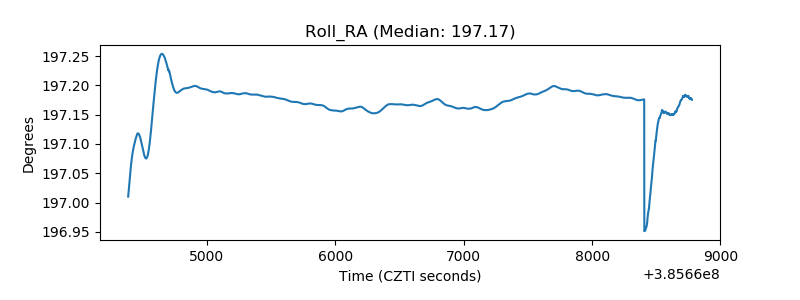 |
| Veto Counter | 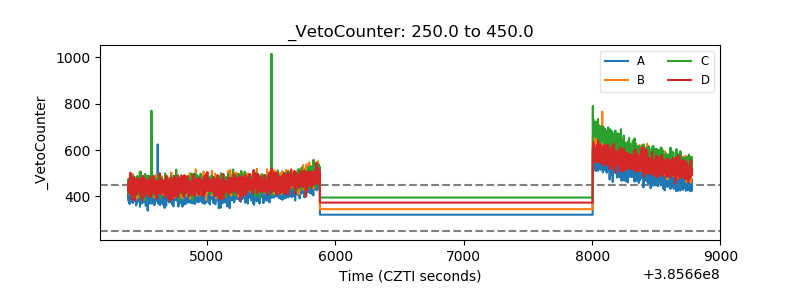 |