| Param | Original file | Final file |
|---|---|---|
| Filename | modeM0/AS1T05_010T01_9000005016_35031cztM0_level2.evt | modeM0/AS1T05_010T01_9000005016_35031cztM0_level2_quad_clean.evt |
| Size (bytes) | 415,509,120 | 83,364,480 |
| Size | 396.3 MB | 79.5 MB |
| Events in quadrant A | 2,610,970 | 557,861 |
| Events in quadrant B | 2,734,842 | 568,633 |
| Events in quadrant C | 2,806,753 | 540,239 |
| Events in quadrant D | 4,095,660 | 511,347 |
| Mode M0 | |||
|---|---|---|---|
| Quadrant | BADHDUFLAG | Total packets | Discarded packets |
| A | 0 | 10646 | 3 |
| B | 0 | 11011 | 2 |
| C | 0 | 11040 | 2 |
| D | 0 | 15638 | 2 |
| Mode M9 | |||
|---|---|---|---|
| Quadrant | BADHDUFLAG | Total packets | Discarded packets |
| A | 0 | 40 | 0 |
| B | 0 | 40 | 0 |
| C | 0 | 40 | 0 |
| D | 0 | 41 | 0 |
| Mode SS | |||
|---|---|---|---|
| Quadrant | BADHDUFLAG | Total packets | Discarded packets |
| A | 0 | 100 | 0 |
| B | 0 | 100 | 0 |
| C | 0 | 100 | 0 |
| D | 0 | 100 | 0 |
| Quadrant | Total seconds | Saturated seconds | Saturation percentage |
|---|---|---|---|
| A | 4941 | 9 | 0.182149% |
| B | 4941 | 43 | 0.870269% |
| C | 4941 | 50 | 1.011941% |
| D | 4941 | 319 | 6.456183% |
Noise dominated data is calculated using 1-second bins in cleaned event files. If a bin has >2000 counts, and if more than 50% of those come from <1% of pixels, then it is considered to be noise-dominated and hence unusable.
| Quadrant | # 1 sec bins | Bins with >0 counts | Bins with >2000 counts | High rate bins dominated by noise | Noise dominated (total time) | Noise dominated (detector-on time) | Marked lightcurve |
|---|---|---|---|---|---|---|---|
| A | 7065 | 4942 | 0 | 0 | 0.00% | 0.00% | 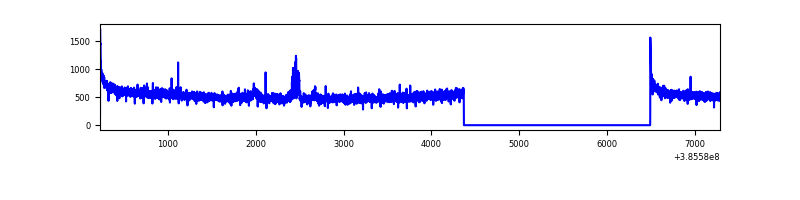 |
| B | 7065 | 4942 | 19 | 19 | 0.27% | 0.38% | 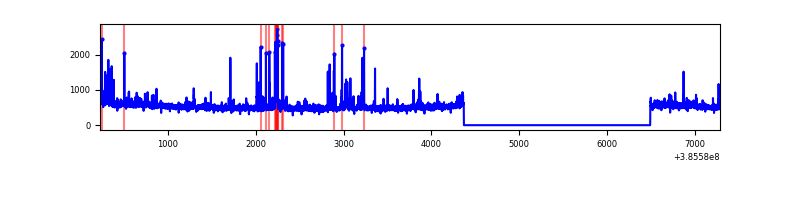 |
| C | 7065 | 4942 | 42 | 42 | 0.59% | 0.85% | 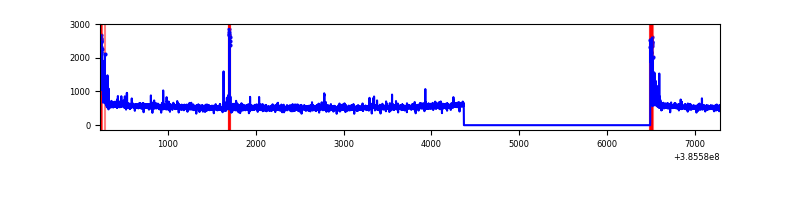 |
| D | 7065 | 4942 | 280 | 280 | 3.96% | 5.67% | 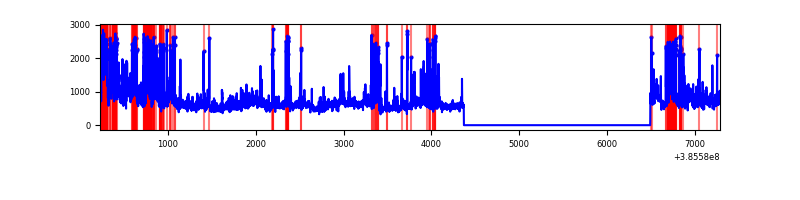 |
Top three noisy pixels from each quadrant. If the there are fewer than three noisy pixels in the level2.evt file, extra rows are filled as -1
| Pixel properties | Quadrant properties | ||||||
|---|---|---|---|---|---|---|---|
| Quadrant | DetID | PixID | Counts | Sigma | Mean | Median | Sigma |
| A | 10 | 83 | 78077 | 614.77 | 636 | 628 | 126.0 |
| A | 5 | 98 | 51908 | 407.05 | 636 | 628 | 126.0 |
| A | 13 | 6 | 24239 | 187.42 | 636 | 628 | 126.0 |
| B | 5 | 172 | 171159 | 1424.23 | 637 | 623 | 119.7 |
| B | 4 | 232 | 28184 | 230.18 | 637 | 623 | 119.7 |
| B | 5 | 255 | 17769 | 143.19 | 637 | 623 | 119.7 |
| C | 15 | 214 | 207567 | 1488.43 | 609 | 616 | 139.0 |
| C | 0 | 10 | 133940 | 958.89 | 609 | 616 | 139.0 |
| C | 14 | 67 | 34232 | 241.77 | 609 | 616 | 139.0 |
| D | 8 | 195 | 701826 | 4909.05 | 591 | 577 | 142.8 |
| D | 10 | 118 | 412582 | 2884.22 | 591 | 577 | 142.8 |
| D | 12 | 128 | 158245 | 1103.75 | 591 | 577 | 142.8 |
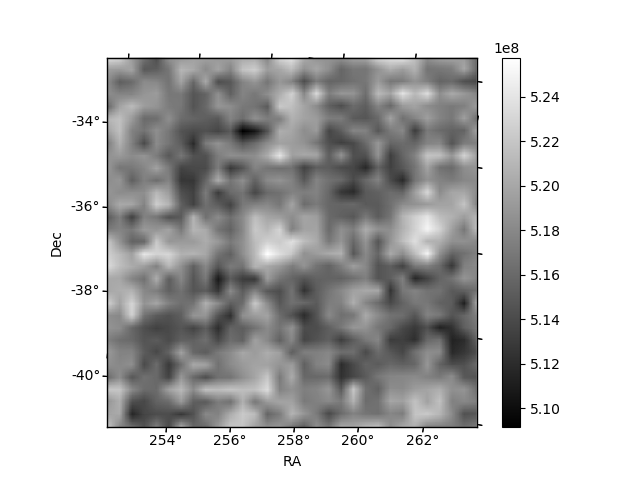
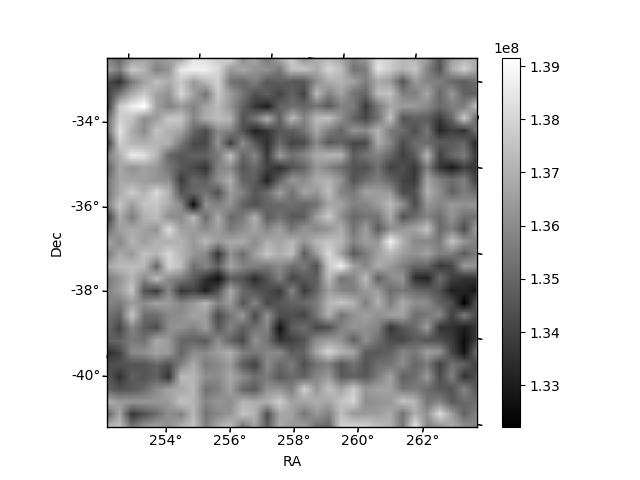
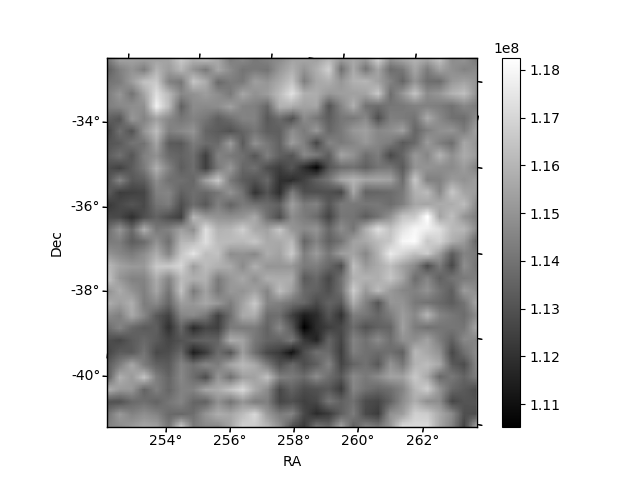
Histogram calculated using DETX and DETY for each event in the final _common_clean file
| Quadrant A | 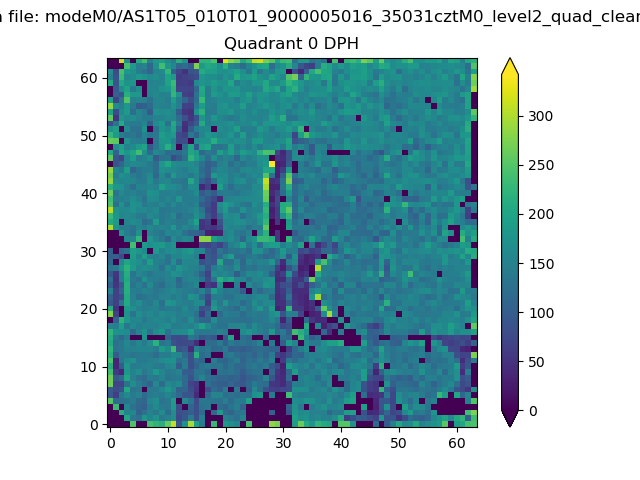 |
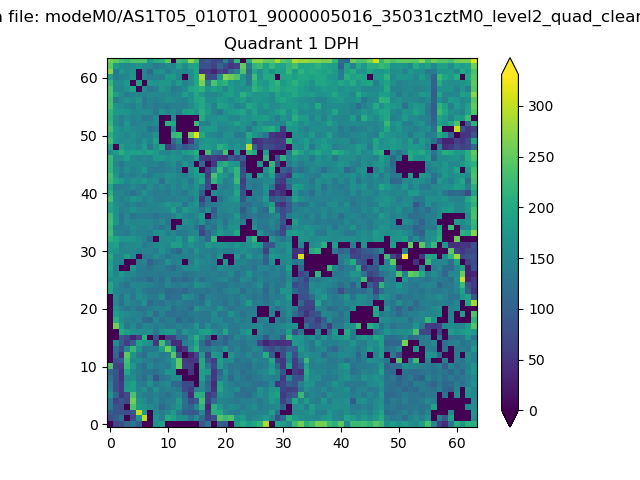 |
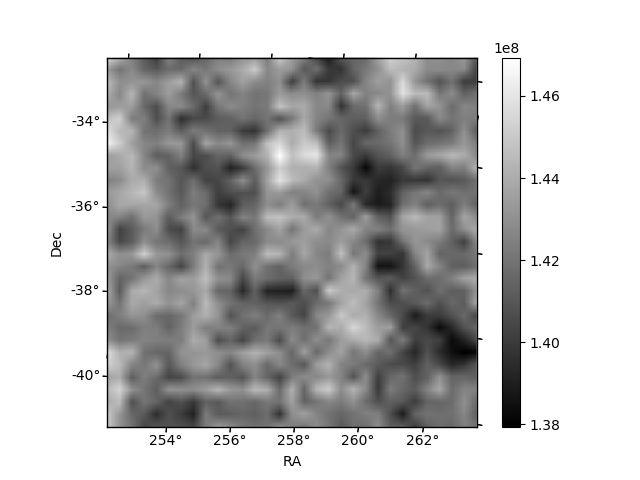
Quadrant B |
|---|---|---|---|
| Quadrant D | 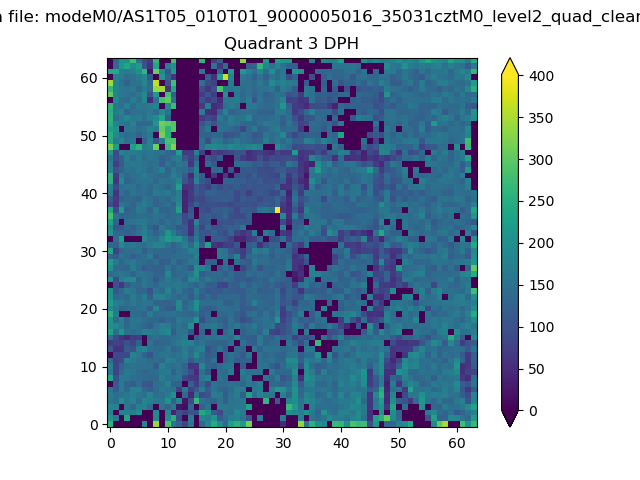 |
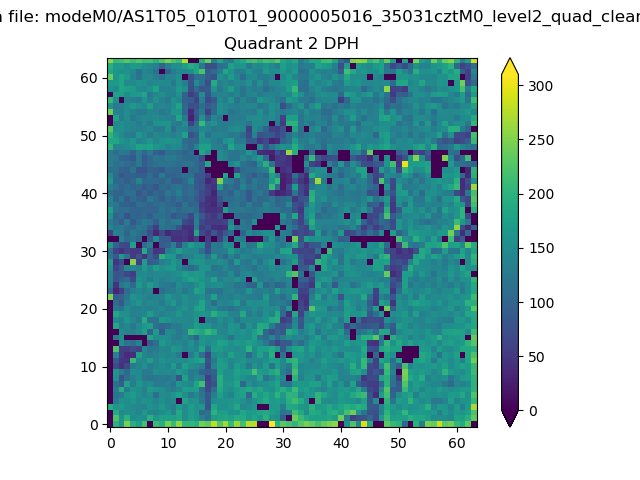 |
Quadrant C |
| Plot type | Count rate plots | Images |
|---|---|---|
| Comparison with Poisson distribution Blue bars denote a histogram of data divided into 1 sec bins. Red curve is a Poisson curve with rate = median count rate of data. |
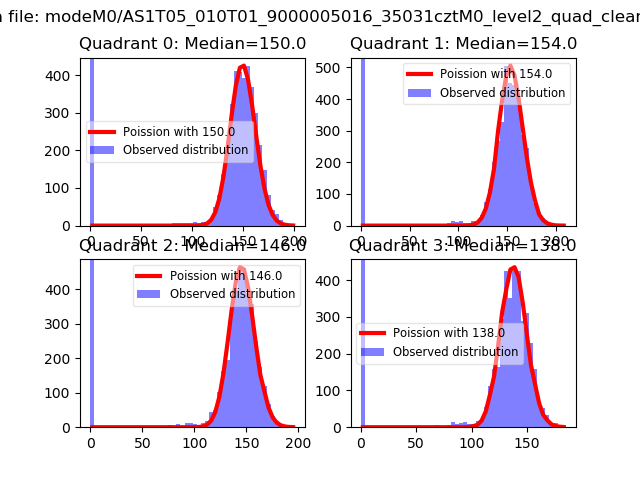 |
 |
| Quadrant-wise count rates Data is divided into 100 sec bins |
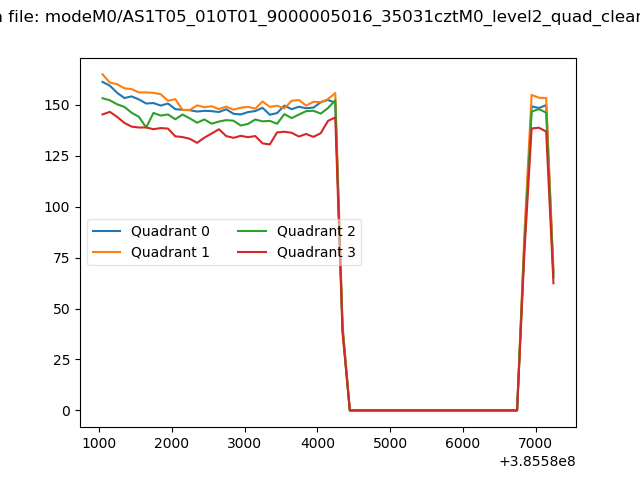 |
|
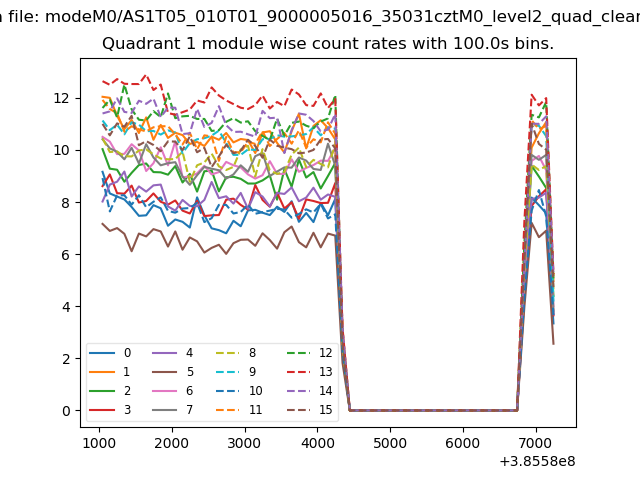
| Module-wise count rates for Quadrant A Data is divided into 100 sec bins |
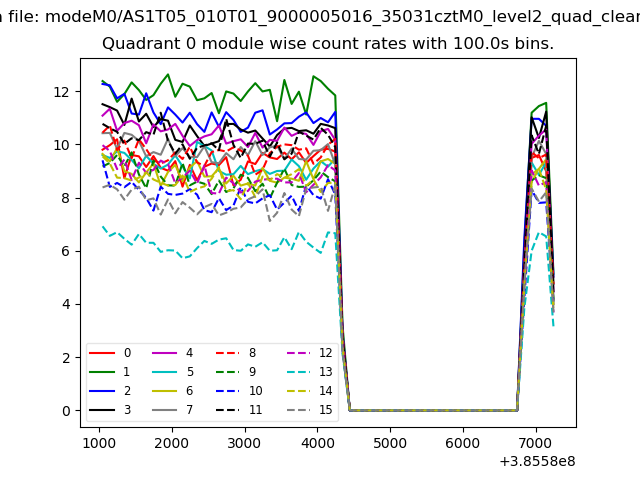 |
 |
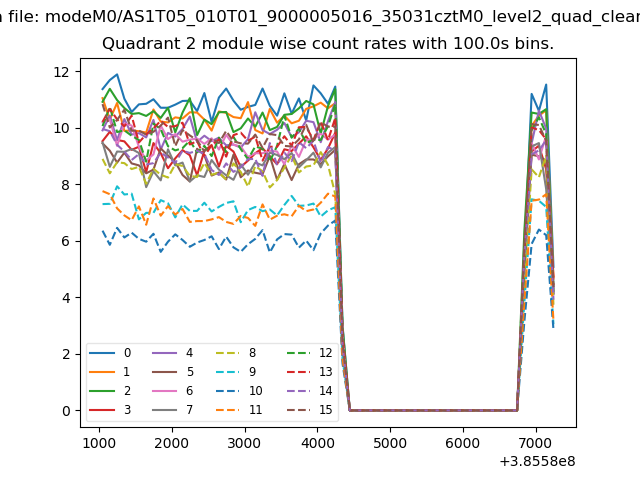
| Module-wise count rates for Quadrant B Data is divided into 100 sec bins |
 |
 |
| Module-wise count rates for Quadrant C Data is divided into 100 sec bins |
 |
 |
| Module-wise count rates for Quadrant D Data is divided into 100 sec bins |
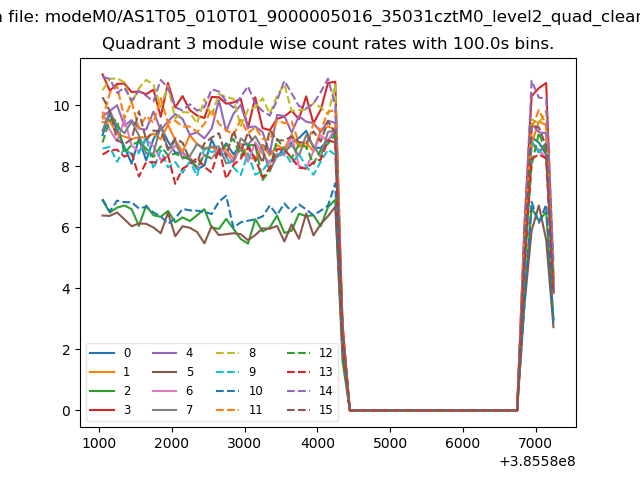 |
 |
| Parameter | Plot |
|---|---|
| CZT HV Monitor | 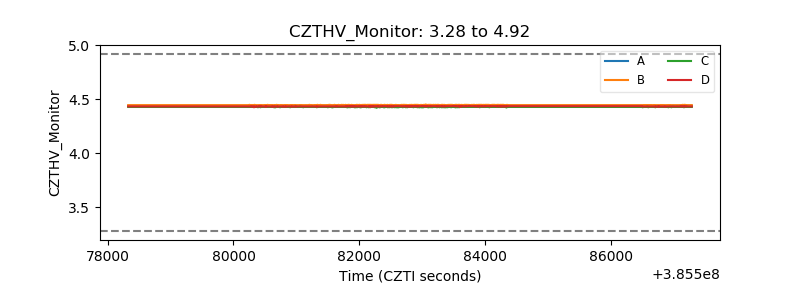 |
| D_VDD | 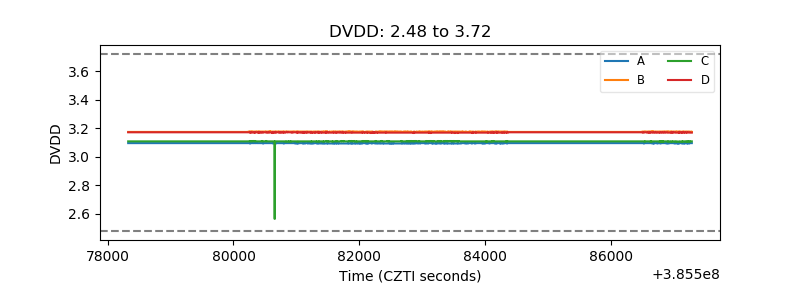 |
| Temperature 1 | 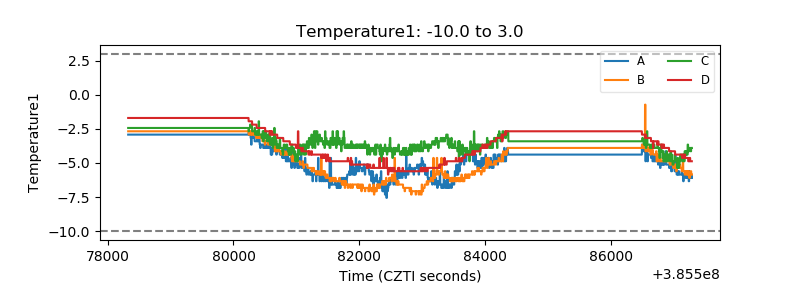 |
| Veto HV Monitor | 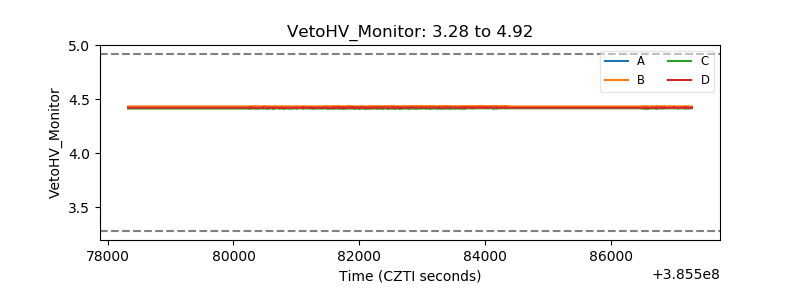 |
| Veto LLD | 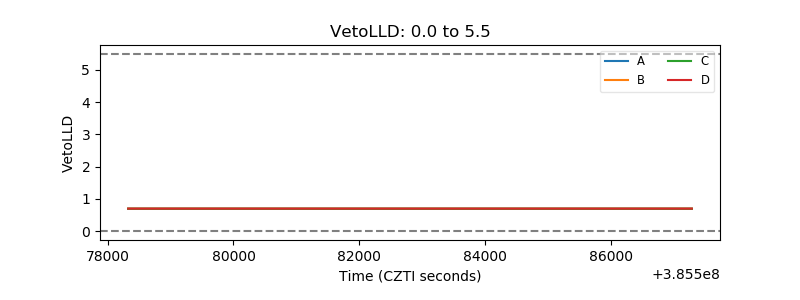 |
| Alpha Counter | 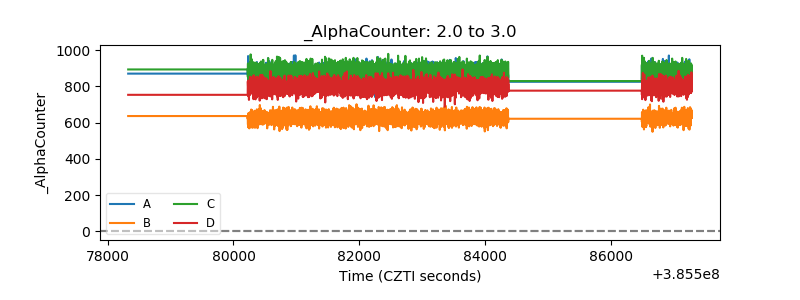 |
| _CPM_Rate | 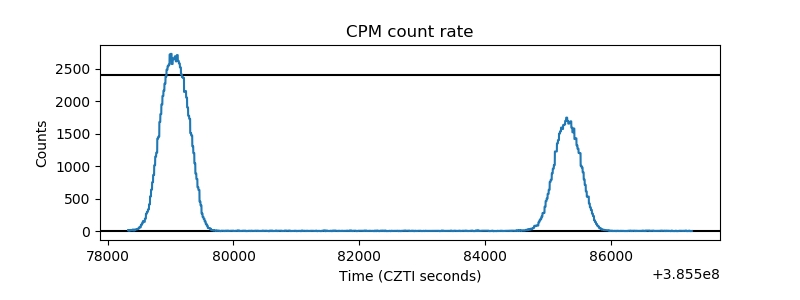 |
| CZT Counter | 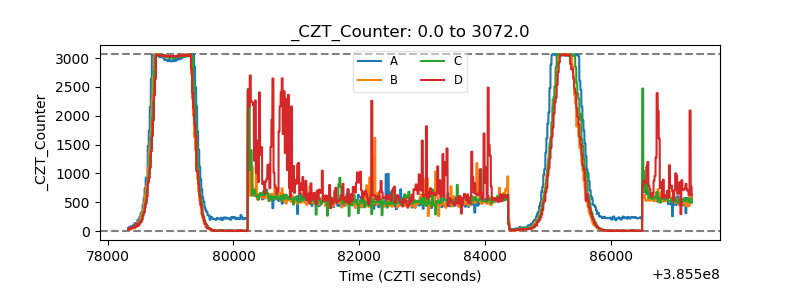 |
| +2.5 Volts monitor | 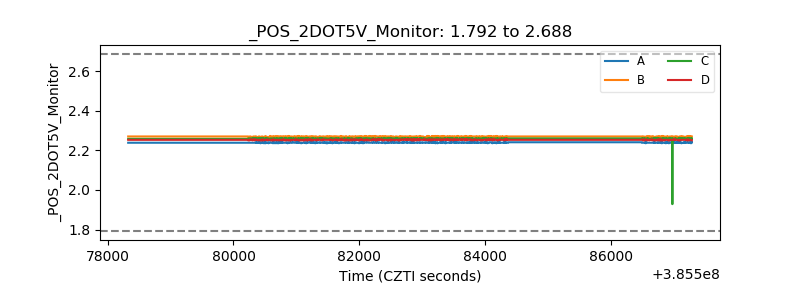 |
| +5 Volts monitor | 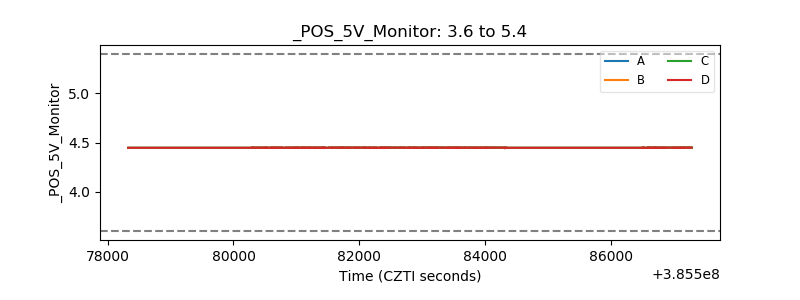 |
| _ROLL_ROT |  |
| _Roll_DEC | 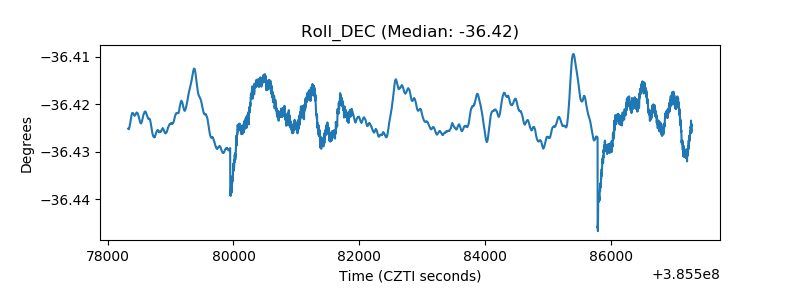 |
| _Roll_RA |  |
| Veto Counter | 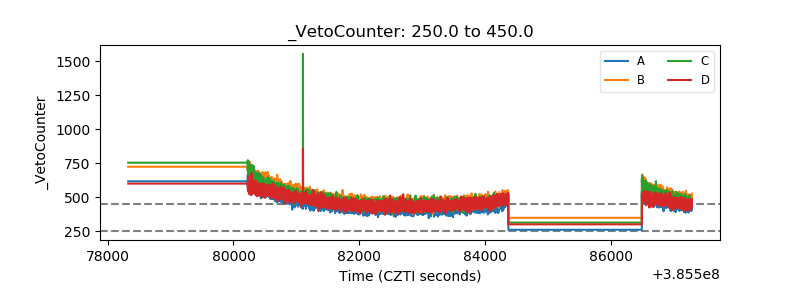 |