| Param | Original file | Final file |
|---|---|---|
| Filename | modeM0/AS1T05_010T01_9000005016_35027cztM0_level2.evt | modeM0/AS1T05_010T01_9000005016_35027cztM0_level2_quad_clean.evt |
| Size (bytes) | 577,180,800 | 89,501,760 |
| Size | 550.4 MB | 85.4 MB |
| Events in quadrant A | 3,664,764 | 556,743 |
| Events in quadrant B | 3,945,210 | 563,314 |
| Events in quadrant C | 3,895,914 | 549,233 |
| Events in quadrant D | 5,465,205 | 518,485 |
| Mode M0 | |||
|---|---|---|---|
| Quadrant | BADHDUFLAG | Total packets | Discarded packets |
| A | 0 | 15595 | 3 |
| B | 0 | 16285 | 2 |
| C | 0 | 15802 | 2 |
| D | 0 | 21414 | 2 |
| Mode M9 | |||
|---|---|---|---|
| Quadrant | BADHDUFLAG | Total packets | Discarded packets |
| A | 0 | 33 | 0 |
| B | 0 | 33 | 0 |
| C | 0 | 33 | 0 |
| D | 0 | 33 | 0 |
| Mode SS | |||
|---|---|---|---|
| Quadrant | BADHDUFLAG | Total packets | Discarded packets |
| A | 0 | 154 | 0 |
| B | 0 | 154 | 0 |
| C | 0 | 154 | 0 |
| D | 0 | 154 | 0 |
| Quadrant | Total seconds | Saturated seconds | Saturation percentage |
|---|---|---|---|
| A | 7511 | 14 | 0.186393% |
| B | 7511 | 49 | 0.652377% |
| C | 7511 | 22 | 0.292904% |
| D | 7511 | 168 | 2.236719% |
Noise dominated data is calculated using 1-second bins in cleaned event files. If a bin has >2000 counts, and if more than 50% of those come from <1% of pixels, then it is considered to be noise-dominated and hence unusable.
| Quadrant | # 1 sec bins | Bins with >0 counts | Bins with >2000 counts | High rate bins dominated by noise | Noise dominated (total time) | Noise dominated (detector-on time) | Marked lightcurve |
|---|---|---|---|---|---|---|---|
| A | 10857 | 7513 | 2 | 2 | 0.02% | 0.03% | 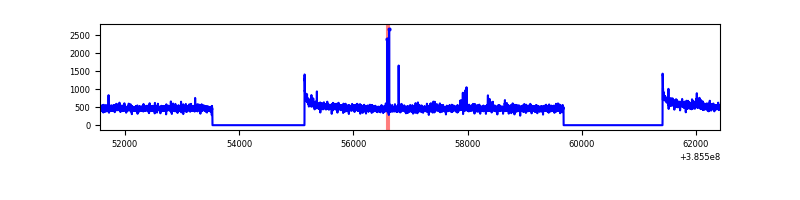 |
| B | 10857 | 7513 | 19 | 19 | 0.18% | 0.25% | 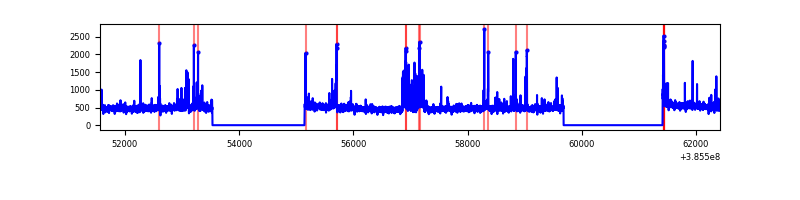 |
| C | 10857 | 7513 | 17 | 17 | 0.16% | 0.23% | 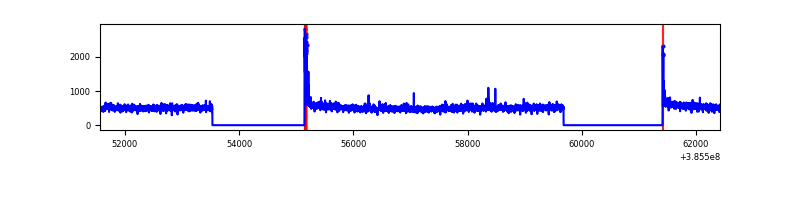 |
| D | 10857 | 7513 | 151 | 151 | 1.39% | 2.01% | 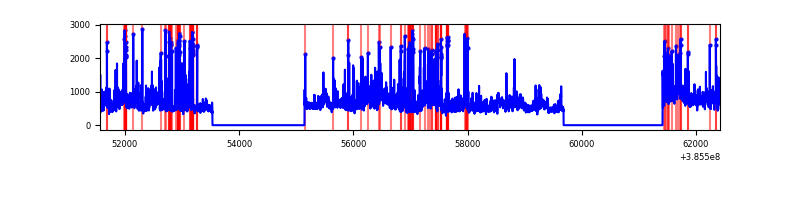 |
Top three noisy pixels from each quadrant. If the there are fewer than three noisy pixels in the level2.evt file, extra rows are filled as -1
| Pixel properties | Quadrant properties | ||||||
|---|---|---|---|---|---|---|---|
| Quadrant | DetID | PixID | Counts | Sigma | Mean | Median | Sigma |
| A | 10 | 83 | 88066 | 479.11 | 912 | 894 | 181.9 |
| A | 7 | 3 | 23959 | 126.77 | 912 | 894 | 181.9 |
| A | 13 | 6 | 18051 | 94.3 | 912 | 894 | 181.9 |
| B | 5 | 172 | 172020 | 993.44 | 904 | 879 | 172.3 |
| B | 4 | 232 | 167132 | 965.07 | 904 | 879 | 172.3 |
| B | 12 | 111 | 21094 | 117.34 | 904 | 879 | 172.3 |
| C | 15 | 214 | 310319 | 1514.82 | 884 | 894 | 204.3 |
| C | 0 | 10 | 80892 | 391.64 | 884 | 894 | 204.3 |
| C | 14 | 67 | 38202 | 182.64 | 884 | 894 | 204.3 |
| D | 8 | 195 | 1146916 | 5349.76 | 879 | 855 | 214.2 |
| D | 13 | 249 | 191593 | 890.36 | 879 | 855 | 214.2 |
| D | 2 | 250 | 189059 | 878.53 | 879 | 855 | 214.2 |
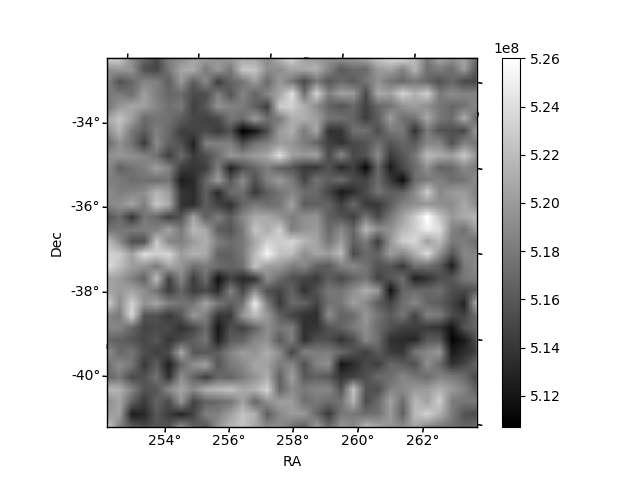
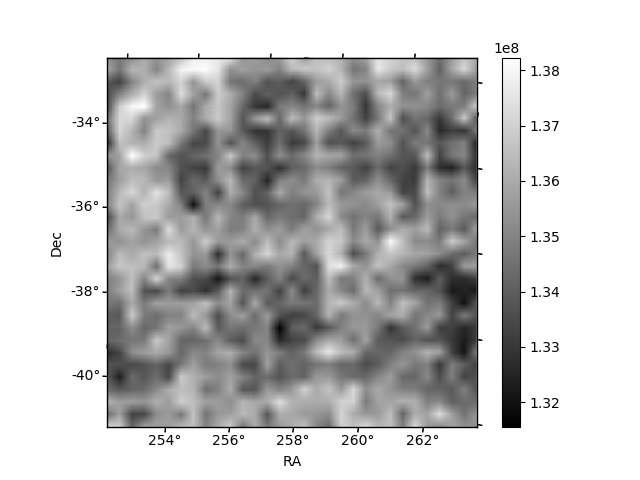
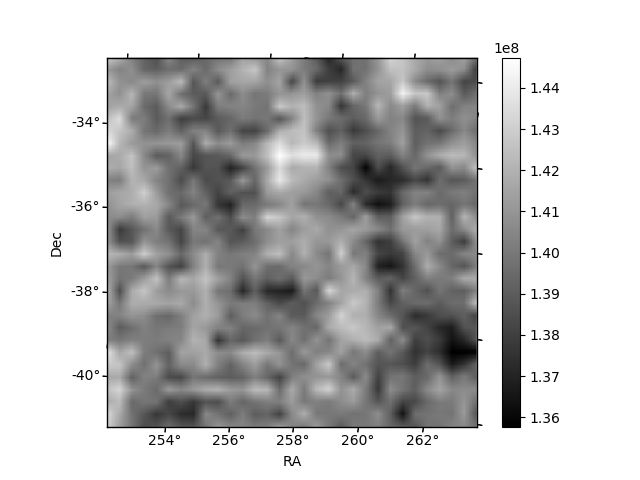
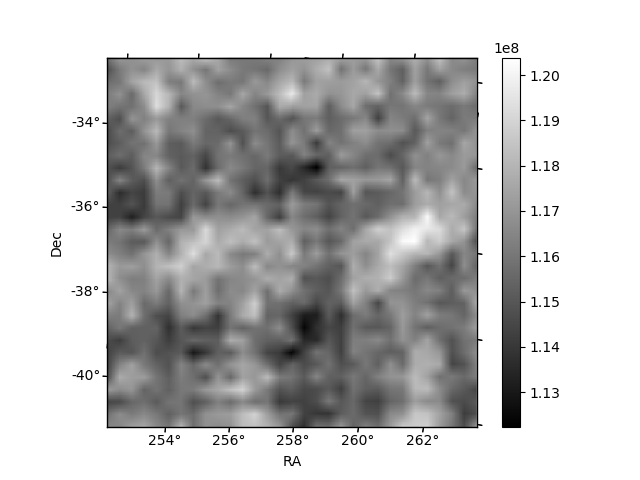
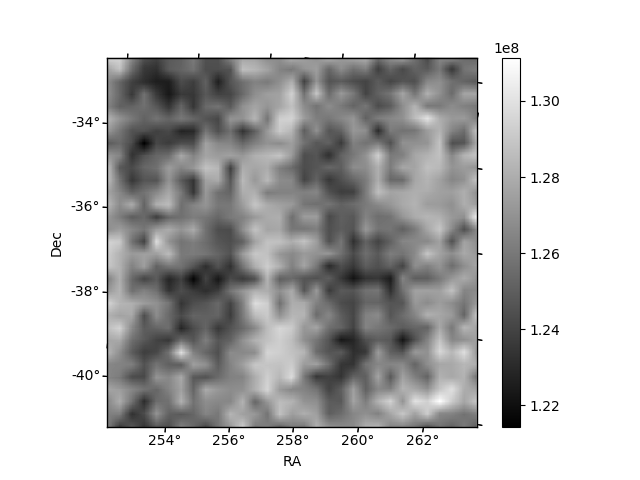
Histogram calculated using DETX and DETY for each event in the final _common_clean file
| Quadrant A | 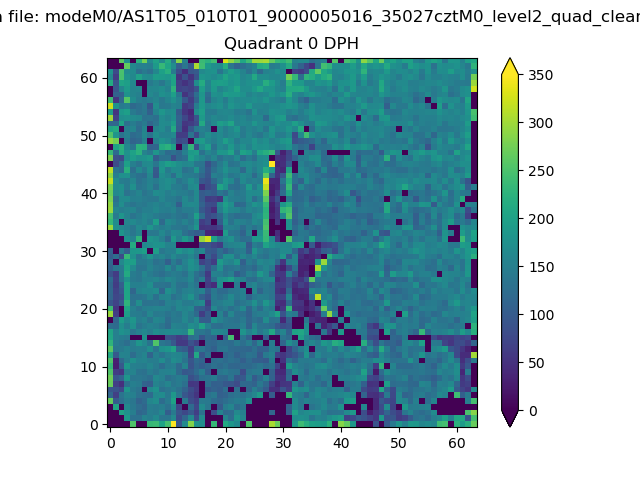 |
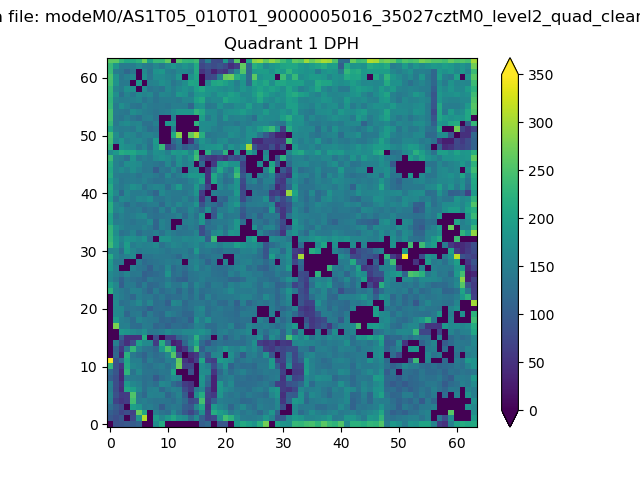 |
Quadrant B |
|---|---|---|---|
| Quadrant D | 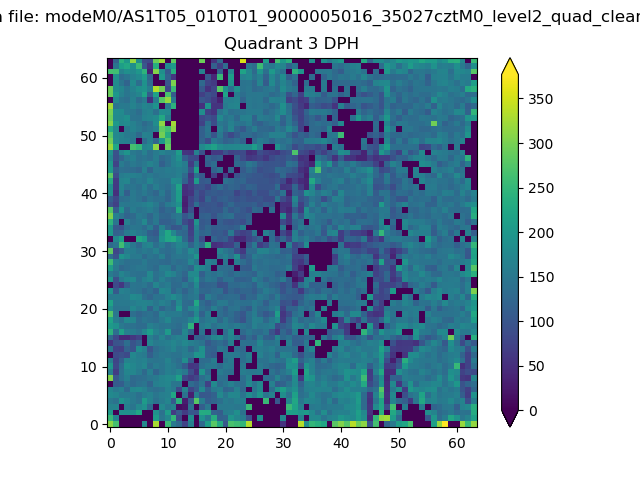 |
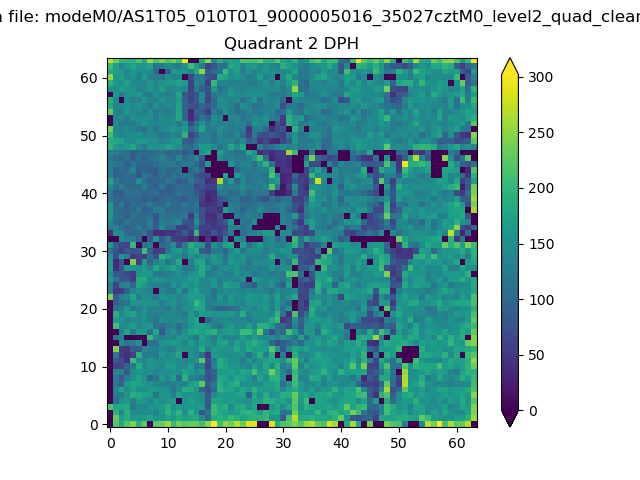 |
Quadrant C |
| Plot type | Count rate plots | Images |
|---|---|---|
| Comparison with Poisson distribution Blue bars denote a histogram of data divided into 1 sec bins. Red curve is a Poisson curve with rate = median count rate of data. |
 |
 |
| Quadrant-wise count rates Data is divided into 100 sec bins |
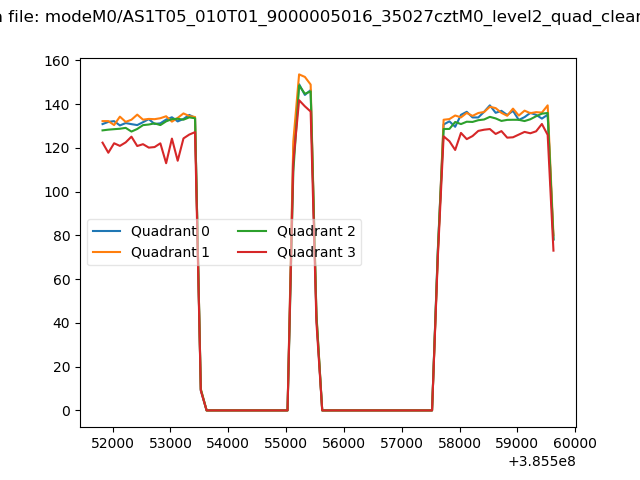 |
|
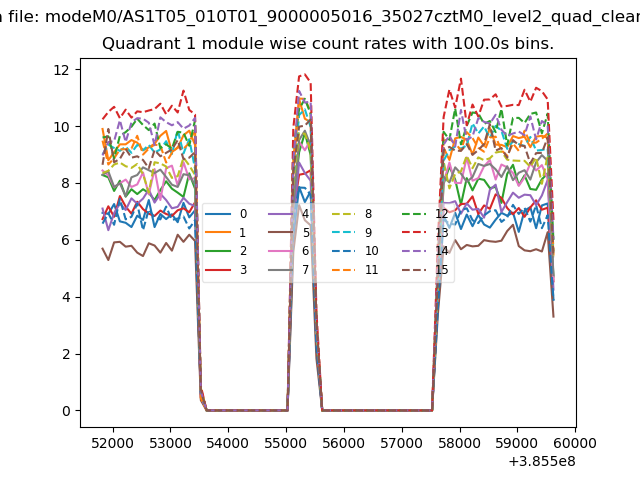
| Module-wise count rates for Quadrant A Data is divided into 100 sec bins |
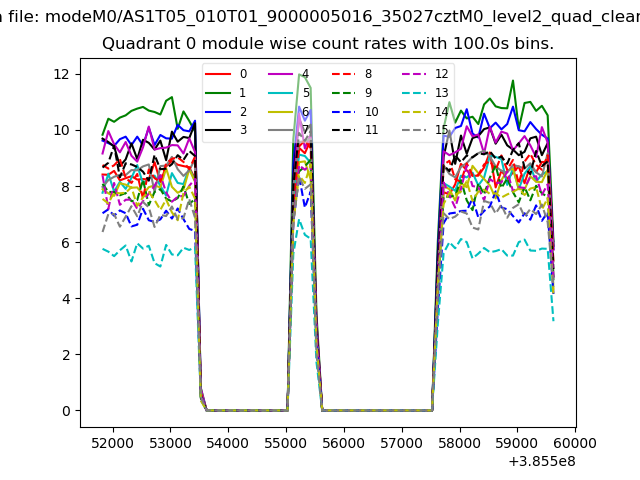 |
 |
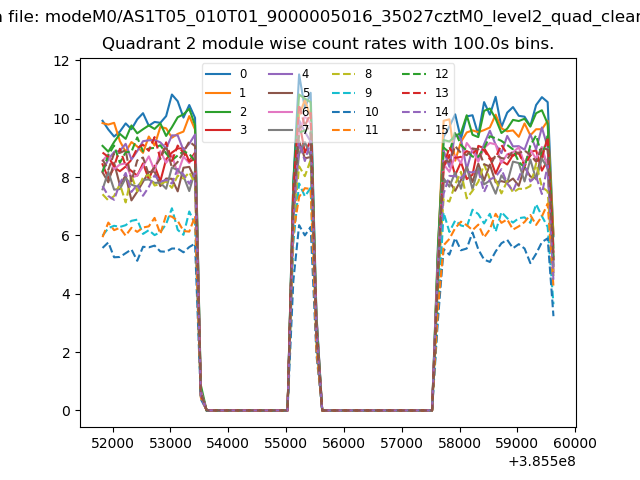
| Module-wise count rates for Quadrant B Data is divided into 100 sec bins |
 |
 |
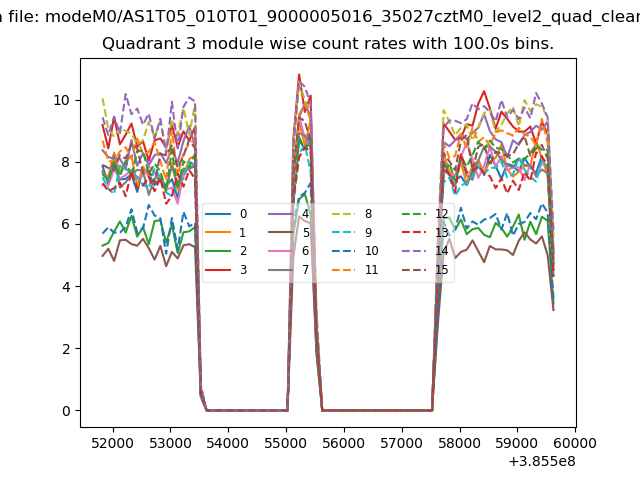
| Module-wise count rates for Quadrant C Data is divided into 100 sec bins |
 |
 |
| Module-wise count rates for Quadrant D Data is divided into 100 sec bins |
 |
 |
| Parameter | Plot |
|---|---|
| CZT HV Monitor | 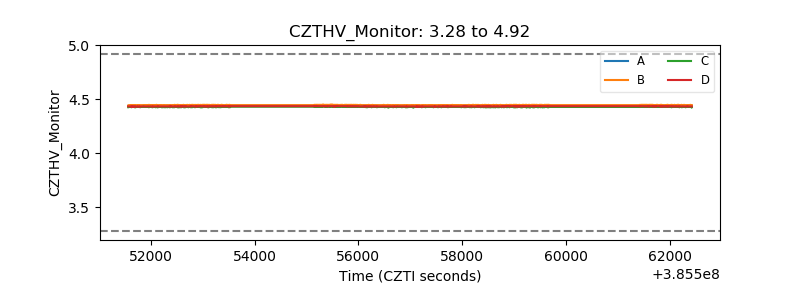 |
| D_VDD |  |
| Temperature 1 | 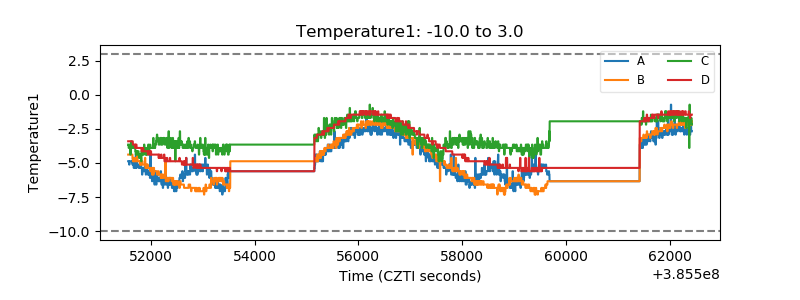 |
| Veto HV Monitor | 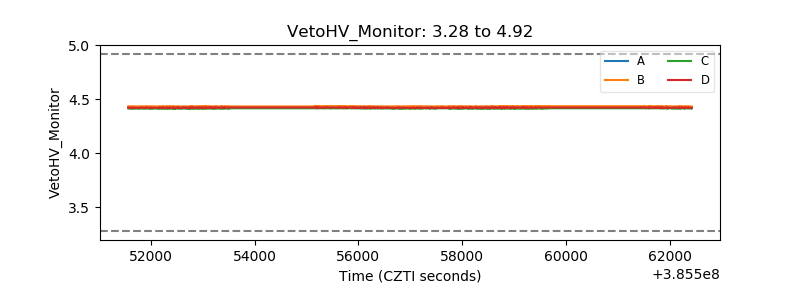 |
| Veto LLD | 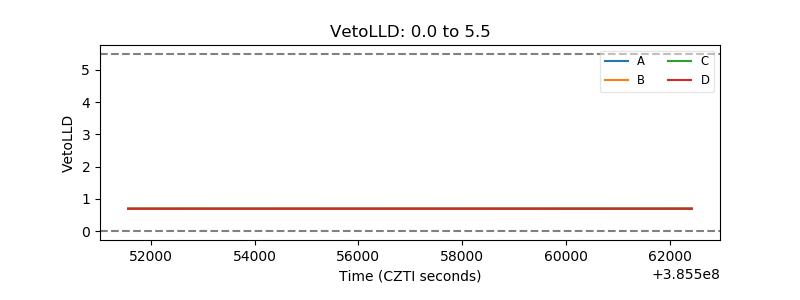 |
| Alpha Counter | 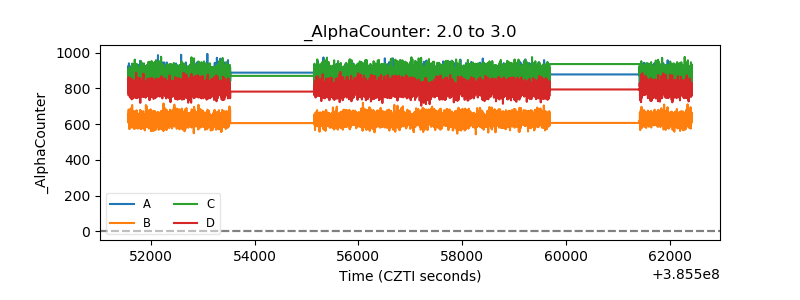 |
| _CPM_Rate | 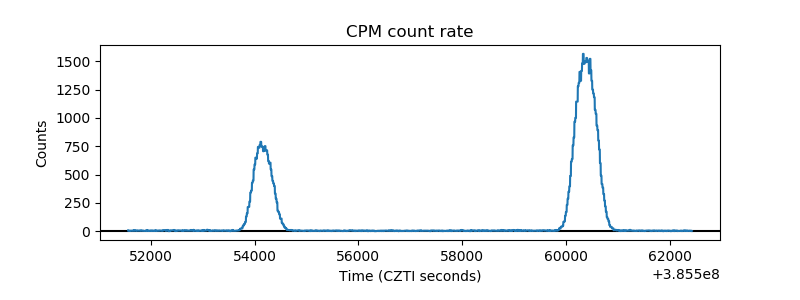 |
| CZT Counter | 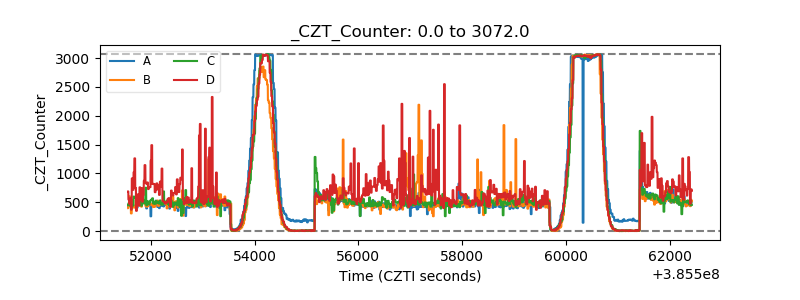 |
| +2.5 Volts monitor | 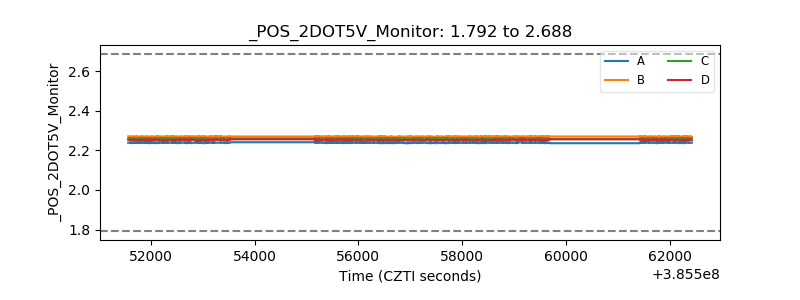 |
| +5 Volts monitor |  |
| _ROLL_ROT | 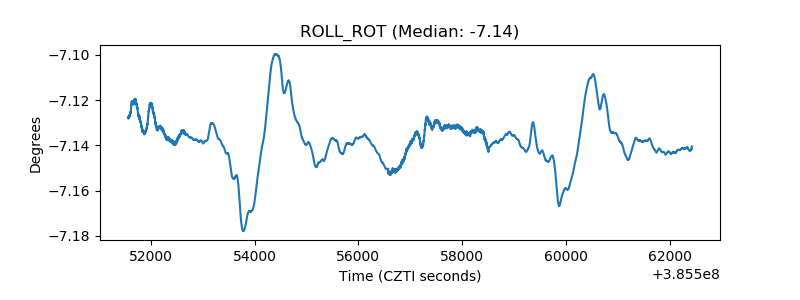 |
| _Roll_DEC | 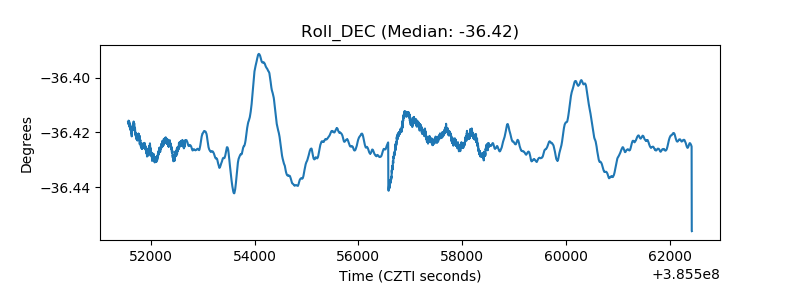 |
| _Roll_RA | 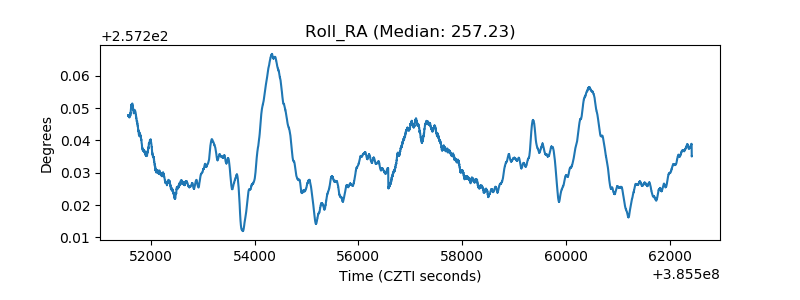 |
| Veto Counter | 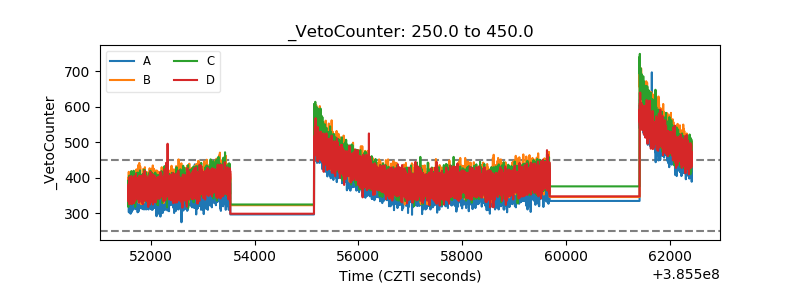 |