| Param | Original file | Final file |
|---|---|---|
| Filename | modeM0/AS1T05_010T01_9000005016_35025cztM0_level2.evt | modeM0/AS1T05_010T01_9000005016_35025cztM0_level2_quad_clean.evt |
| Size (bytes) | 1,802,940,480 | 250,525,440 |
| Size | 1.7 GB | 238.9 MB |
| Events in quadrant A | 10,835,834 | 1,522,655 |
| Events in quadrant B | 11,945,978 | 1,549,030 |
| Events in quadrant C | 11,496,718 | 1,523,142 |
| Events in quadrant D | 18,780,720 | 1,417,383 |
| Mode M0 | |||
|---|---|---|---|
| Quadrant | BADHDUFLAG | Total packets | Discarded packets |
| A | 0 | 46800 | 6 |
| B | 0 | 50375 | 5 |
| C | 0 | 47250 | 5 |
| D | 0 | 71470 | 5 |
| Mode M9 | |||
|---|---|---|---|
| Quadrant | BADHDUFLAG | Total packets | Discarded packets |
| A | 0 | 69 | 0 |
| B | 0 | 69 | 0 |
| C | 0 | 69 | 0 |
| D | 0 | 69 | 0 |
| Mode SS | |||
|---|---|---|---|
| Quadrant | BADHDUFLAG | Total packets | Discarded packets |
| A | 0 | 468 | 0 |
| B | 0 | 468 | 0 |
| C | 0 | 468 | 0 |
| D | 0 | 468 | 0 |
| Quadrant | Total seconds | Saturated seconds | Saturation percentage |
|---|---|---|---|
| A | 22889 | 33 | 0.144174% |
| B | 22889 | 221 | 0.965529% |
| C | 22889 | 73 | 0.318930% |
| D | 22889 | 1019 | 4.451920% |
Noise dominated data is calculated using 1-second bins in cleaned event files. If a bin has >2000 counts, and if more than 50% of those come from <1% of pixels, then it is considered to be noise-dominated and hence unusable.
| Quadrant | # 1 sec bins | Bins with >0 counts | Bins with >2000 counts | High rate bins dominated by noise | Noise dominated (total time) | Noise dominated (detector-on time) | Marked lightcurve |
|---|---|---|---|---|---|---|---|
| A | 29810 | 22894 | 7 | 7 | 0.02% | 0.03% | 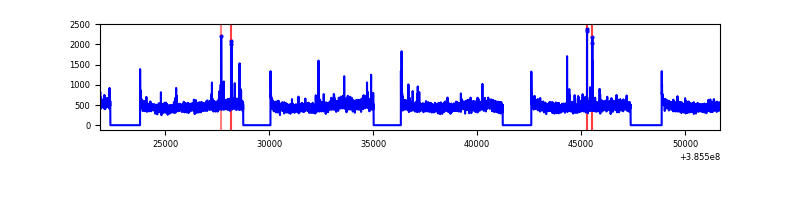 |
| B | 29810 | 22894 | 139 | 139 | 0.47% | 0.61% | 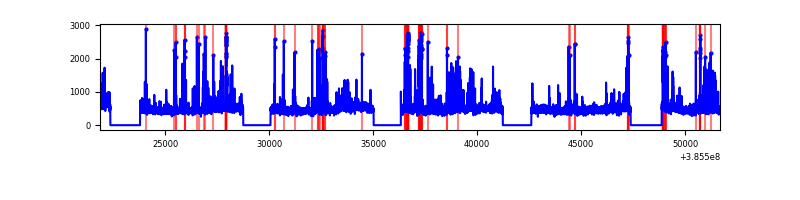 |
| C | 29810 | 22894 | 51 | 51 | 0.17% | 0.22% | 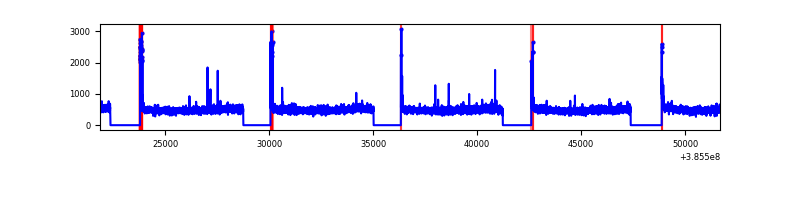 |
| D | 29810 | 22894 | 883 | 883 | 2.96% | 3.86% | 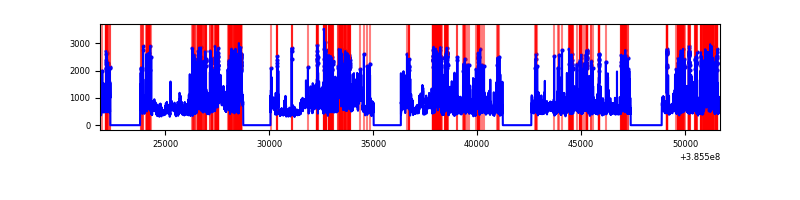 |
Top three noisy pixels from each quadrant. If the there are fewer than three noisy pixels in the level2.evt file, extra rows are filled as -1
| Pixel properties | Quadrant properties | ||||||
|---|---|---|---|---|---|---|---|
| Quadrant | DetID | PixID | Counts | Sigma | Mean | Median | Sigma |
| A | 10 | 83 | 240728 | 444.77 | 2681 | 2629 | 535.3 |
| A | 15 | 169 | 71982 | 129.55 | 2681 | 2629 | 535.3 |
| A | 13 | 6 | 46793 | 82.5 | 2681 | 2629 | 535.3 |
| B | 5 | 172 | 644693 | 1271.29 | 2655 | 2584 | 505.1 |
| B | 4 | 232 | 488028 | 961.11 | 2655 | 2584 | 505.1 |
| B | 0 | 190 | 141104 | 274.25 | 2655 | 2584 | 505.1 |
| C | 15 | 214 | 950399 | 1583.64 | 2607 | 2625 | 598.5 |
| C | 0 | 10 | 254331 | 420.58 | 2607 | 2625 | 598.5 |
| C | 14 | 67 | 65626 | 105.27 | 2607 | 2625 | 598.5 |
| D | 8 | 195 | 4451509 | 7164.84 | 2575 | 2513 | 620.9 |
| D | 12 | 233 | 1068268 | 1716.33 | 2575 | 2513 | 620.9 |
| D | 10 | 118 | 812385 | 1304.25 | 2575 | 2513 | 620.9 |
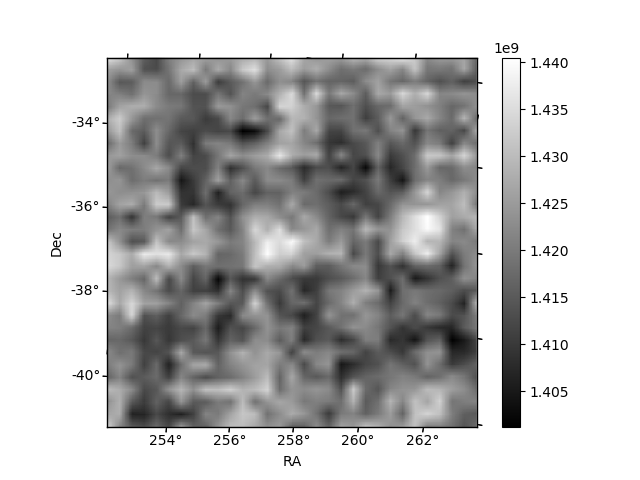
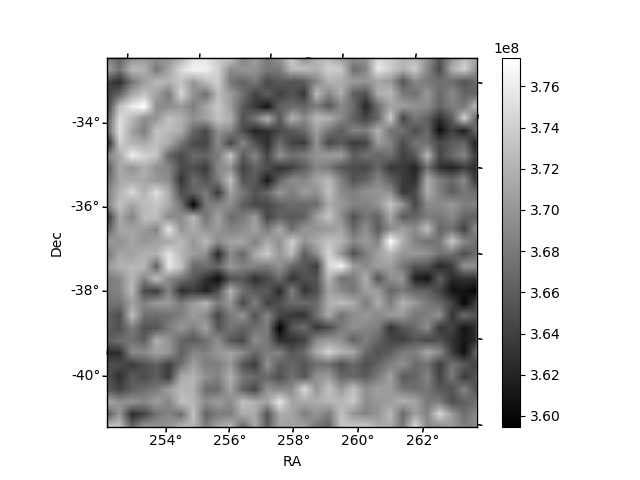
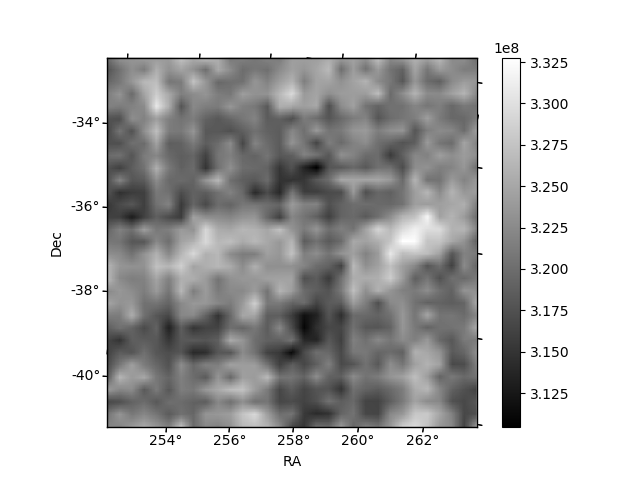
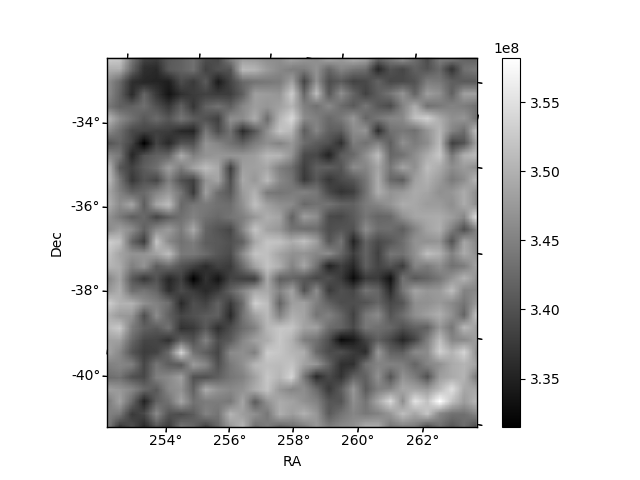
Histogram calculated using DETX and DETY for each event in the final _common_clean file
| Quadrant A | 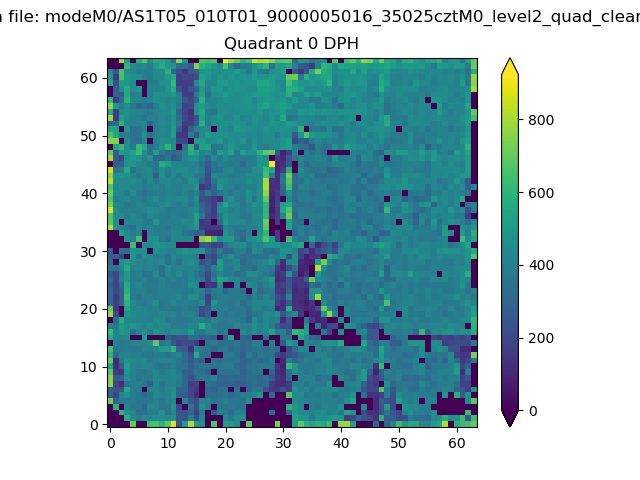 |
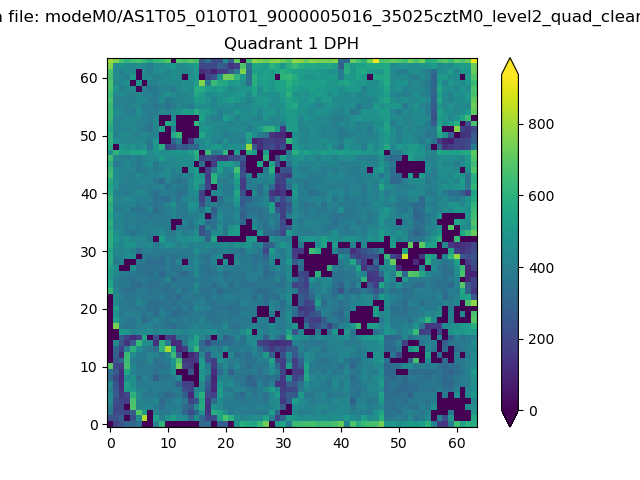 |
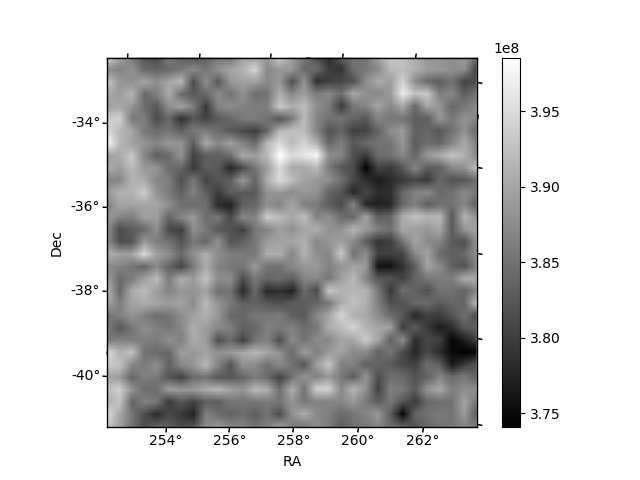
Quadrant B |
|---|---|---|---|
| Quadrant D | 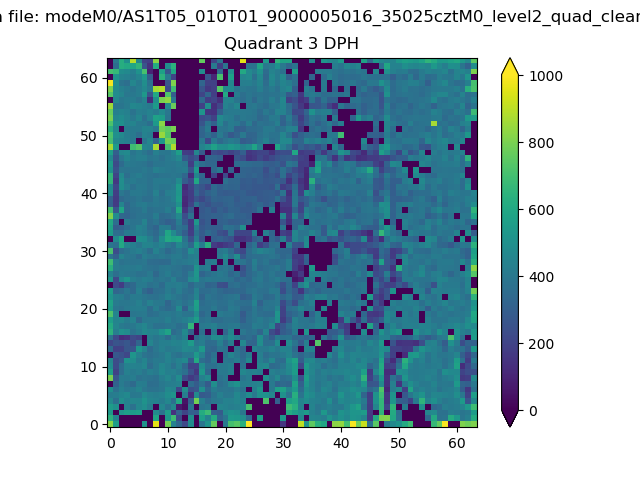 |
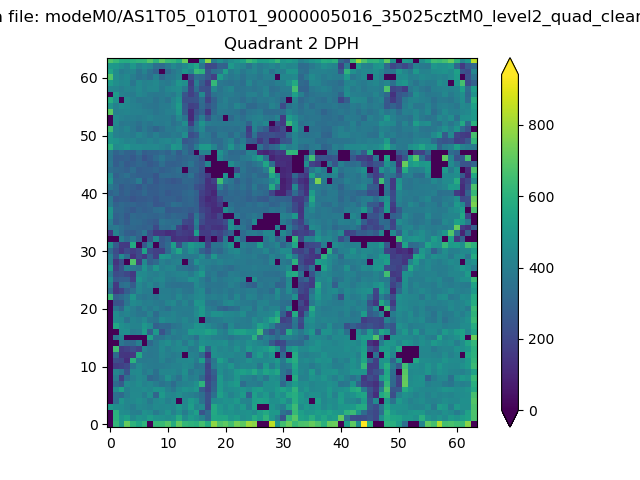 |
Quadrant C |
| Plot type | Count rate plots | Images |
|---|---|---|
| Comparison with Poisson distribution Blue bars denote a histogram of data divided into 1 sec bins. Red curve is a Poisson curve with rate = median count rate of data. |
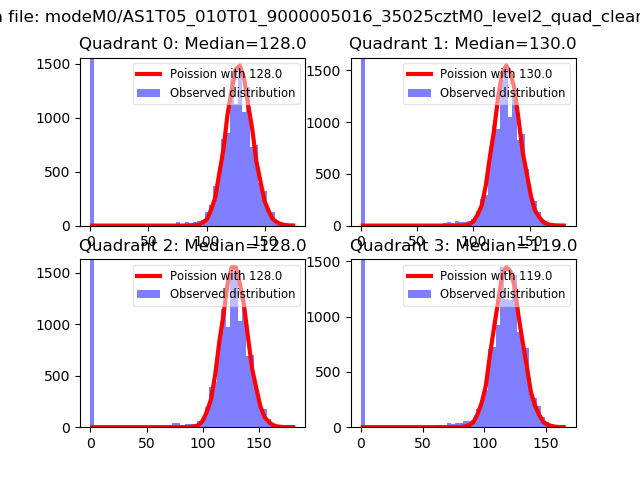 |
 |
| Quadrant-wise count rates Data is divided into 100 sec bins |
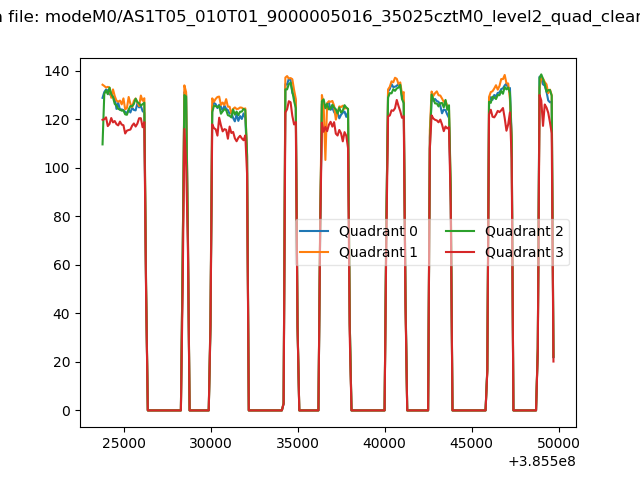 |
|
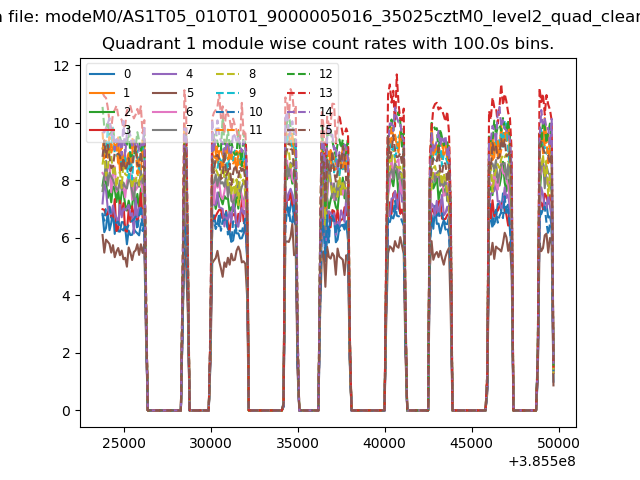
| Module-wise count rates for Quadrant A Data is divided into 100 sec bins |
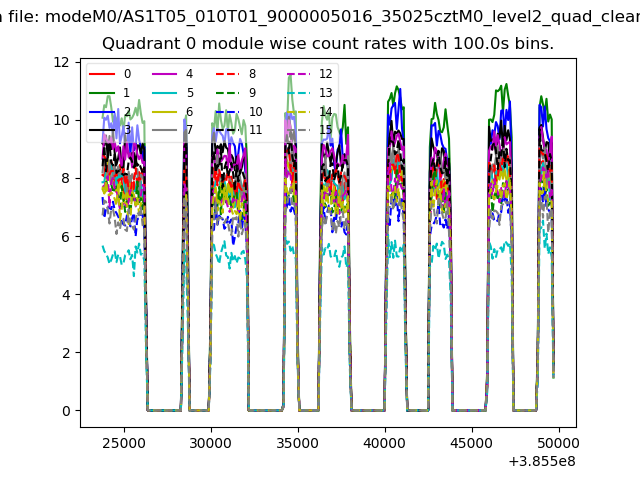 |
 |
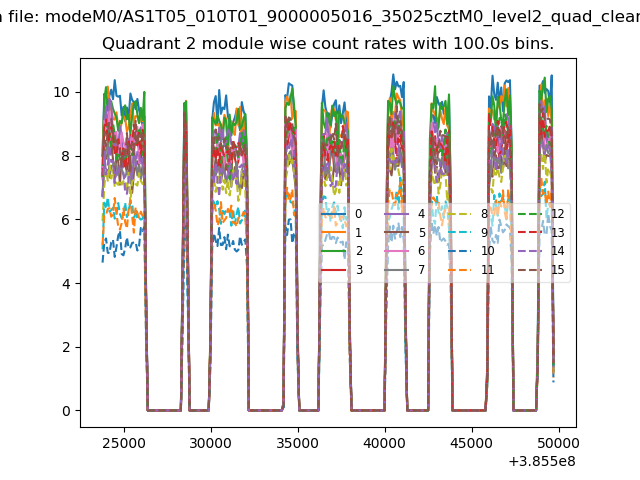
| Module-wise count rates for Quadrant B Data is divided into 100 sec bins |
 |
 |
| Module-wise count rates for Quadrant C Data is divided into 100 sec bins |
 |
 |
| Module-wise count rates for Quadrant D Data is divided into 100 sec bins |
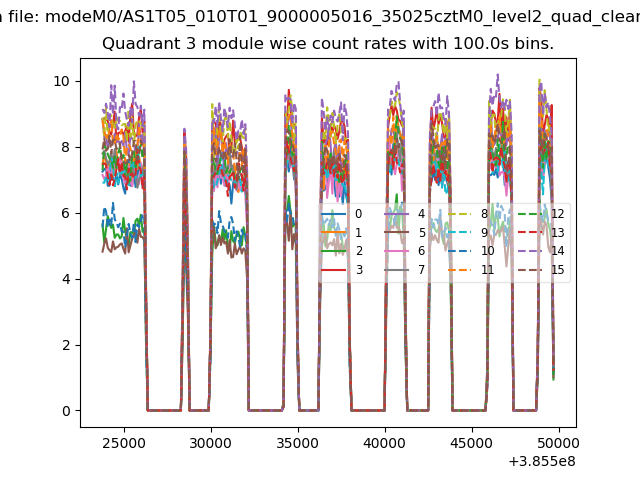 |
 |
| Parameter | Plot |
|---|---|
| CZT HV Monitor | 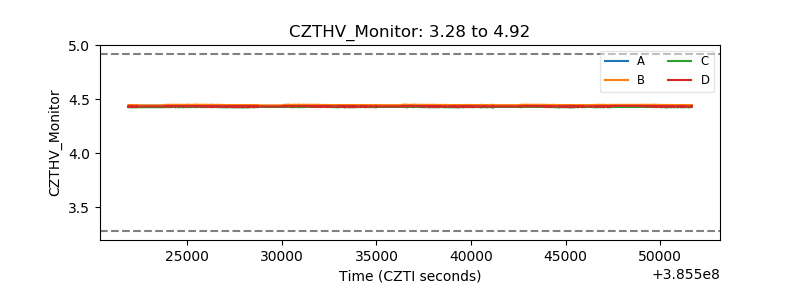 |
| D_VDD | 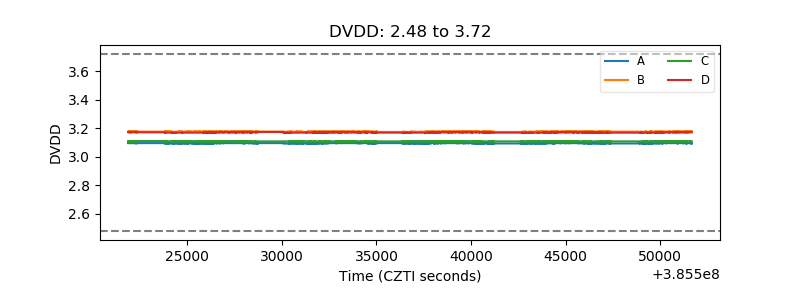 |
| Temperature 1 | 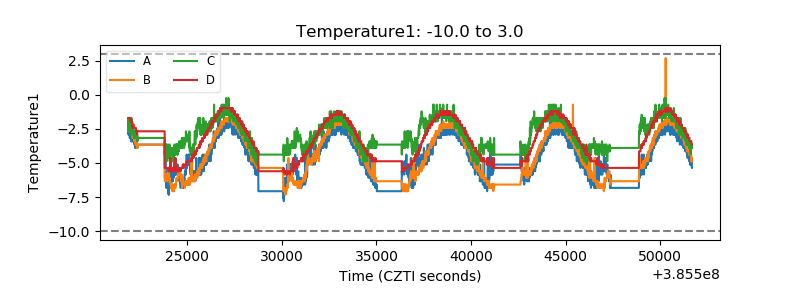 |
| Veto HV Monitor | 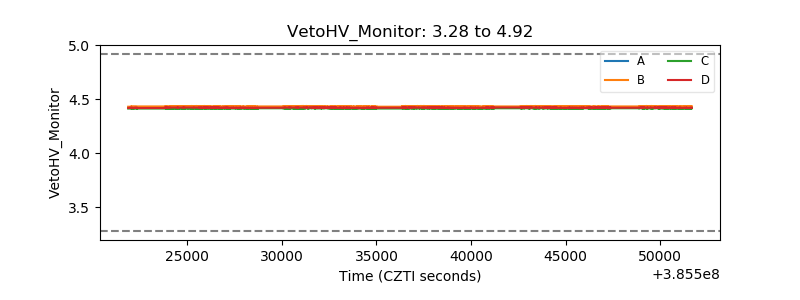 |
| Veto LLD | 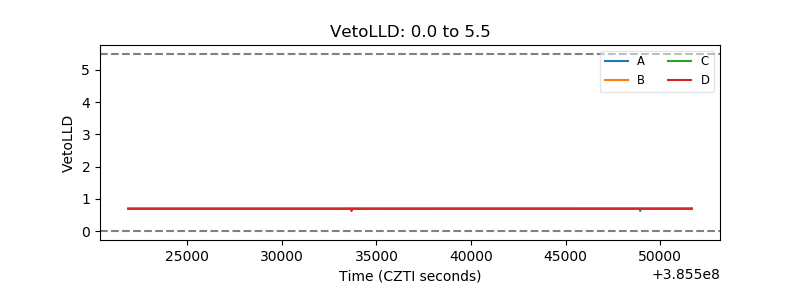 |
| Alpha Counter | 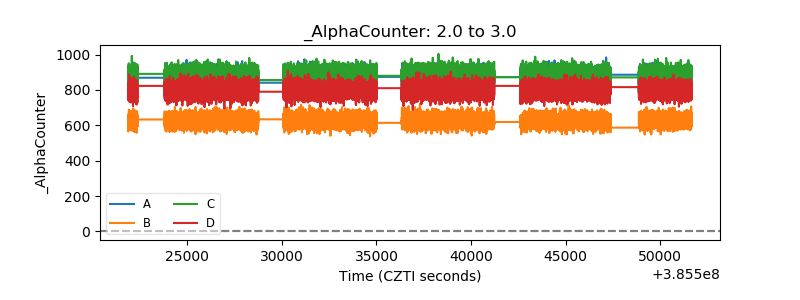 |
| _CPM_Rate | 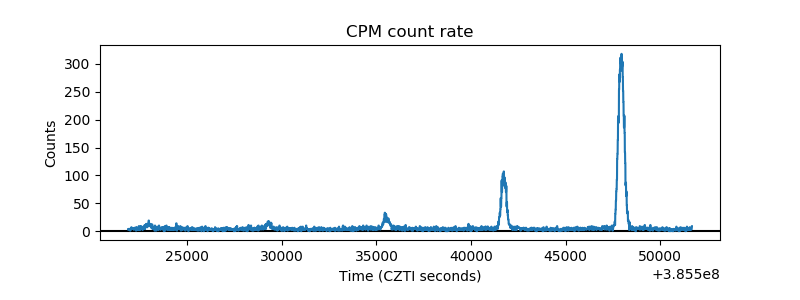 |
| CZT Counter | 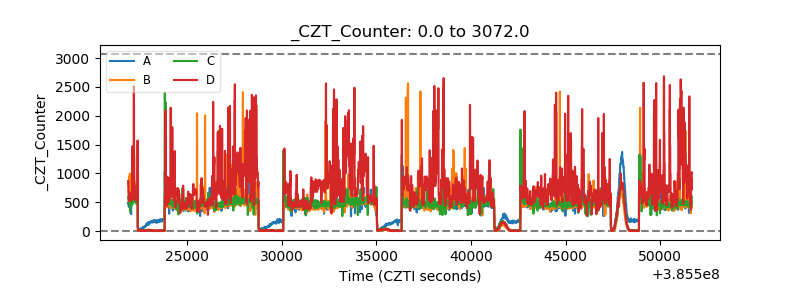 |
| +2.5 Volts monitor | 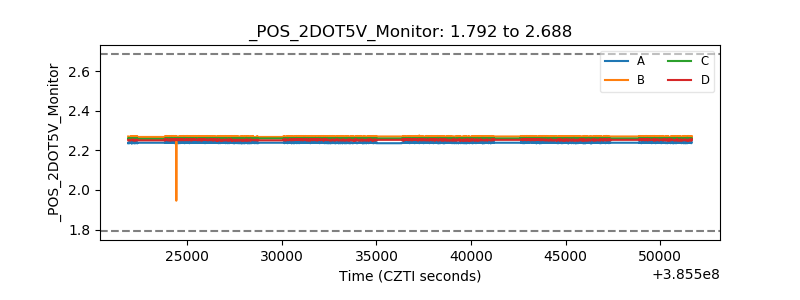 |
| +5 Volts monitor | 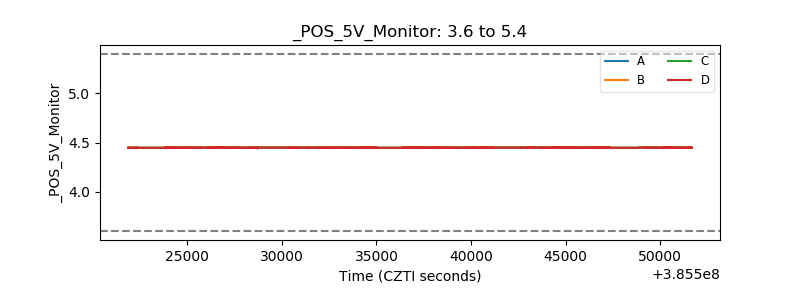 |
| _ROLL_ROT | 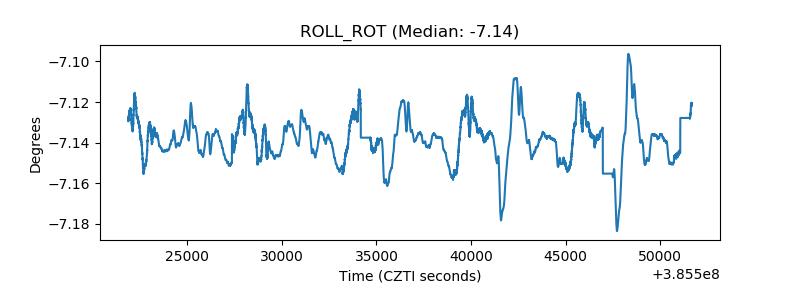 |
| _Roll_DEC | 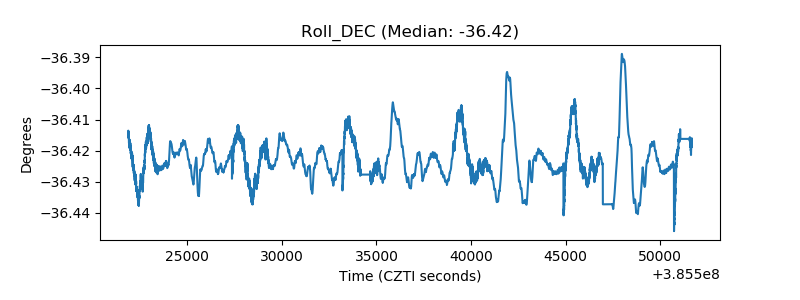 |
| _Roll_RA | 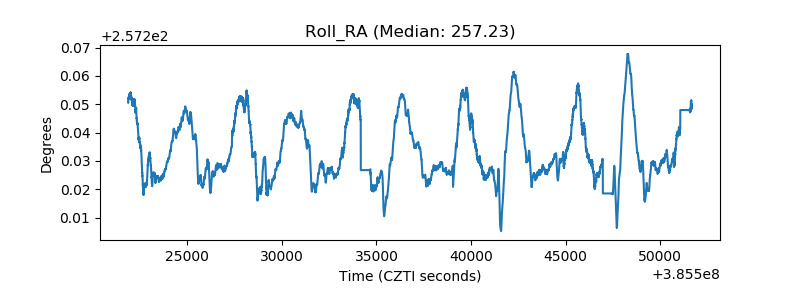 |
| Veto Counter | 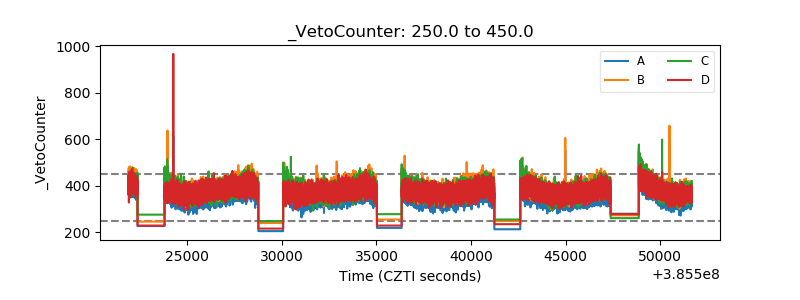 |