| Param | Original file | Final file |
|---|---|---|
| Filename | modeM0/AS1T05_010T01_9000005016_35019cztM0_level2.evt | modeM0/AS1T05_010T01_9000005016_35019cztM0_level2_quad_clean.evt |
| Size (bytes) | 431,945,280 | 82,120,320 |
| Size | 411.9 MB | 78.3 MB |
| Events in quadrant A | 2,644,985 | 535,204 |
| Events in quadrant B | 3,187,736 | 539,374 |
| Events in quadrant C | 2,883,795 | 528,366 |
| Events in quadrant D | 3,989,296 | 497,065 |
| Mode M0 | |||
|---|---|---|---|
| Quadrant | BADHDUFLAG | Total packets | Discarded packets |
| A | 0 | 11449 | 3 |
| B | 0 | 13064 | 2 |
| C | 0 | 11734 | 2 |
| D | 0 | 15889 | 2 |
| Mode M9 | |||
|---|---|---|---|
| Quadrant | BADHDUFLAG | Total packets | Discarded packets |
| A | 0 | 39 | 0 |
| B | 0 | 39 | 0 |
| C | 0 | 39 | 0 |
| D | 0 | 39 | 0 |
| Mode SS | |||
|---|---|---|---|
| Quadrant | BADHDUFLAG | Total packets | Discarded packets |
| A | 0 | 112 | 0 |
| B | 0 | 112 | 0 |
| C | 0 | 112 | 0 |
| D | 0 | 112 | 0 |
| Quadrant | Total seconds | Saturated seconds | Saturation percentage |
|---|---|---|---|
| A | 5536 | 12 | 0.216763% |
| B | 5536 | 190 | 3.432081% |
| C | 5536 | 42 | 0.758671% |
| D | 5536 | 126 | 2.276012% |
Noise dominated data is calculated using 1-second bins in cleaned event files. If a bin has >2000 counts, and if more than 50% of those come from <1% of pixels, then it is considered to be noise-dominated and hence unusable.
| Quadrant | # 1 sec bins | Bins with >0 counts | Bins with >2000 counts | High rate bins dominated by noise | Noise dominated (total time) | Noise dominated (detector-on time) | Marked lightcurve |
|---|---|---|---|---|---|---|---|
| A | 9302 | 5538 | 3 | 3 | 0.03% | 0.05% |  |
| B | 9302 | 5538 | 156 | 156 | 1.68% | 2.82% |  |
| C | 9302 | 5538 | 41 | 41 | 0.44% | 0.74% |  |
| D | 9302 | 5538 | 114 | 114 | 1.23% | 2.06% |  |
Top three noisy pixels from each quadrant. If the there are fewer than three noisy pixels in the level2.evt file, extra rows are filled as -1
| Pixel properties | Quadrant properties | ||||||
|---|---|---|---|---|---|---|---|
| Quadrant | DetID | PixID | Counts | Sigma | Mean | Median | Sigma |
| A | 10 | 83 | 76494 | 577.7 | 650 | 637 | 131.3 |
| A | 15 | 223 | 30389 | 226.58 | 650 | 637 | 131.3 |
| A | 7 | 3 | 10876 | 77.97 | 650 | 637 | 131.3 |
| B | 5 | 172 | 317120 | 2568.1 | 642 | 627 | 123.2 |
| B | 5 | 31 | 124884 | 1008.25 | 642 | 627 | 123.2 |
| B | 5 | 15 | 59356 | 476.54 | 642 | 627 | 123.2 |
| C | 15 | 214 | 232090 | 1561.39 | 636 | 643 | 148.2 |
| C | 0 | 10 | 153687 | 1032.47 | 636 | 643 | 148.2 |
| C | 14 | 67 | 15019 | 96.98 | 636 | 643 | 148.2 |
| D | 8 | 195 | 1021344 | 6678.39 | 630 | 615 | 152.8 |
| D | 13 | 249 | 144339 | 940.35 | 630 | 615 | 152.8 |
| D | 12 | 233 | 126432 | 823.19 | 630 | 615 | 152.8 |
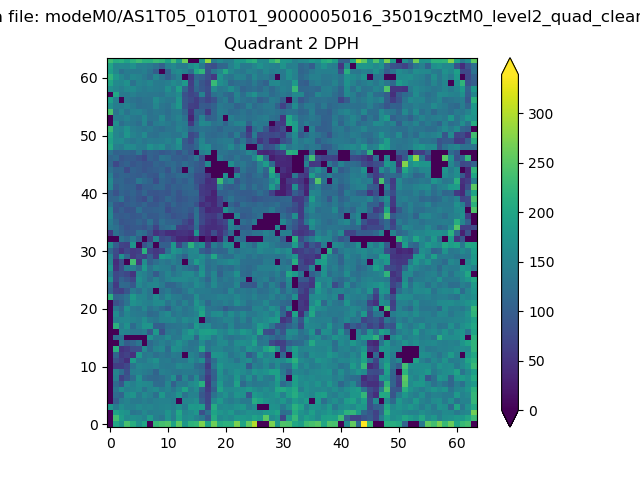
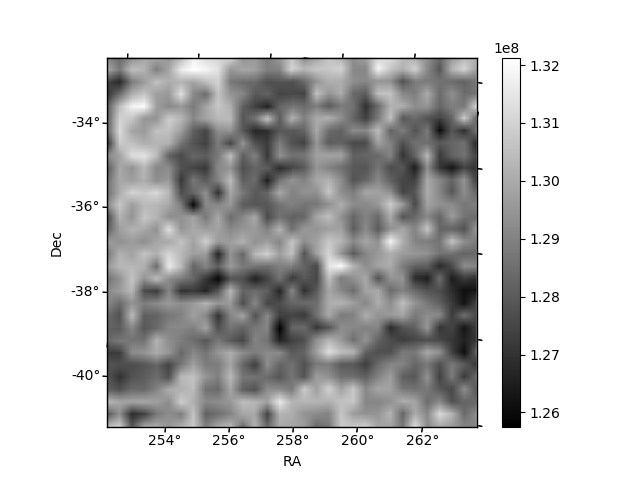
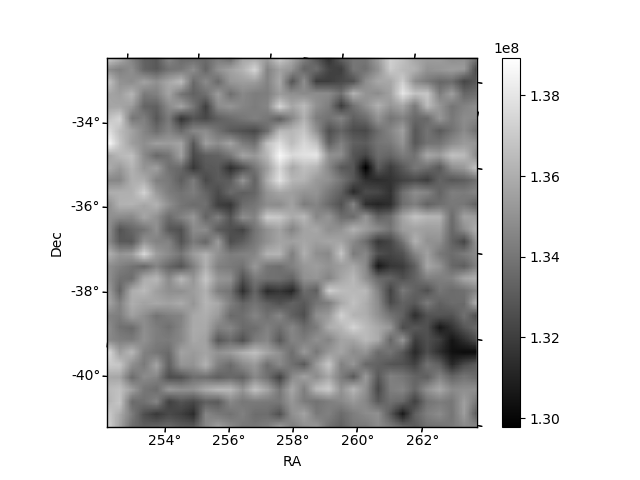
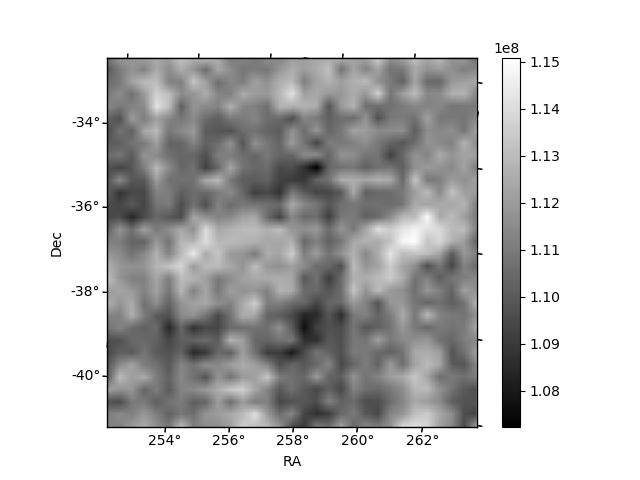
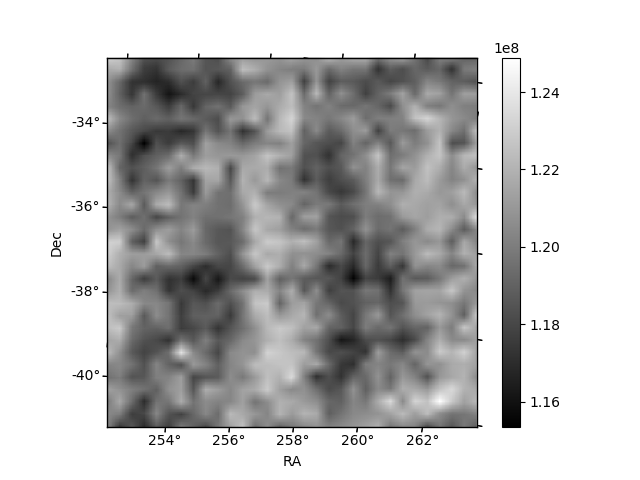
Histogram calculated using DETX and DETY for each event in the final _common_clean file
| Quadrant A | 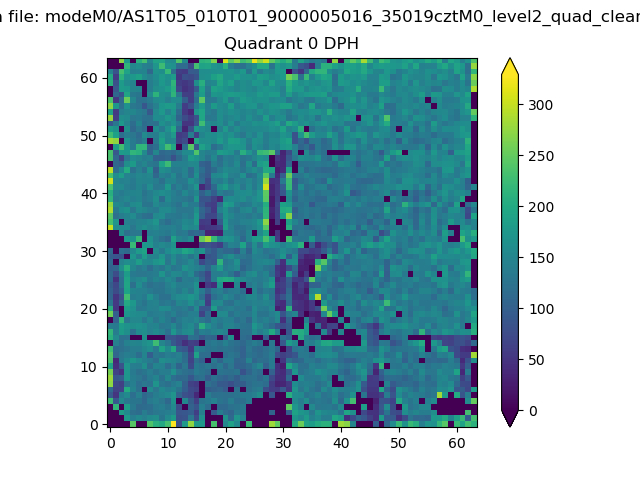 |
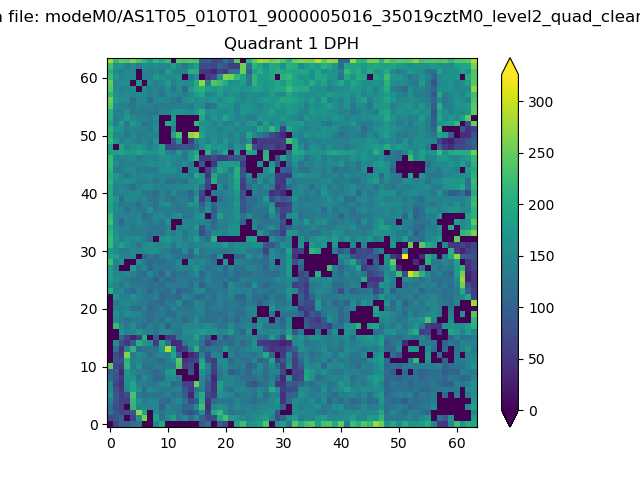 |
Quadrant B |
|---|---|---|---|
| Quadrant D | 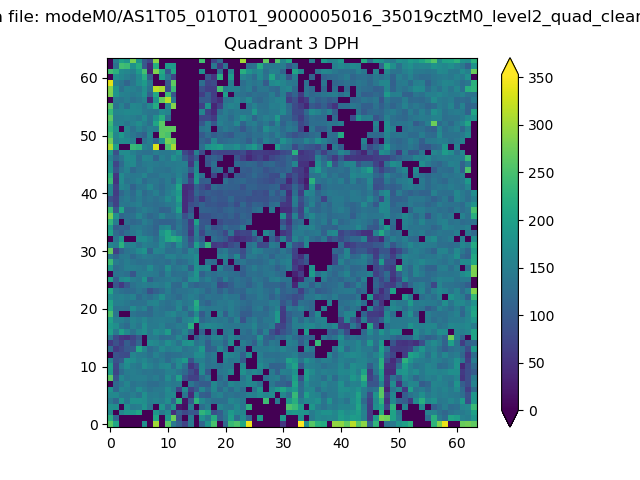 |
 |
Quadrant C |
| Plot type | Count rate plots | Images |
|---|---|---|
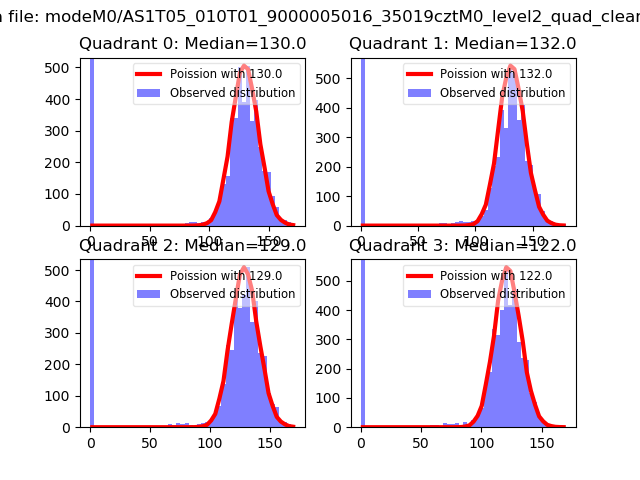
| Comparison with Poisson distribution Blue bars denote a histogram of data divided into 1 sec bins. Red curve is a Poisson curve with rate = median count rate of data. |
 |
 |
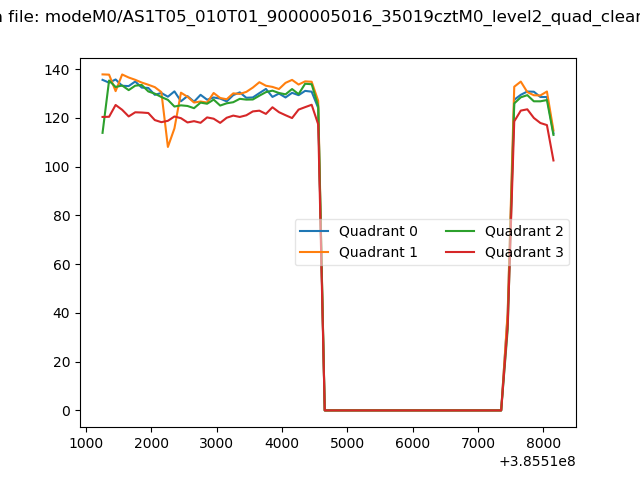
| Quadrant-wise count rates Data is divided into 100 sec bins |
 |
|
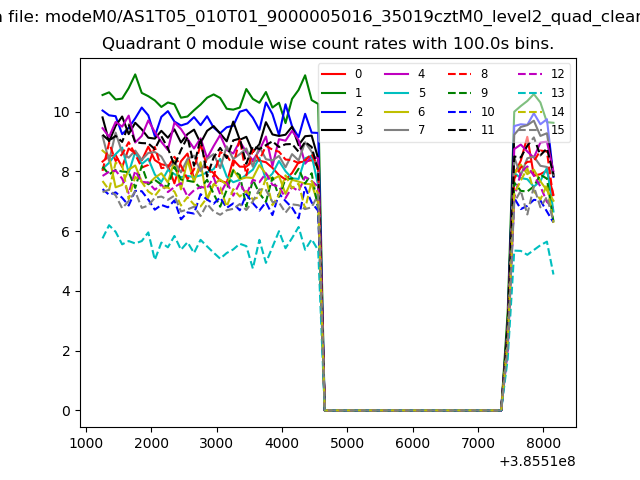
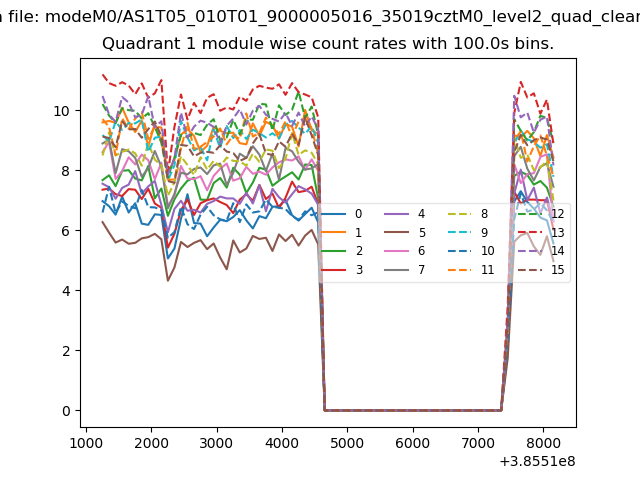
| Module-wise count rates for Quadrant A Data is divided into 100 sec bins |
 |
 |
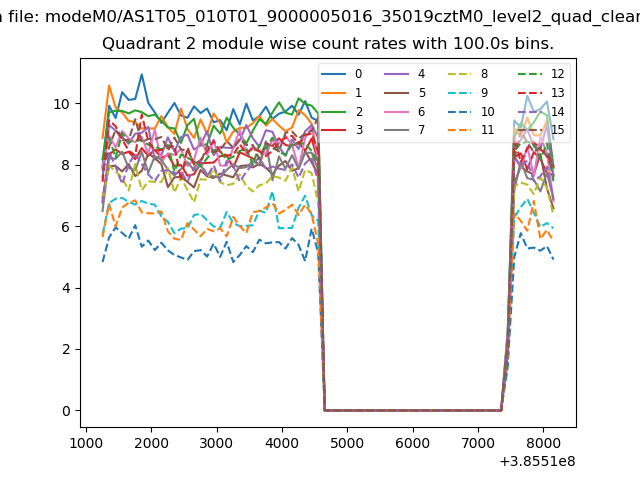
| Module-wise count rates for Quadrant B Data is divided into 100 sec bins |
 |
 |
| Module-wise count rates for Quadrant C Data is divided into 100 sec bins |
 |
 |
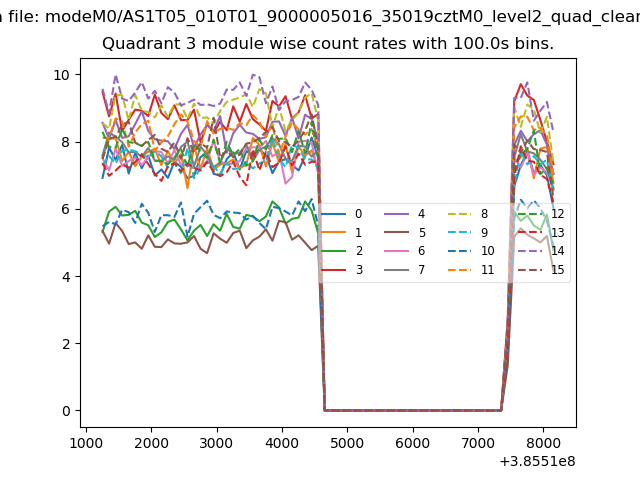
| Module-wise count rates for Quadrant D Data is divided into 100 sec bins |
 |
 |
| Parameter | Plot |
|---|---|
| CZT HV Monitor | 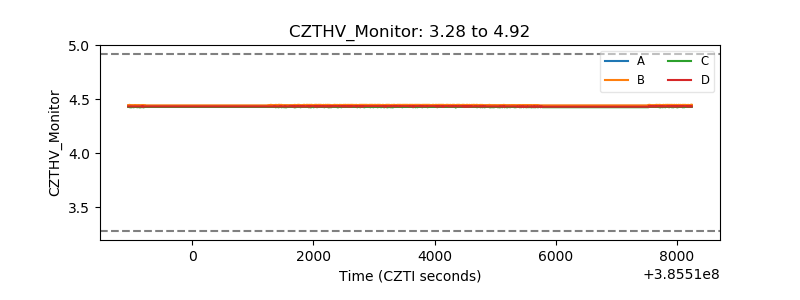 |
| D_VDD | 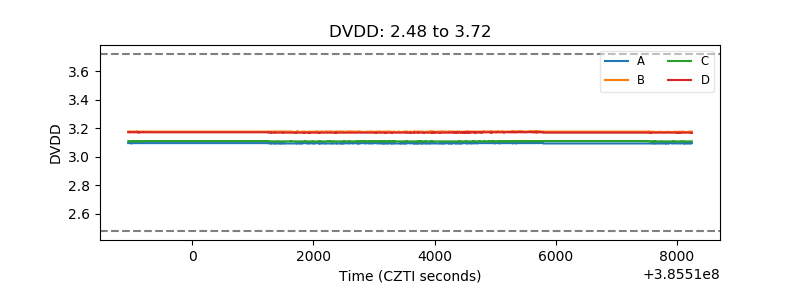 |
| Temperature 1 | 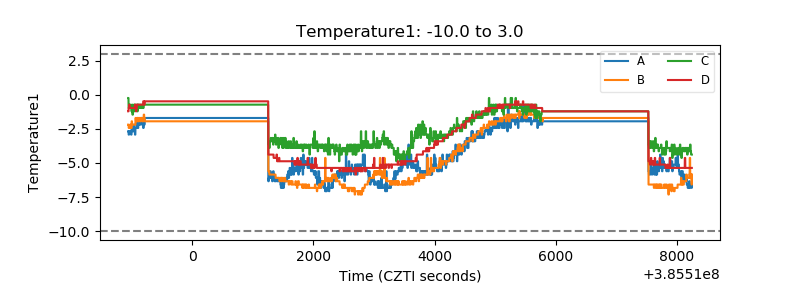 |
| Veto HV Monitor | 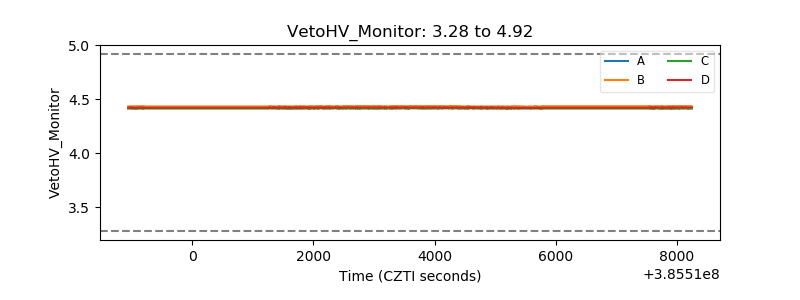 |
| Veto LLD | 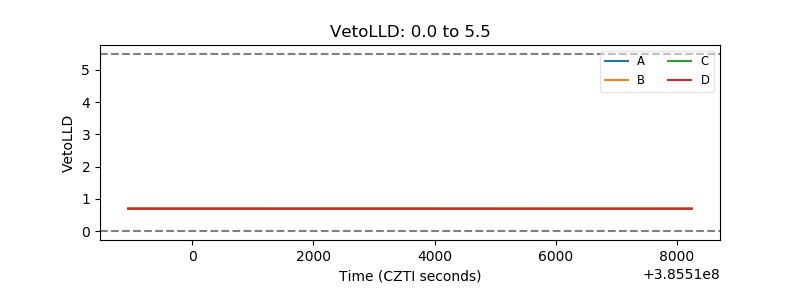 |
| Alpha Counter | 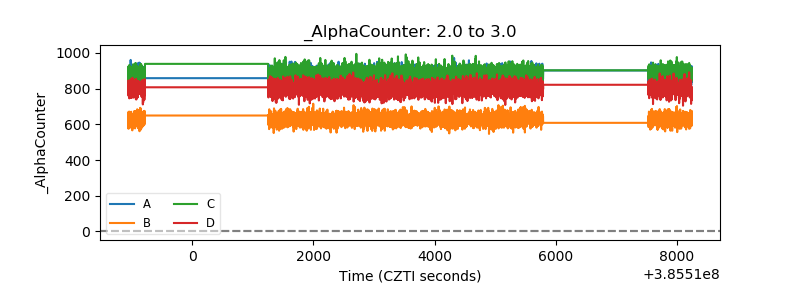 |
| _CPM_Rate | 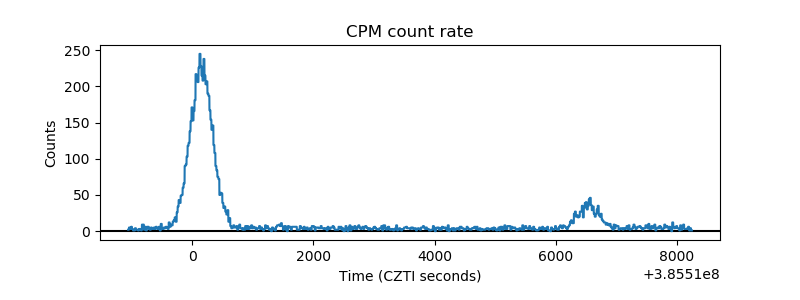 |
| CZT Counter | 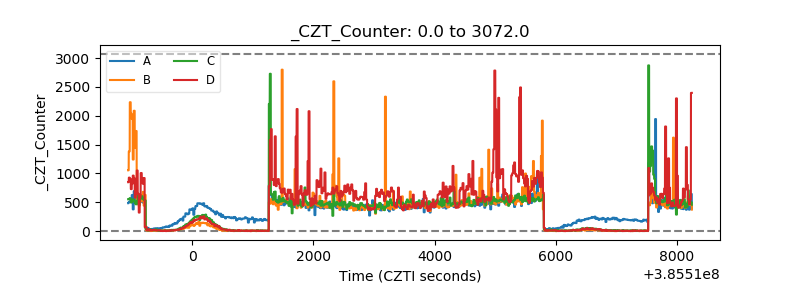 |
| +2.5 Volts monitor |  |
| +5 Volts monitor | 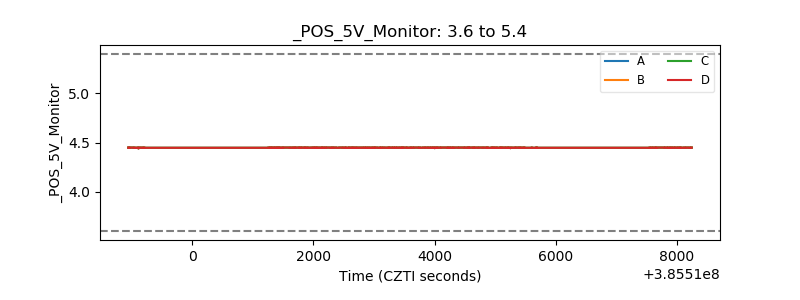 |
| _ROLL_ROT | 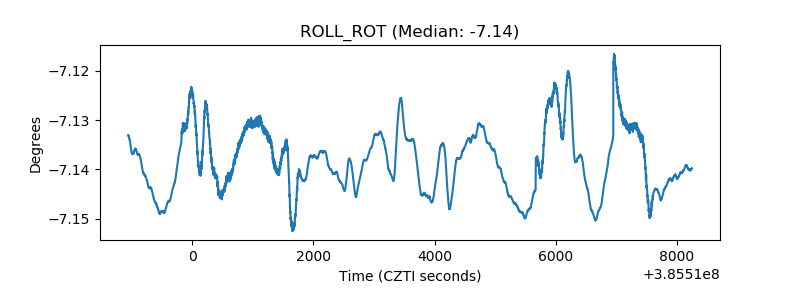 |
| _Roll_DEC | 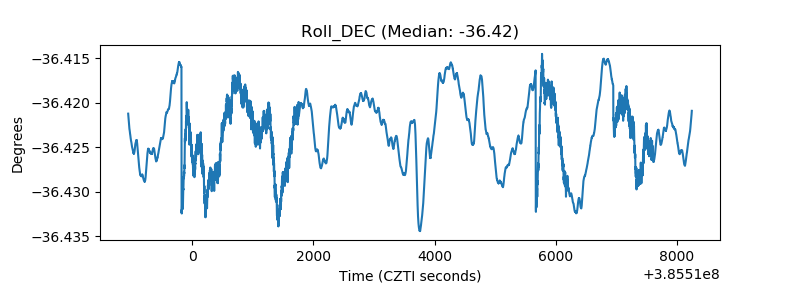 |
| _Roll_RA | 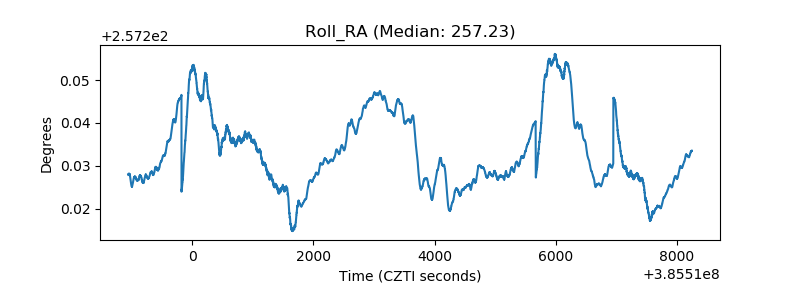 |
| Veto Counter | 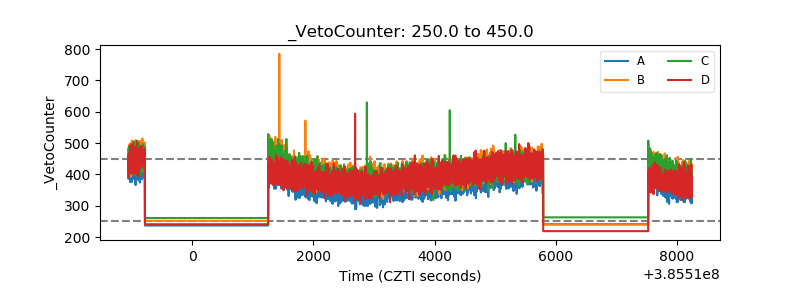 |