| Param | Original file | Final file |
|---|---|---|
| Filename | modeM0/AS1T05_010T01_9000005016_35018cztM0_level2.evt | modeM0/AS1T05_010T01_9000005016_35018cztM0_level2_quad_clean.evt |
| Size (bytes) | 403,096,320 | 89,873,280 |
| Size | 384.4 MB | 85.7 MB |
| Events in quadrant A | 2,377,094 | 606,187 |
| Events in quadrant B | 3,233,997 | 615,016 |
| Events in quadrant C | 2,723,857 | 595,810 |
| Events in quadrant D | 3,536,538 | 557,787 |
| Mode M0 | |||
|---|---|---|---|
| Quadrant | BADHDUFLAG | Total packets | Discarded packets |
| A | 0 | 10208 | 3 |
| B | 0 | 12758 | 2 |
| C | 0 | 10877 | 2 |
| D | 0 | 13885 | 2 |
| Mode M9 | |||
|---|---|---|---|
| Quadrant | BADHDUFLAG | Total packets | Discarded packets |
| A | 0 | 38 | 0 |
| B | 0 | 38 | 0 |
| C | 0 | 38 | 0 |
| D | 0 | 39 | 0 |
| Mode SS | |||
|---|---|---|---|
| Quadrant | BADHDUFLAG | Total packets | Discarded packets |
| A | 0 | 100 | 0 |
| B | 0 | 100 | 0 |
| C | 0 | 100 | 0 |
| D | 0 | 100 | 0 |
| Quadrant | Total seconds | Saturated seconds | Saturation percentage |
|---|---|---|---|
| A | 4951 | 9 | 0.181781% |
| B | 4951 | 191 | 3.857807% |
| C | 4951 | 89 | 1.797617% |
| D | 4951 | 151 | 3.049889% |
Noise dominated data is calculated using 1-second bins in cleaned event files. If a bin has >2000 counts, and if more than 50% of those come from <1% of pixels, then it is considered to be noise-dominated and hence unusable.
| Quadrant | # 1 sec bins | Bins with >0 counts | Bins with >2000 counts | High rate bins dominated by noise | Noise dominated (total time) | Noise dominated (detector-on time) | Marked lightcurve |
|---|---|---|---|---|---|---|---|
| A | 6984 | 4952 | 3 | 3 | 0.04% | 0.06% | 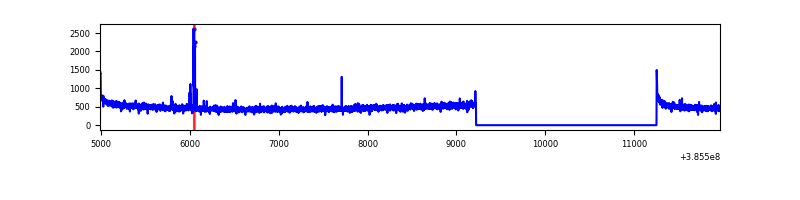 |
| B | 6984 | 4952 | 138 | 138 | 1.98% | 2.79% | 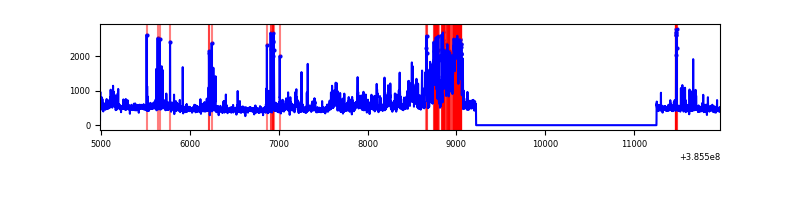 |
| C | 6984 | 4952 | 84 | 84 | 1.20% | 1.70% | 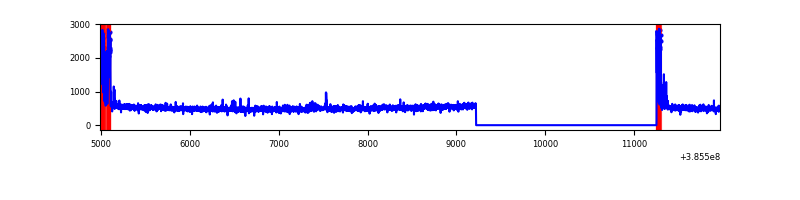 |
| D | 6984 | 4952 | 147 | 147 | 2.10% | 2.97% | 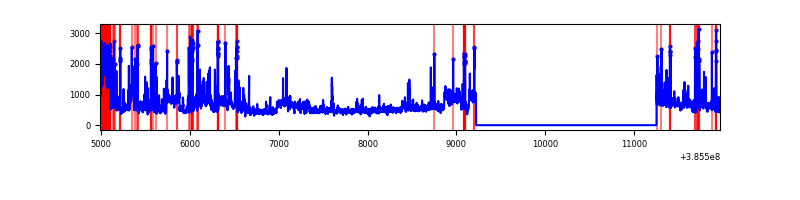 |
Top three noisy pixels from each quadrant. If the there are fewer than three noisy pixels in the level2.evt file, extra rows are filled as -1
| Pixel properties | Quadrant properties | ||||||
|---|---|---|---|---|---|---|---|
| Quadrant | DetID | PixID | Counts | Sigma | Mean | Median | Sigma |
| A | 10 | 83 | 73275 | 612.04 | 588 | 579 | 118.8 |
| A | 15 | 223 | 23070 | 189.35 | 588 | 579 | 118.8 |
| A | 13 | 254 | 8419 | 66.01 | 588 | 579 | 118.8 |
| B | 5 | 31 | 468379 | 4193.18 | 584 | 571 | 111.6 |
| B | 5 | 15 | 180633 | 1613.98 | 584 | 571 | 111.6 |
| B | 5 | 172 | 160164 | 1430.51 | 584 | 571 | 111.6 |
| C | 0 | 10 | 250893 | 1891.7 | 571 | 577 | 132.3 |
| C | 15 | 214 | 208559 | 1571.77 | 571 | 577 | 132.3 |
| C | 14 | 67 | 16957 | 123.79 | 571 | 577 | 132.3 |
| D | 8 | 195 | 708350 | 5167.67 | 564 | 551 | 137.0 |
| D | 13 | 249 | 221363 | 1612.16 | 564 | 551 | 137.0 |
| D | 10 | 118 | 151660 | 1103.25 | 564 | 551 | 137.0 |
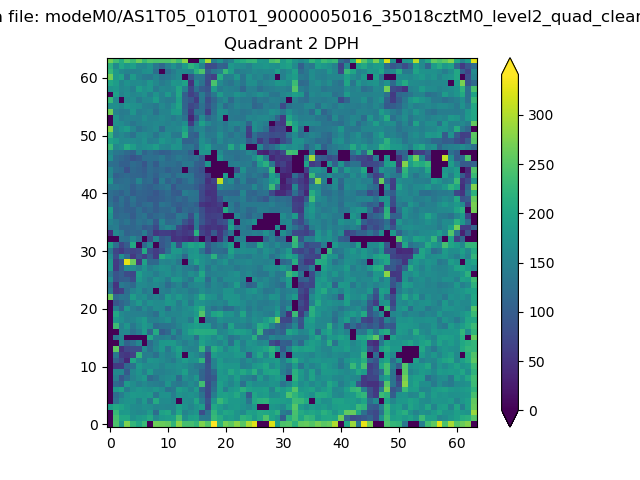
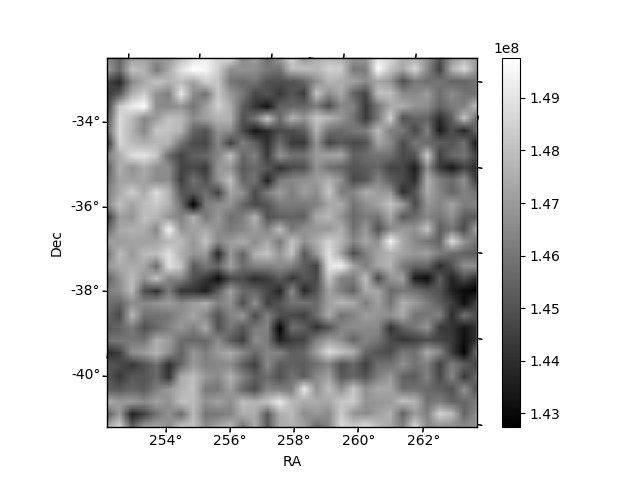
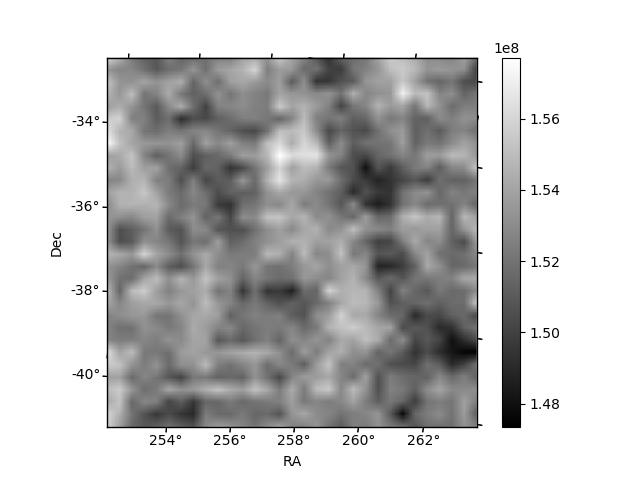
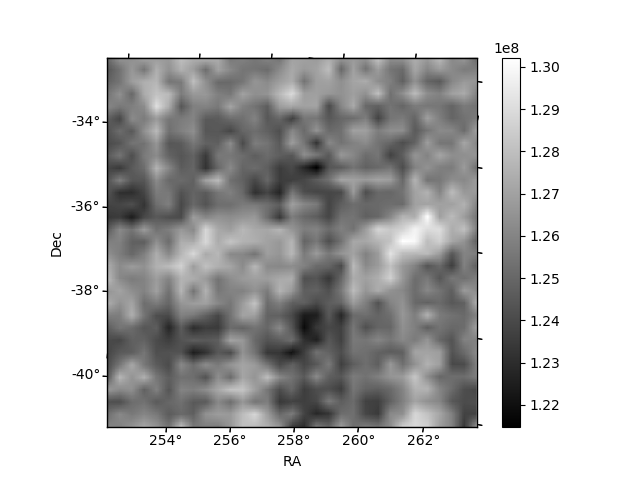
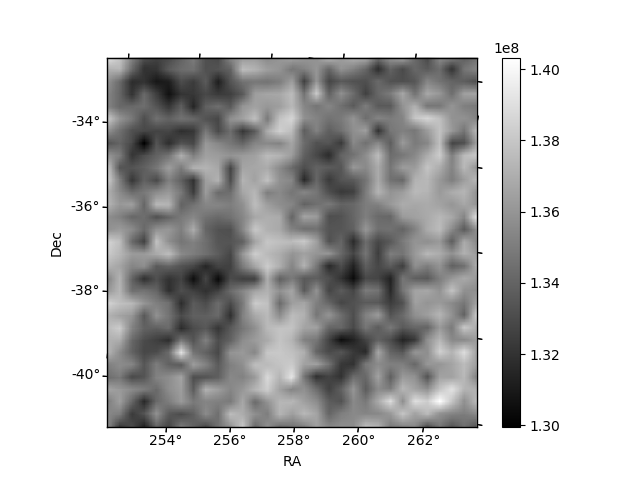
Histogram calculated using DETX and DETY for each event in the final _common_clean file
| Quadrant A | 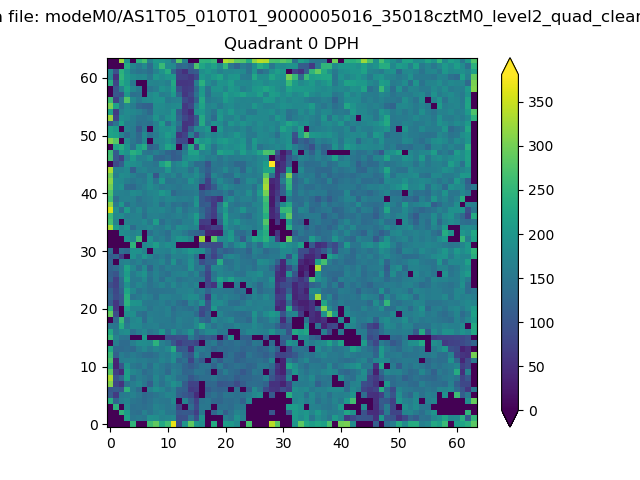 |
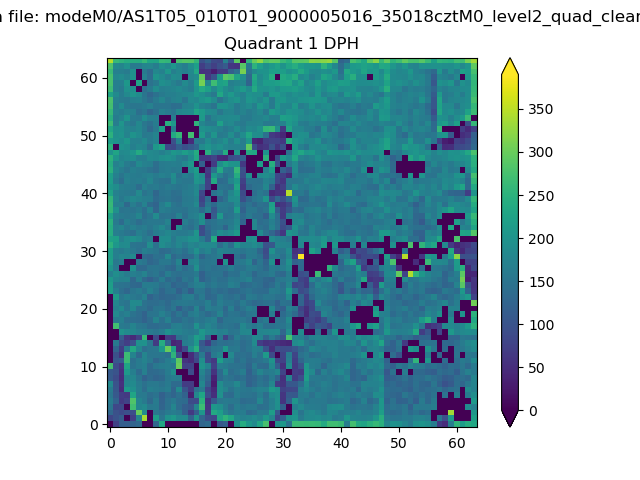 |
Quadrant B |
|---|---|---|---|
| Quadrant D | 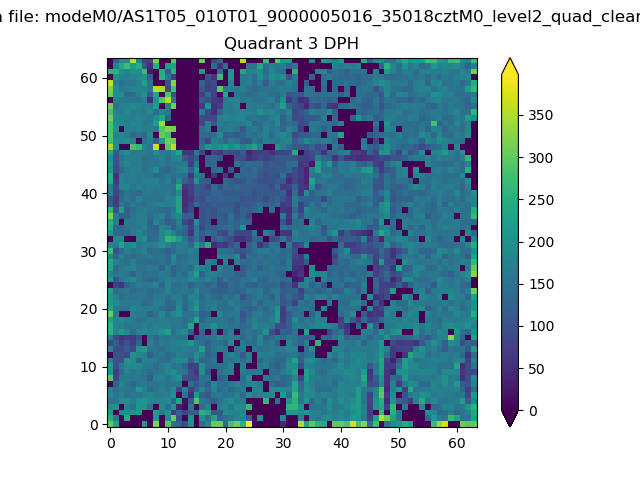 |
 |
Quadrant C |
| Plot type | Count rate plots | Images |
|---|---|---|
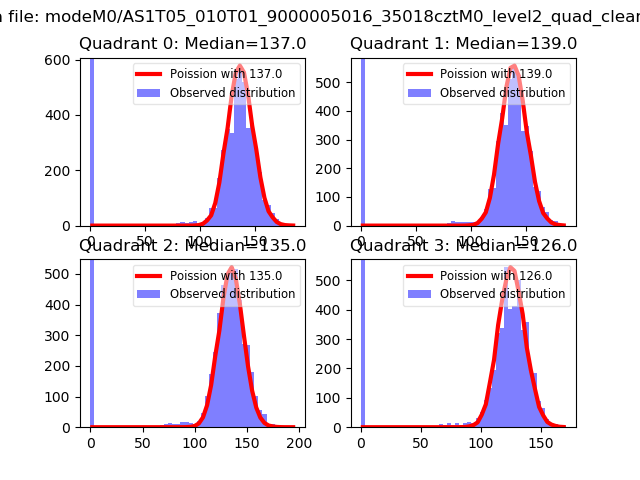
| Comparison with Poisson distribution Blue bars denote a histogram of data divided into 1 sec bins. Red curve is a Poisson curve with rate = median count rate of data. |
 |
 |
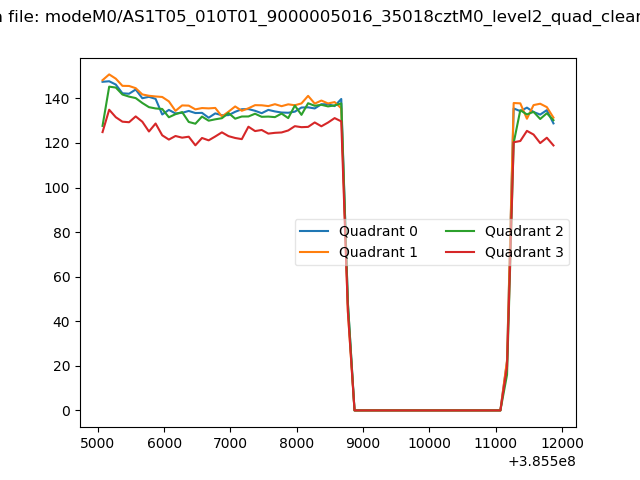
| Quadrant-wise count rates Data is divided into 100 sec bins |
 |
|
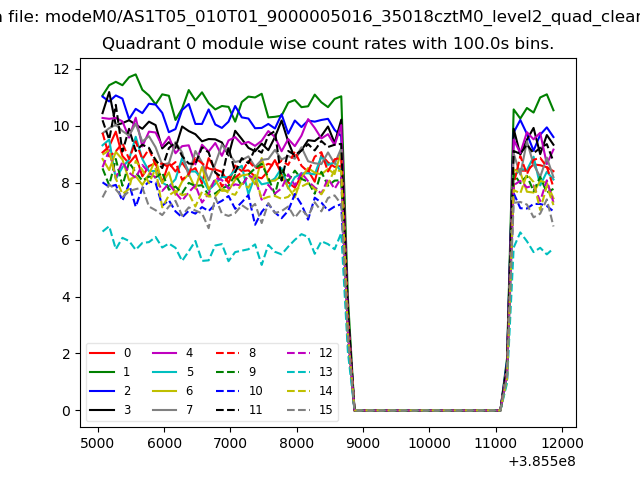
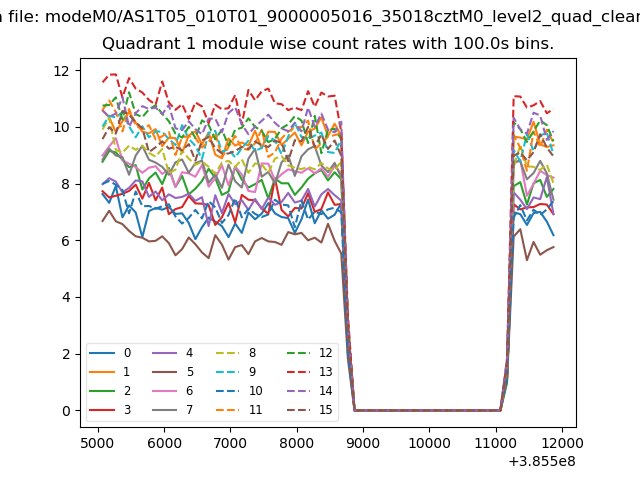
| Module-wise count rates for Quadrant A Data is divided into 100 sec bins |
 |
 |
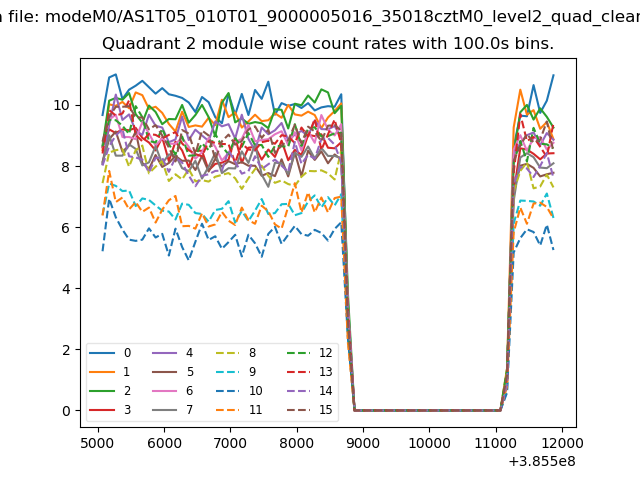
| Module-wise count rates for Quadrant B Data is divided into 100 sec bins |
 |
 |
| Module-wise count rates for Quadrant C Data is divided into 100 sec bins |
 |
 |
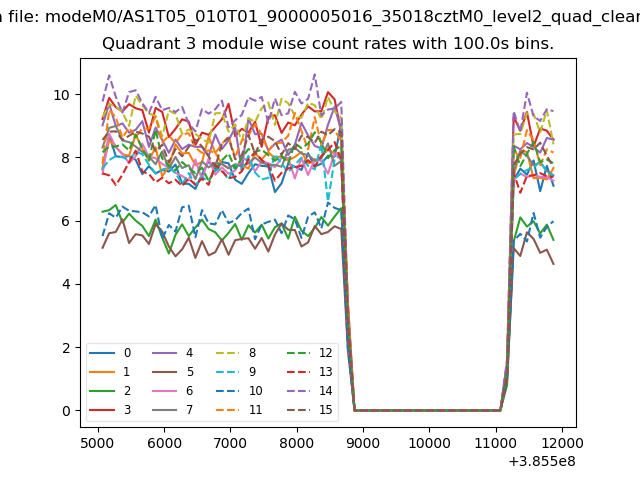
| Module-wise count rates for Quadrant D Data is divided into 100 sec bins |
 |
 |
| Parameter | Plot |
|---|---|
| CZT HV Monitor | 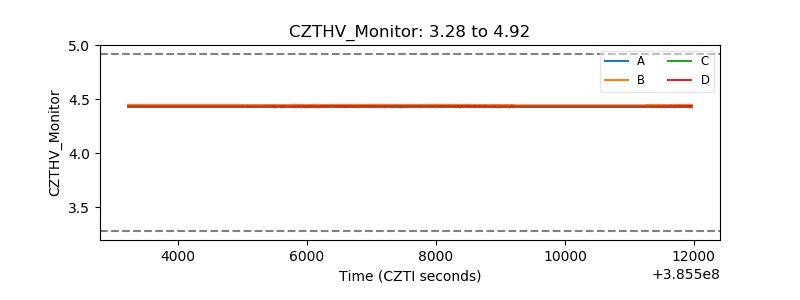 |
| D_VDD | 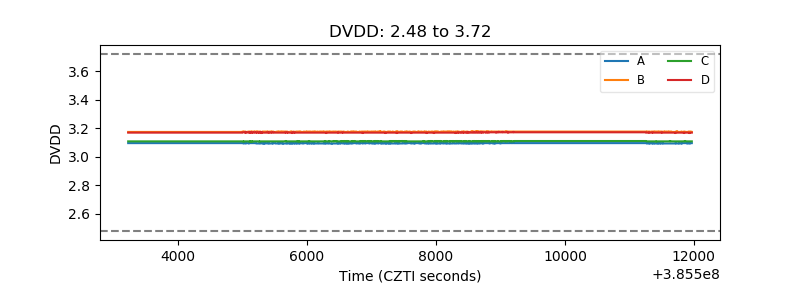 |
| Temperature 1 | 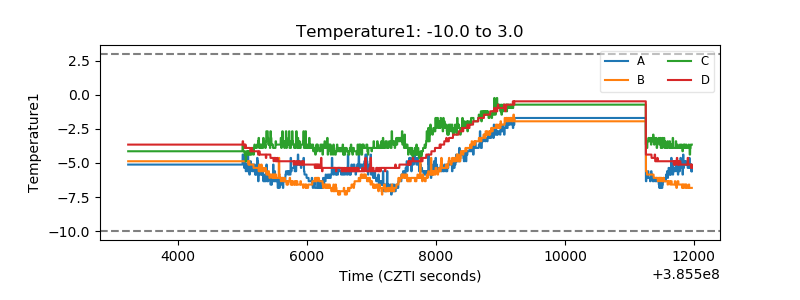 |
| Veto HV Monitor | 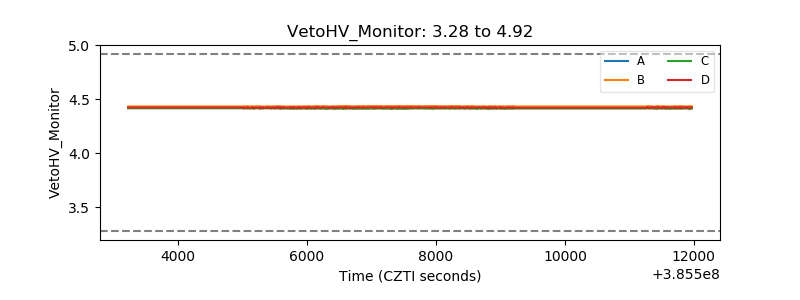 |
| Veto LLD | 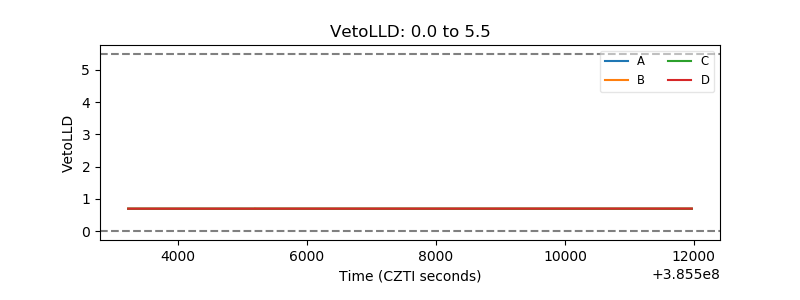 |
| Alpha Counter | 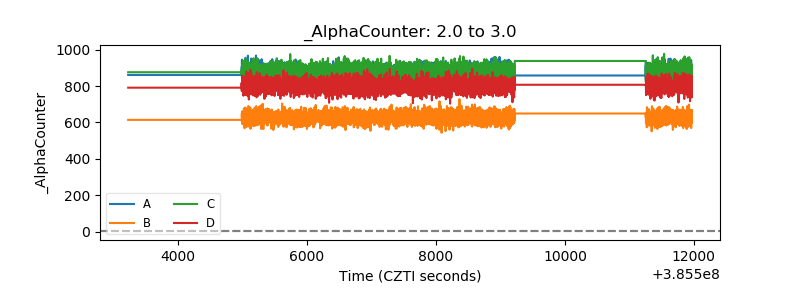 |
| _CPM_Rate | 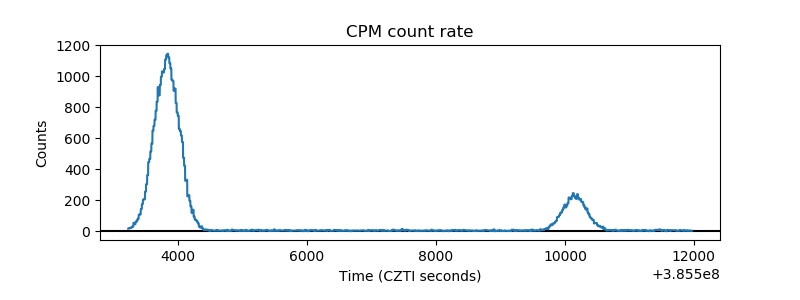 |
| CZT Counter | 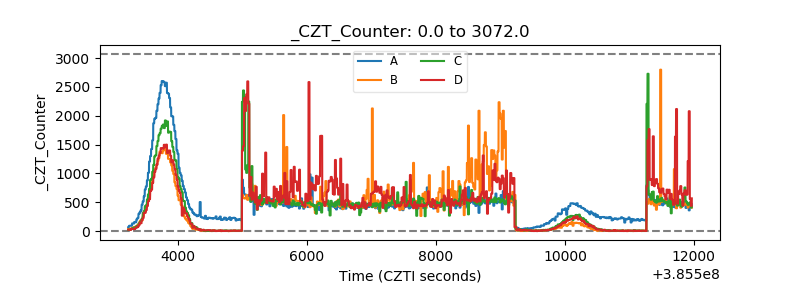 |
| +2.5 Volts monitor | 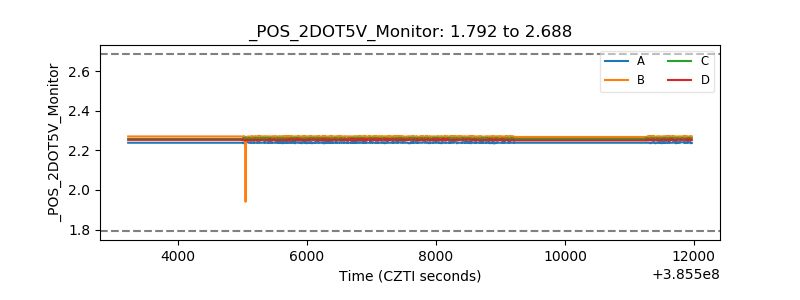 |
| +5 Volts monitor | 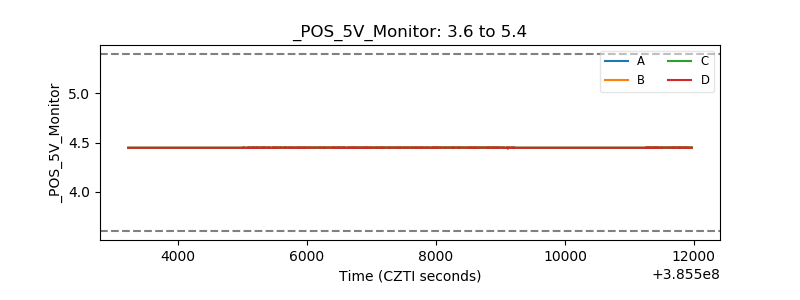 |
| _ROLL_ROT | 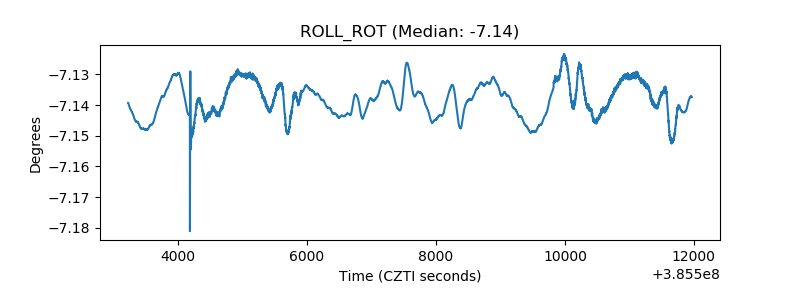 |
| _Roll_DEC | 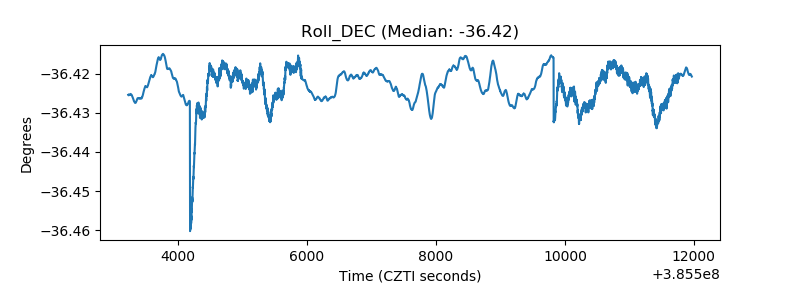 |
| _Roll_RA | 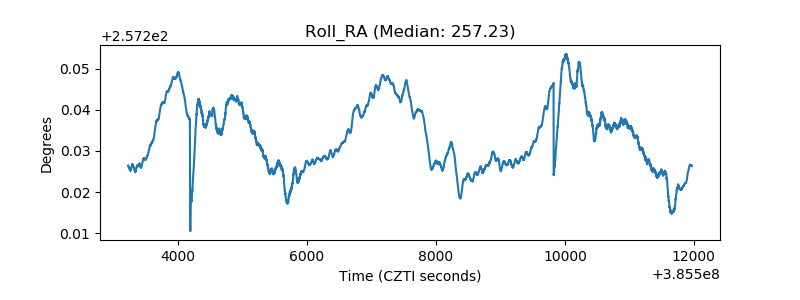 |
| Veto Counter | 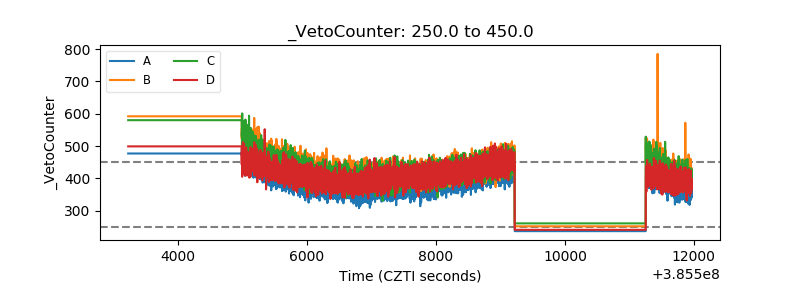 |