| Param | Original file | Final file |
|---|---|---|
| Filename | modeM0/AS1T05_010T01_9000005016_35017cztM0_level2.evt | modeM0/AS1T05_010T01_9000005016_35017cztM0_level2_quad_clean.evt |
| Size (bytes) | 399,294,720 | 92,393,280 |
| Size | 380.8 MB | 88.1 MB |
| Events in quadrant A | 2,442,430 | 628,185 |
| Events in quadrant B | 2,668,084 | 637,803 |
| Events in quadrant C | 2,846,708 | 615,674 |
| Events in quadrant D | 3,804,136 | 574,434 |
| Mode M0 | |||
|---|---|---|---|
| Quadrant | BADHDUFLAG | Total packets | Discarded packets |
| A | 0 | 10171 | 3 |
| B | 0 | 10827 | 2 |
| C | 0 | 11090 | 2 |
| D | 0 | 14424 | 2 |
| Mode M9 | |||
|---|---|---|---|
| Quadrant | BADHDUFLAG | Total packets | Discarded packets |
| A | 0 | 25 | 0 |
| B | 0 | 25 | 0 |
| C | 0 | 25 | 0 |
| D | 0 | 26 | 0 |
| Mode SS | |||
|---|---|---|---|
| Quadrant | BADHDUFLAG | Total packets | Discarded packets |
| A | 0 | 100 | 0 |
| B | 0 | 100 | 0 |
| C | 0 | 100 | 0 |
| D | 0 | 100 | 0 |
| Quadrant | Total seconds | Saturated seconds | Saturation percentage |
|---|---|---|---|
| A | 4873 | 4 | 0.082085% |
| B | 4873 | 32 | 0.656680% |
| C | 4873 | 130 | 2.667761% |
| D | 4873 | 137 | 2.811410% |
Noise dominated data is calculated using 1-second bins in cleaned event files. If a bin has >2000 counts, and if more than 50% of those come from <1% of pixels, then it is considered to be noise-dominated and hence unusable.
| Quadrant | # 1 sec bins | Bins with >0 counts | Bins with >2000 counts | High rate bins dominated by noise | Noise dominated (total time) | Noise dominated (detector-on time) | Marked lightcurve |
|---|---|---|---|---|---|---|---|
| A | 6996 | 4874 | 0 | 0 | 0.00% | 0.00% | 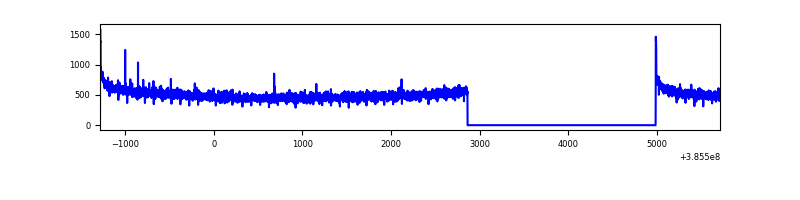 |
| B | 6996 | 4874 | 23 | 23 | 0.33% | 0.47% | 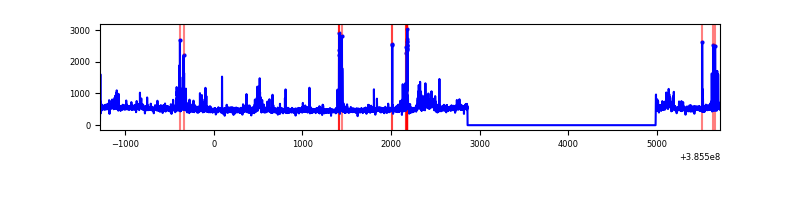 |
| C | 6996 | 4874 | 119 | 119 | 1.70% | 2.44% | 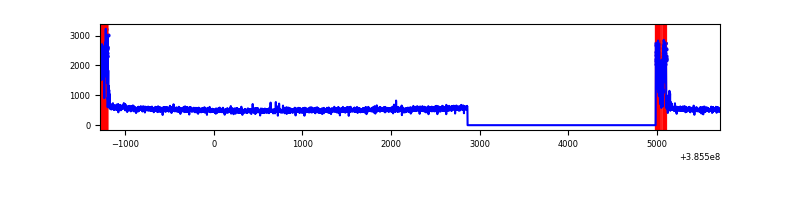 |
| D | 6996 | 4874 | 127 | 127 | 1.82% | 2.61% | 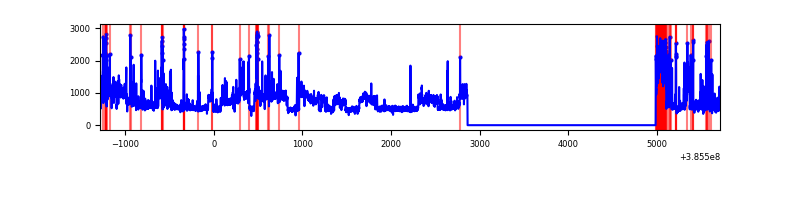 |
Top three noisy pixels from each quadrant. If the there are fewer than three noisy pixels in the level2.evt file, extra rows are filled as -1
| Pixel properties | Quadrant properties | ||||||
|---|---|---|---|---|---|---|---|
| Quadrant | DetID | PixID | Counts | Sigma | Mean | Median | Sigma |
| A | 10 | 83 | 74691 | 608.93 | 610 | 600 | 121.7 |
| A | 13 | 254 | 8676 | 66.37 | 610 | 600 | 121.7 |
| A | 13 | 6 | 6790 | 50.87 | 610 | 600 | 121.7 |
| B | 5 | 172 | 117971 | 1019.36 | 609 | 595 | 115.1 |
| B | 4 | 232 | 75297 | 648.76 | 609 | 595 | 115.1 |
| B | 0 | 190 | 31724 | 270.34 | 609 | 595 | 115.1 |
| C | 0 | 10 | 339523 | 2517.94 | 586 | 593 | 134.6 |
| C | 15 | 214 | 203923 | 1510.56 | 586 | 593 | 134.6 |
| C | 14 | 67 | 11550 | 81.4 | 586 | 593 | 134.6 |
| D | 8 | 195 | 964061 | 6829.26 | 580 | 565 | 141.1 |
| D | 10 | 118 | 174558 | 1233.26 | 580 | 565 | 141.1 |
| D | 13 | 249 | 138025 | 974.31 | 580 | 565 | 141.1 |
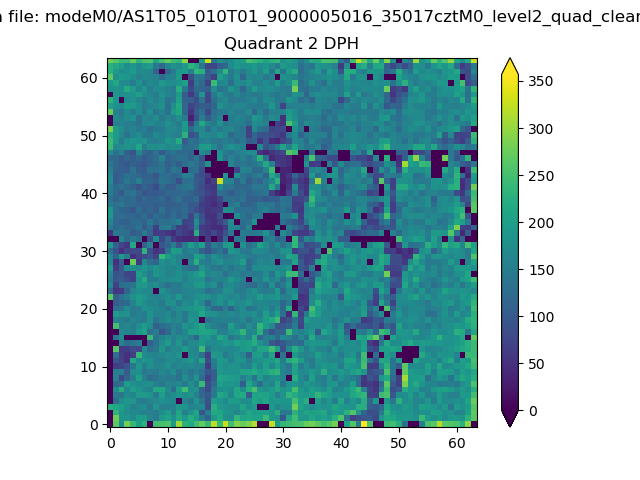
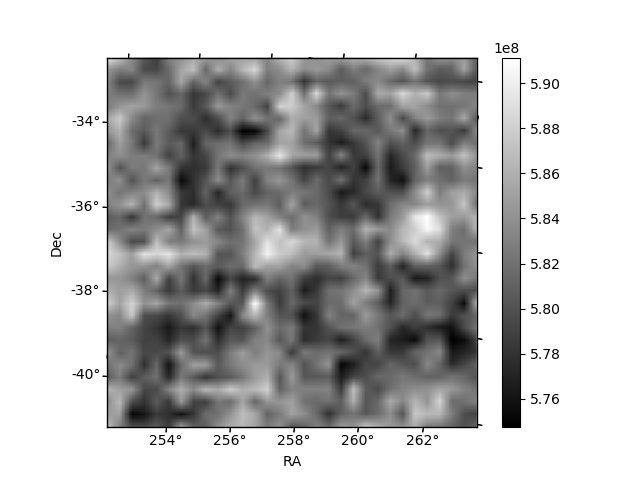
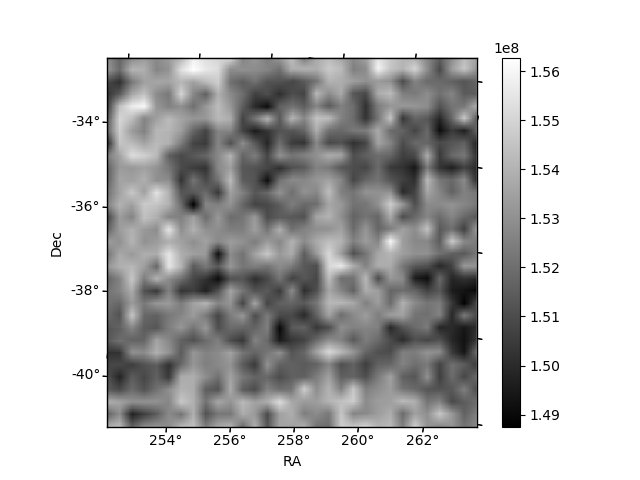
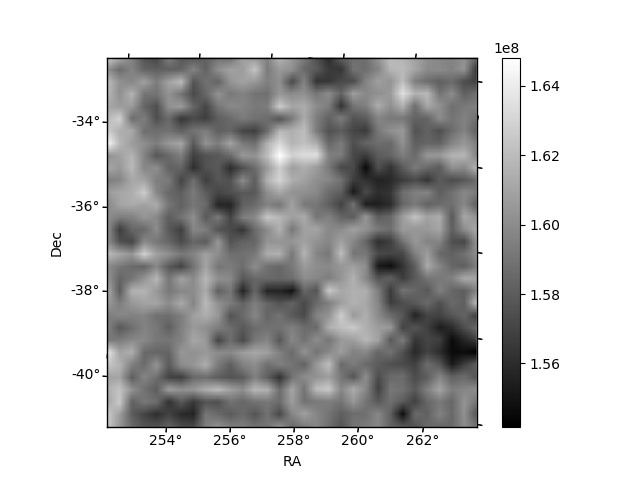
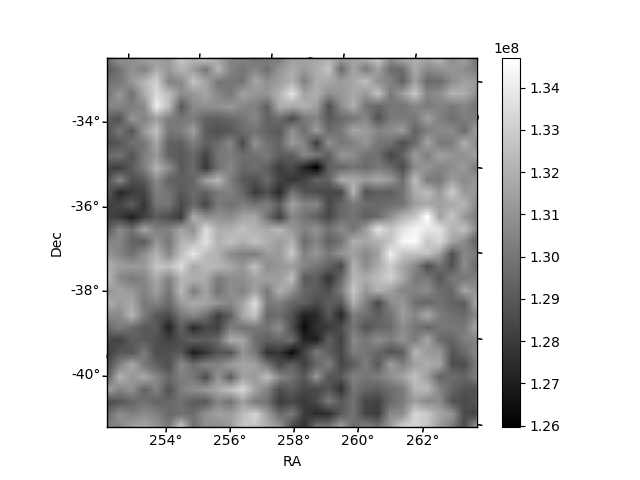
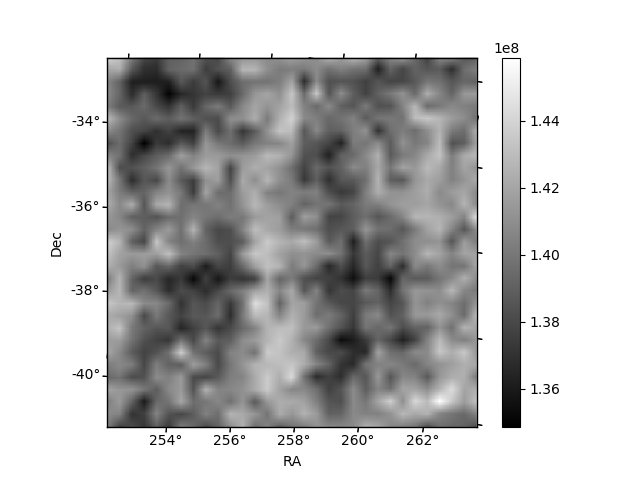
Histogram calculated using DETX and DETY for each event in the final _common_clean file
| Quadrant A | 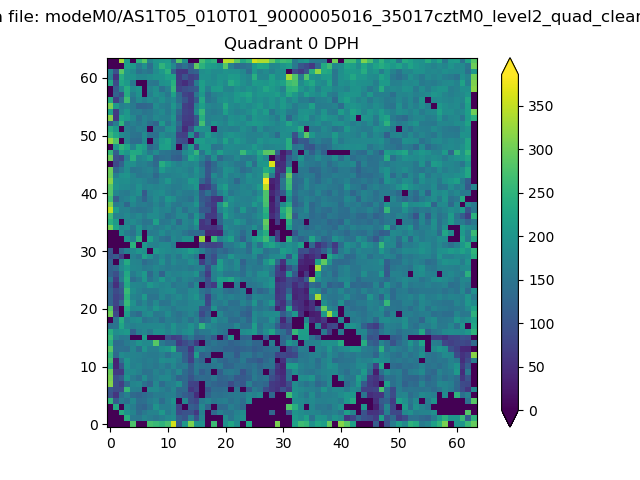 |
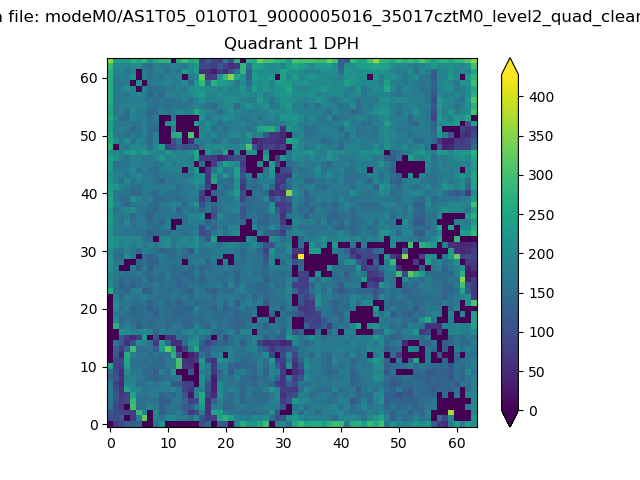 |
Quadrant B |
|---|---|---|---|
| Quadrant D | 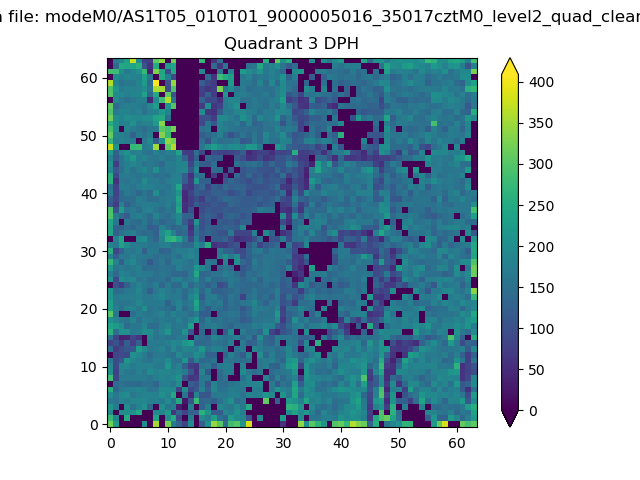 |
 |
Quadrant C |
| Plot type | Count rate plots | Images |
|---|---|---|
| Comparison with Poisson distribution Blue bars denote a histogram of data divided into 1 sec bins. Red curve is a Poisson curve with rate = median count rate of data. |
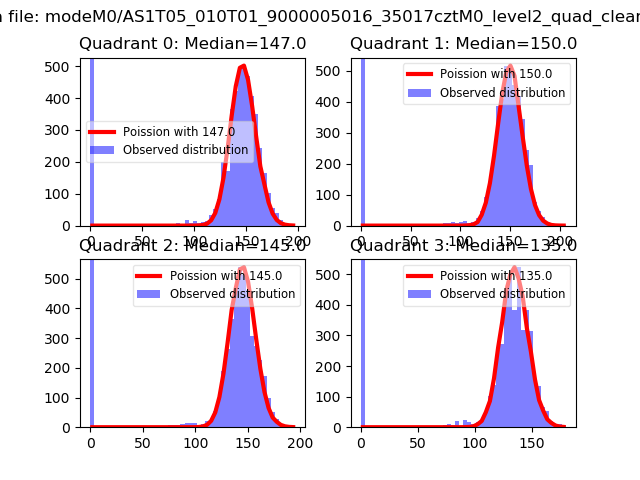 |
 |
| Quadrant-wise count rates Data is divided into 100 sec bins |
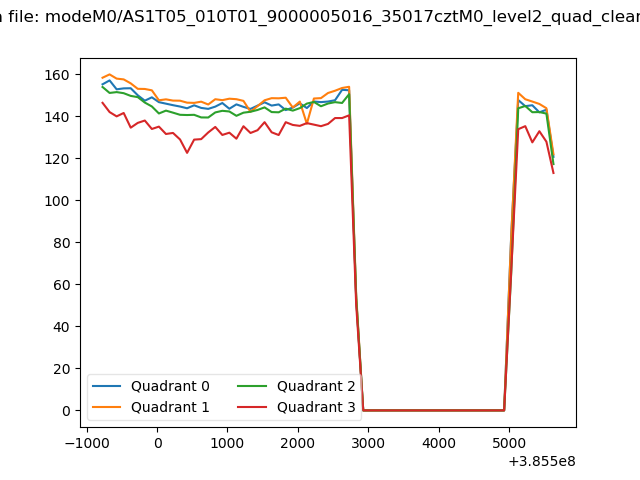 |
|
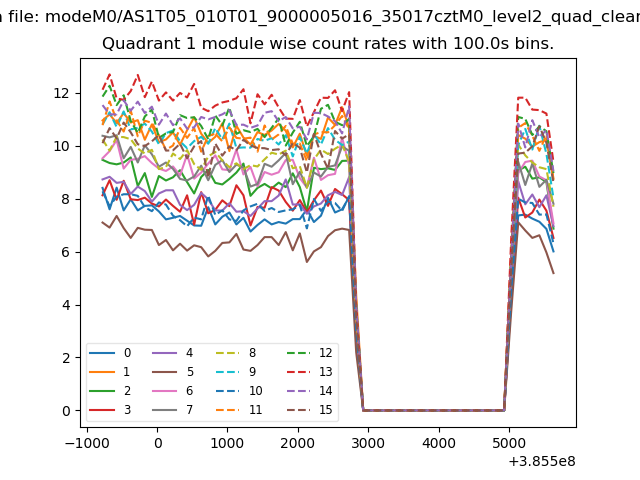
| Module-wise count rates for Quadrant A Data is divided into 100 sec bins |
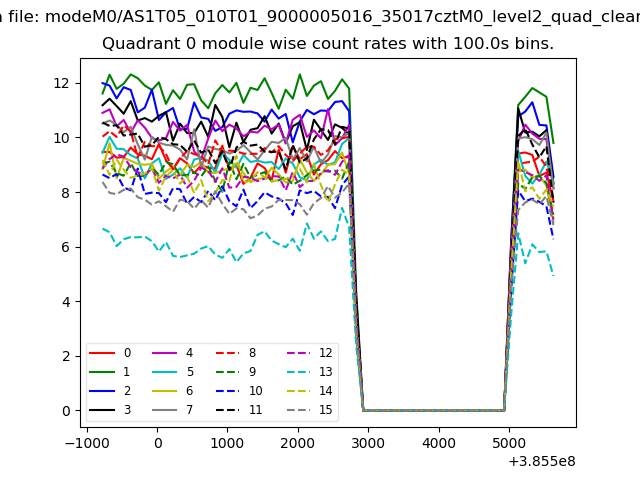 |
 |
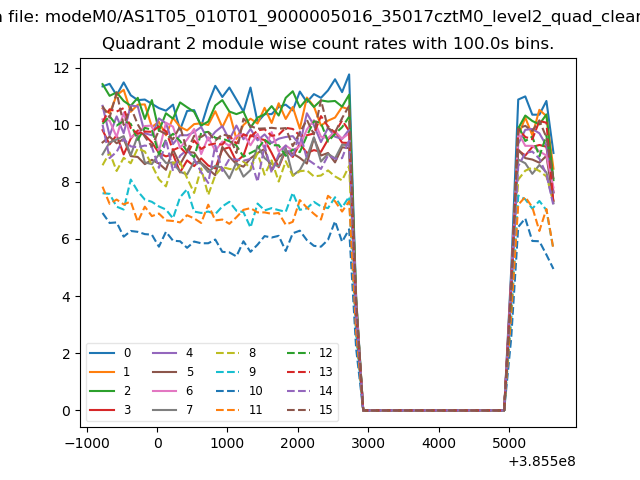
| Module-wise count rates for Quadrant B Data is divided into 100 sec bins |
 |
 |
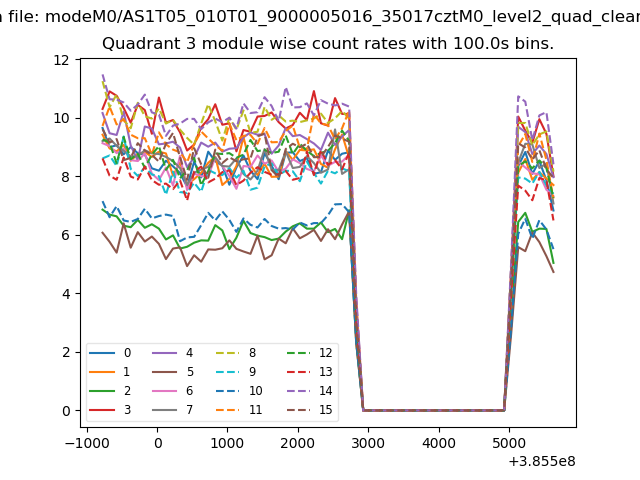
| Module-wise count rates for Quadrant C Data is divided into 100 sec bins |
 |
 |
| Module-wise count rates for Quadrant D Data is divided into 100 sec bins |
 |
 |
| Parameter | Plot |
|---|---|
| CZT HV Monitor | 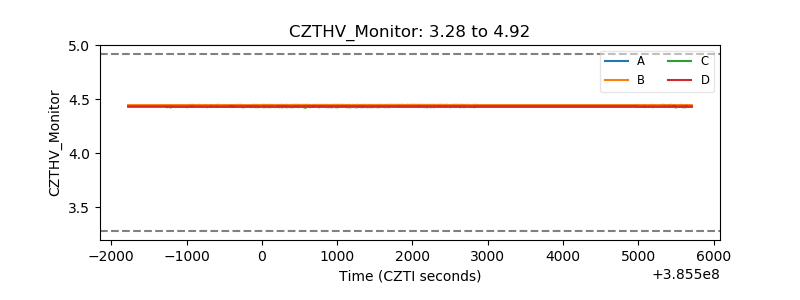 |
| D_VDD | 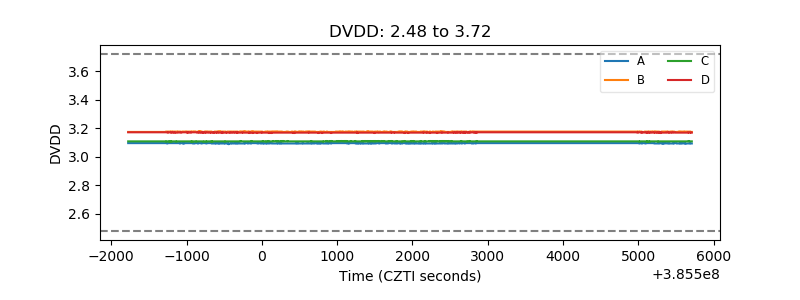 |
| Temperature 1 | 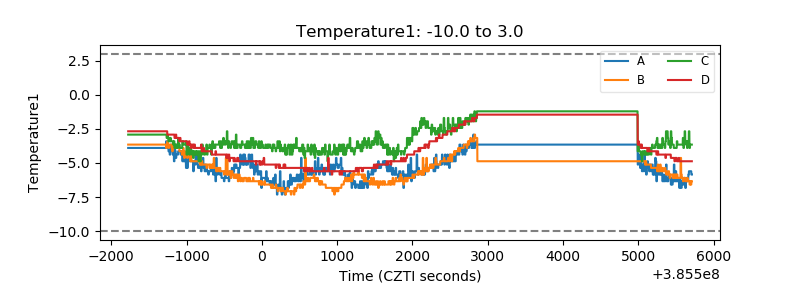 |
| Veto HV Monitor | 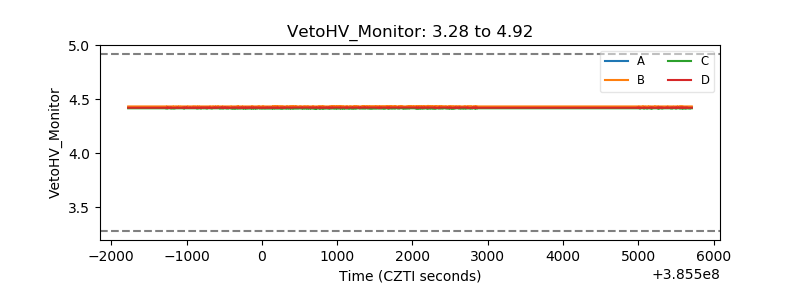 |
| Veto LLD | 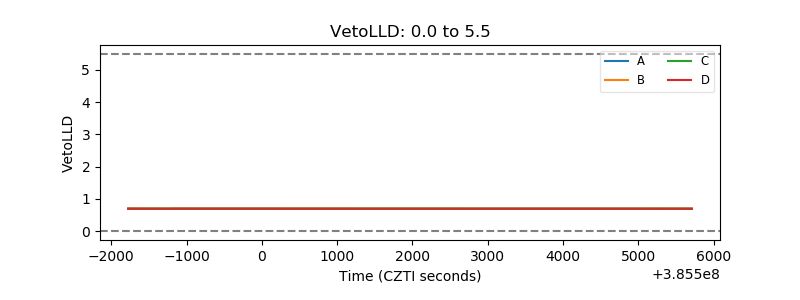 |
| Alpha Counter | 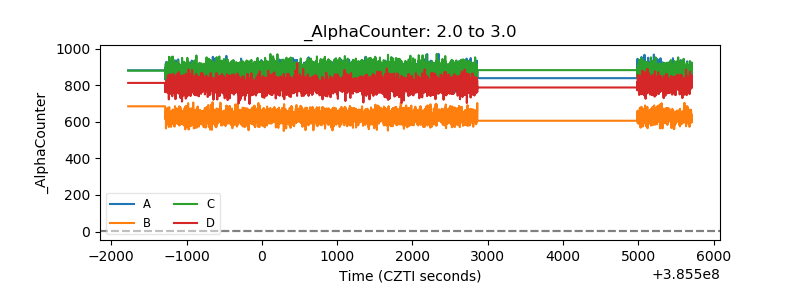 |
| _CPM_Rate | 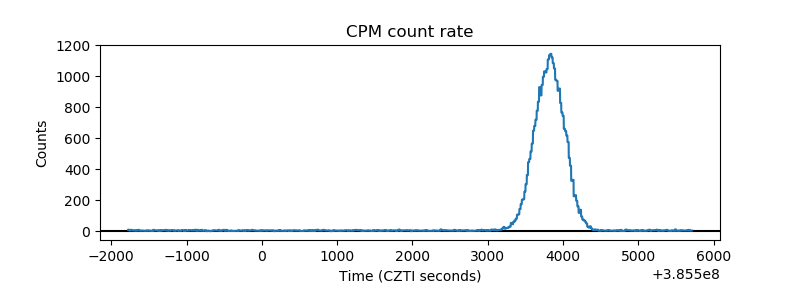 |
| CZT Counter | 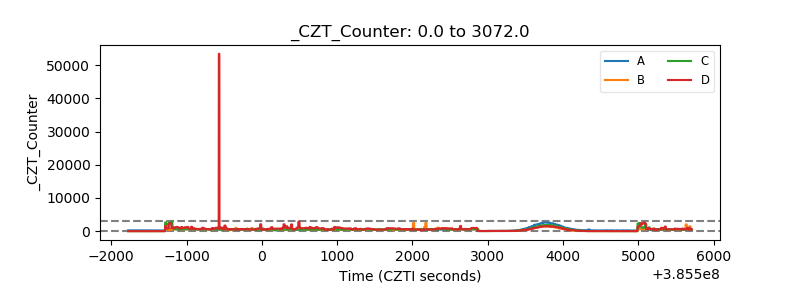 |
| +2.5 Volts monitor | 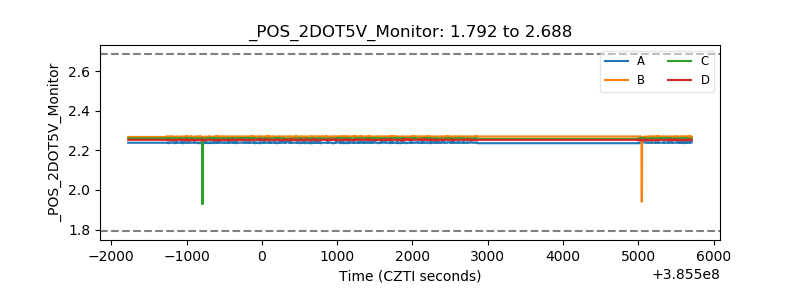 |
| +5 Volts monitor | 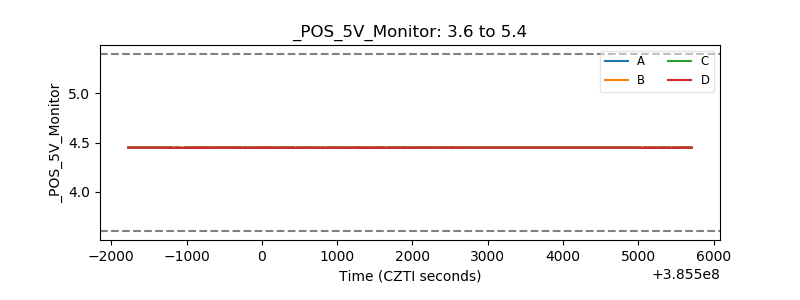 |
| _ROLL_ROT | 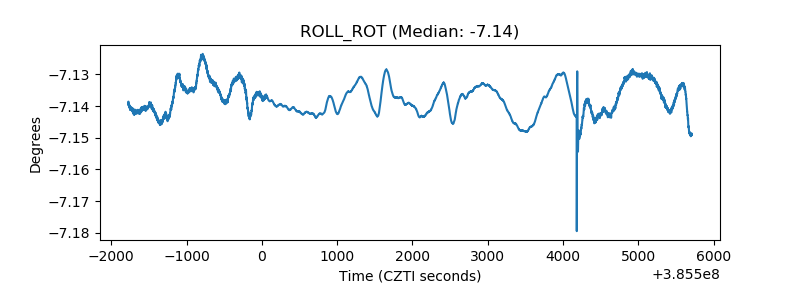 |
| _Roll_DEC | 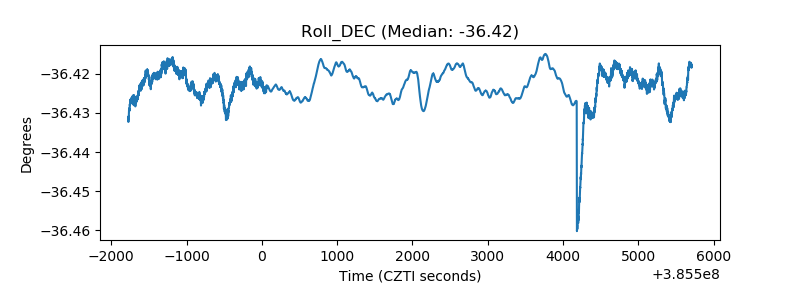 |
| _Roll_RA | 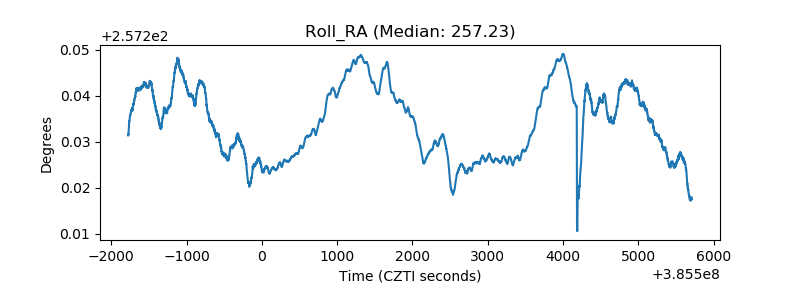 |
| Veto Counter | 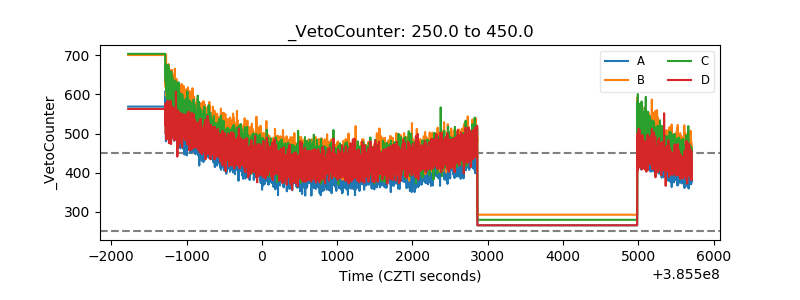 |