| Param | Original file | Final file |
|---|---|---|
| Filename | modeM0/AS1T05_010T01_9000005016_35010cztM0_level2.evt | modeM0/AS1T05_010T01_9000005016_35010cztM0_level2_quad_clean.evt |
| Size (bytes) | 982,051,200 | 150,284,160 |
| Size | 936.6 MB | 143.3 MB |
| Events in quadrant A | 5,822,998 | 933,342 |
| Events in quadrant B | 6,419,167 | 952,175 |
| Events in quadrant C | 6,496,356 | 932,503 |
| Events in quadrant D | 10,160,508 | 871,130 |
| Mode M0 | |||
|---|---|---|---|
| Quadrant | BADHDUFLAG | Total packets | Discarded packets |
| A | 0 | 25410 | 4 |
| B | 0 | 27156 | 3 |
| C | 0 | 26504 | 3 |
| D | 0 | 38894 | 3 |
| Mode M9 | |||
|---|---|---|---|
| Quadrant | BADHDUFLAG | Total packets | Discarded packets |
| A | 0 | 40 | 0 |
| B | 0 | 40 | 0 |
| C | 0 | 40 | 0 |
| D | 0 | 41 | 0 |
| Mode SS | |||
|---|---|---|---|
| Quadrant | BADHDUFLAG | Total packets | Discarded packets |
| A | 0 | 254 | 0 |
| B | 0 | 254 | 0 |
| C | 0 | 254 | 0 |
| D | 0 | 254 | 0 |
| Quadrant | Total seconds | Saturated seconds | Saturation percentage |
|---|---|---|---|
| A | 12471 | 19 | 0.152353% |
| B | 12471 | 104 | 0.833935% |
| C | 12471 | 140 | 1.122604% |
| D | 12471 | 464 | 3.720632% |
Noise dominated data is calculated using 1-second bins in cleaned event files. If a bin has >2000 counts, and if more than 50% of those come from <1% of pixels, then it is considered to be noise-dominated and hence unusable.
| Quadrant | # 1 sec bins | Bins with >0 counts | Bins with >2000 counts | High rate bins dominated by noise | Noise dominated (total time) | Noise dominated (detector-on time) | Marked lightcurve |
|---|---|---|---|---|---|---|---|
| A | 15158 | 12473 | 1 | 1 | 0.01% | 0.01% | 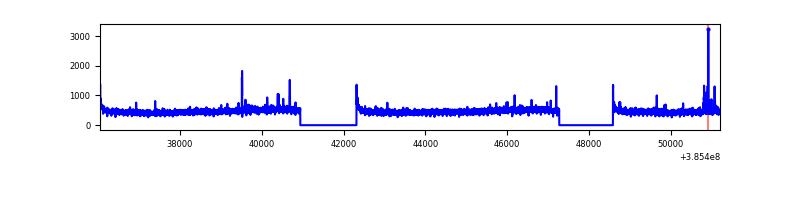 |
| B | 15158 | 12473 | 51 | 51 | 0.34% | 0.41% | 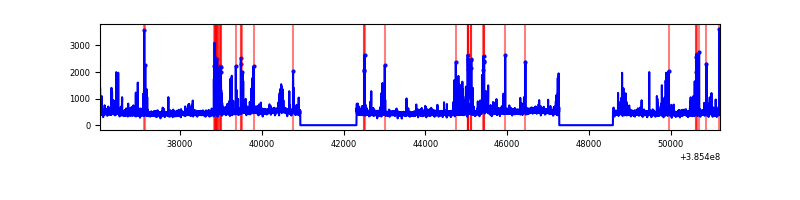 |
| C | 15158 | 12473 | 121 | 121 | 0.80% | 0.97% | 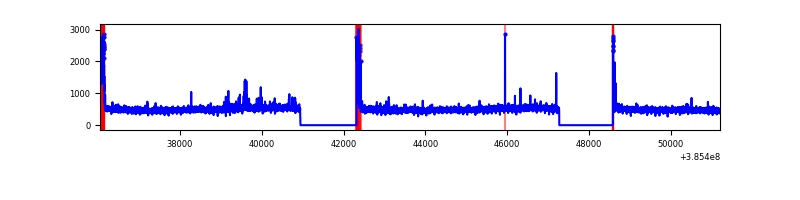 |
| D | 15157 | 12472 | 389 | 389 | 2.57% | 3.12% | 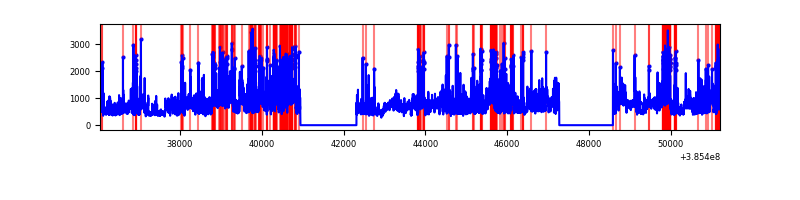 |
Top three noisy pixels from each quadrant. If the there are fewer than three noisy pixels in the level2.evt file, extra rows are filled as -1
| Pixel properties | Quadrant properties | ||||||
|---|---|---|---|---|---|---|---|
| Quadrant | DetID | PixID | Counts | Sigma | Mean | Median | Sigma |
| A | 10 | 83 | 133061 | 453.14 | 1450 | 1421 | 290.5 |
| A | 7 | 3 | 39170 | 129.94 | 1450 | 1421 | 290.5 |
| A | 13 | 254 | 19946 | 63.77 | 1450 | 1421 | 290.5 |
| B | 5 | 172 | 289336 | 1042.78 | 1441 | 1401 | 276.1 |
| B | 0 | 190 | 160359 | 575.68 | 1441 | 1401 | 276.1 |
| B | 4 | 232 | 102047 | 364.5 | 1441 | 1401 | 276.1 |
| C | 15 | 214 | 514914 | 1569.36 | 1415 | 1430 | 327.2 |
| C | 0 | 10 | 396931 | 1208.77 | 1415 | 1430 | 327.2 |
| C | 14 | 67 | 30105 | 87.64 | 1415 | 1430 | 327.2 |
| D | 8 | 195 | 2575502 | 7583.69 | 1403 | 1367 | 339.4 |
| D | 2 | 250 | 550358 | 1617.39 | 1403 | 1367 | 339.4 |
| D | 12 | 233 | 360755 | 1058.8 | 1403 | 1367 | 339.4 |
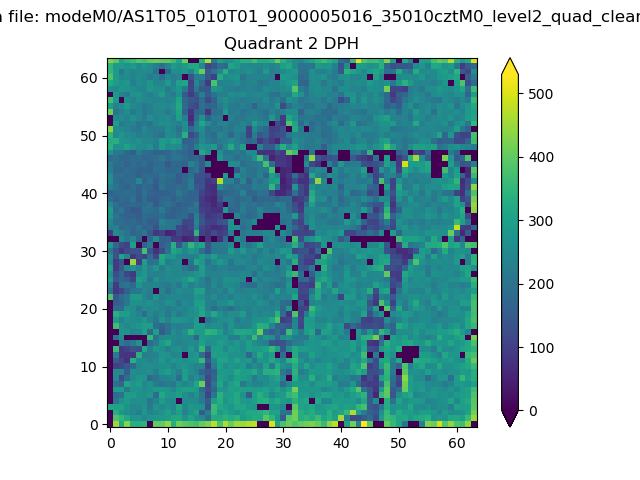
Histogram calculated using DETX and DETY for each event in the final _common_clean file
| Quadrant A | 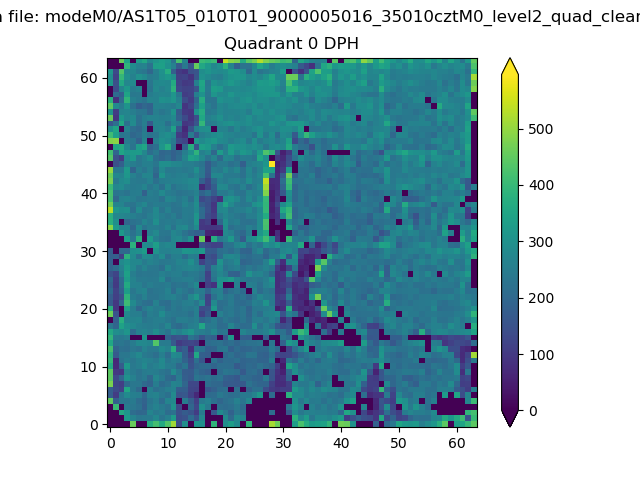 |
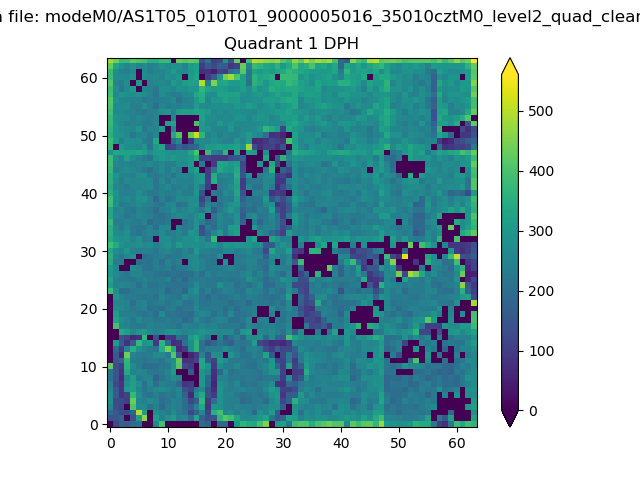 |
Quadrant B |
|---|---|---|---|
| Quadrant D | 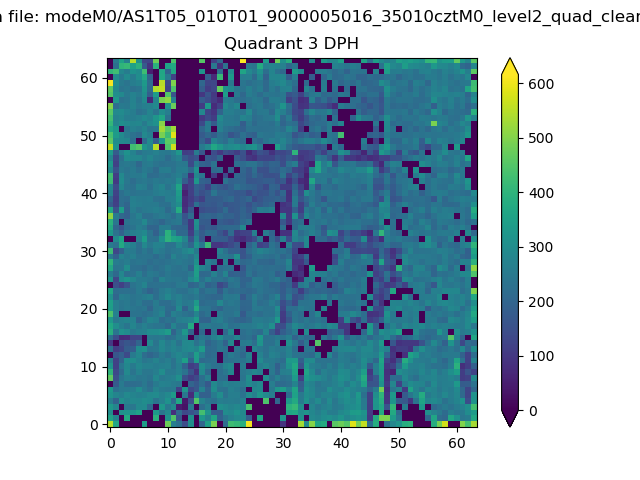 |
 |
Quadrant C |
| Plot type | Count rate plots | Images |
|---|---|---|
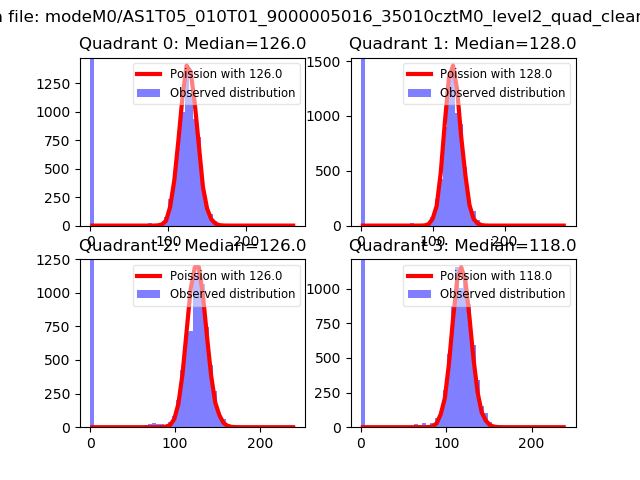
| Comparison with Poisson distribution Blue bars denote a histogram of data divided into 1 sec bins. Red curve is a Poisson curve with rate = median count rate of data. |
 |
 |
| Quadrant-wise count rates Data is divided into 100 sec bins |
 |
|
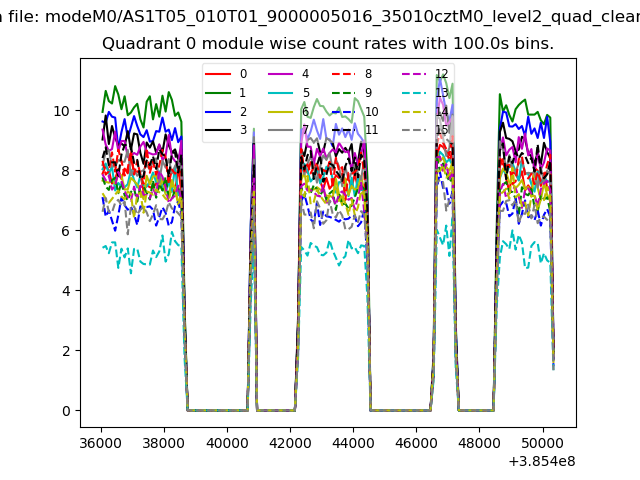
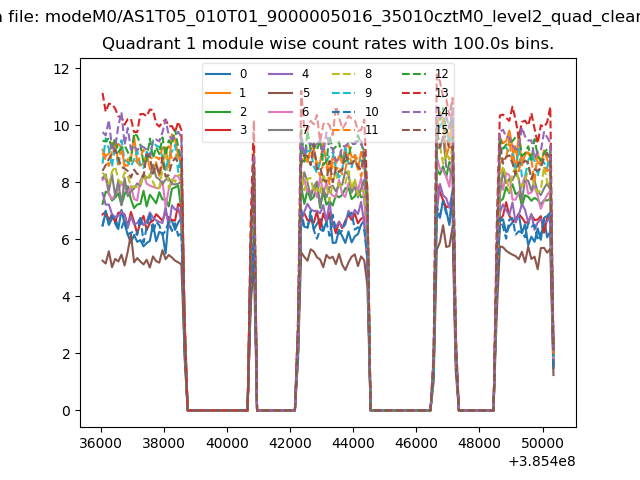
| Module-wise count rates for Quadrant A Data is divided into 100 sec bins |
 |
 |
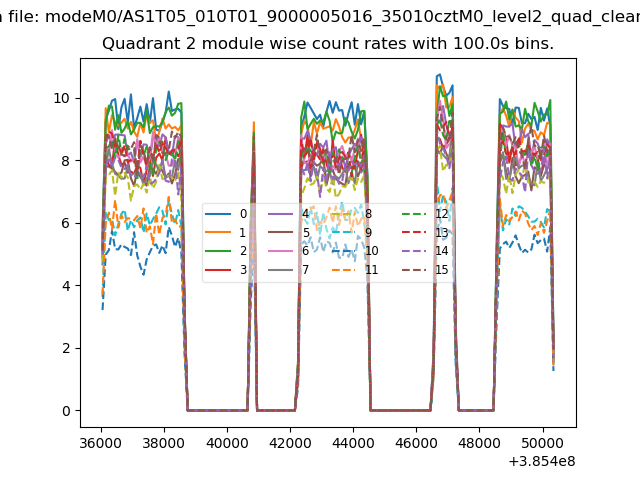
| Module-wise count rates for Quadrant B Data is divided into 100 sec bins |
 |
 |
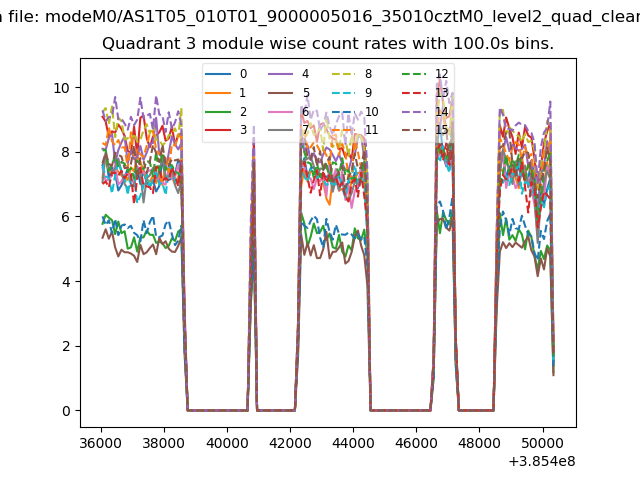
| Module-wise count rates for Quadrant C Data is divided into 100 sec bins |
 |
 |
| Module-wise count rates for Quadrant D Data is divided into 100 sec bins |
 |
 |
| Parameter | Plot |
|---|---|
| CZT HV Monitor | 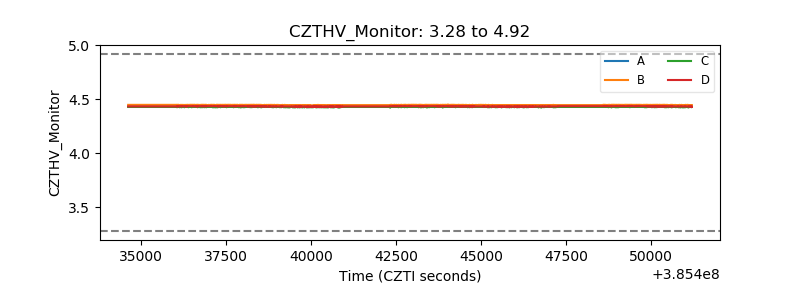 |
| D_VDD | 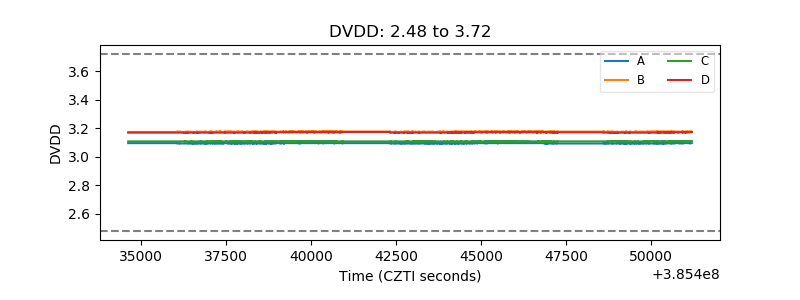 |
| Temperature 1 | 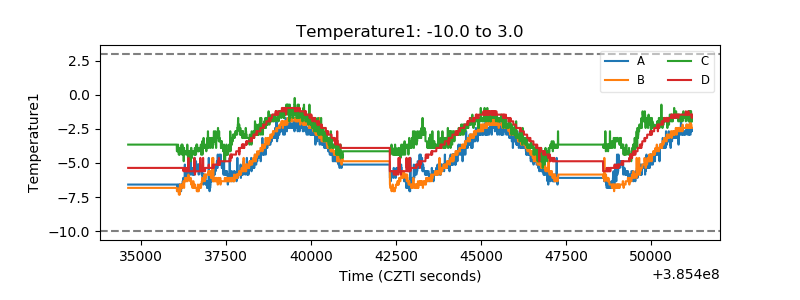 |
| Veto HV Monitor | 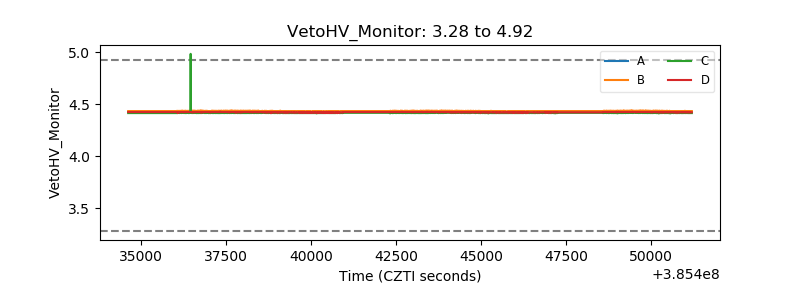 |
| Veto LLD | 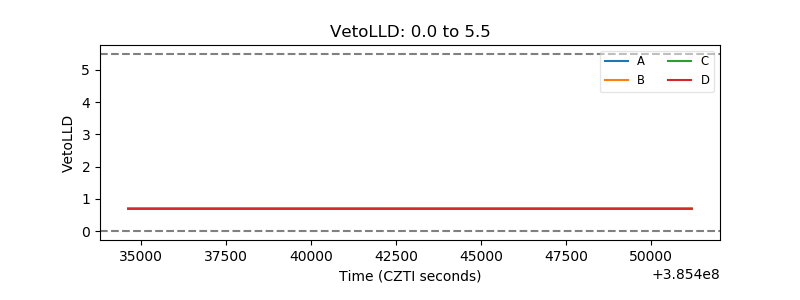 |
| Alpha Counter | 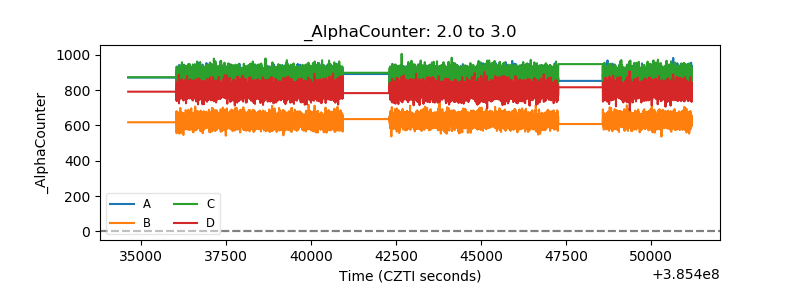 |
| _CPM_Rate | 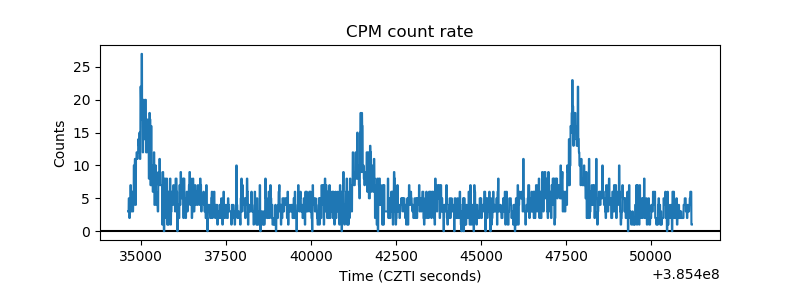 |
| CZT Counter | 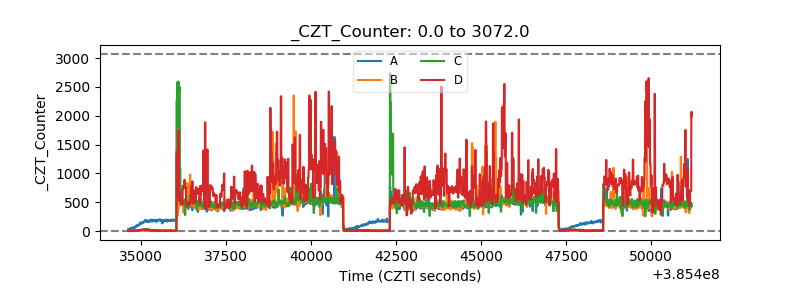 |
| +2.5 Volts monitor | 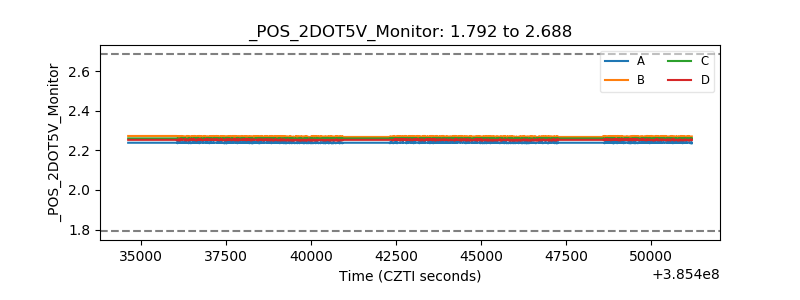 |
| +5 Volts monitor | 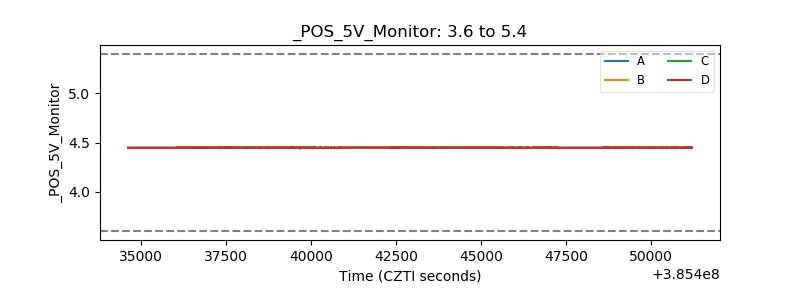 |
| _ROLL_ROT | 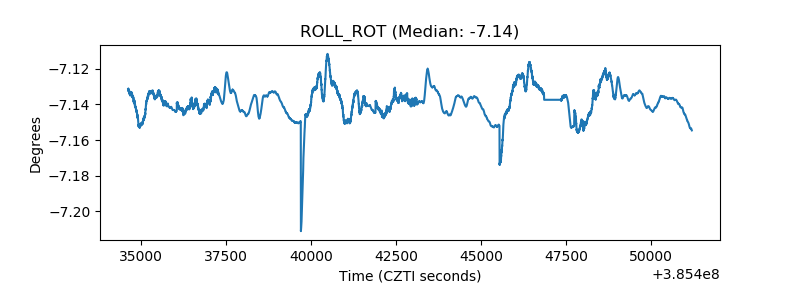 |
| _Roll_DEC | 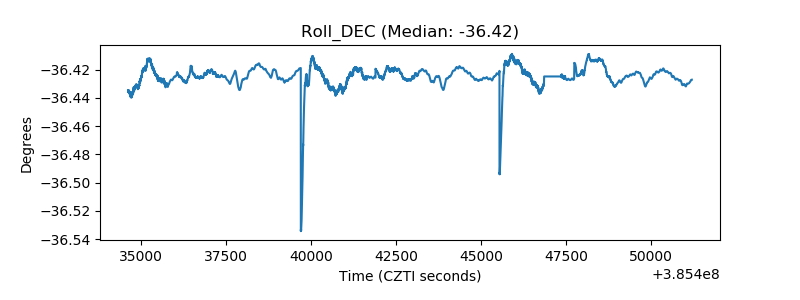 |
| _Roll_RA | 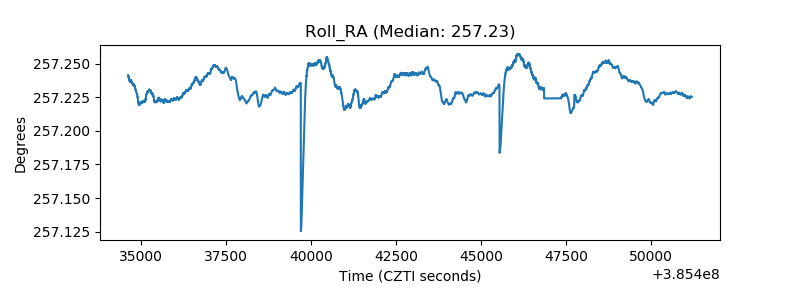 |
| Veto Counter | 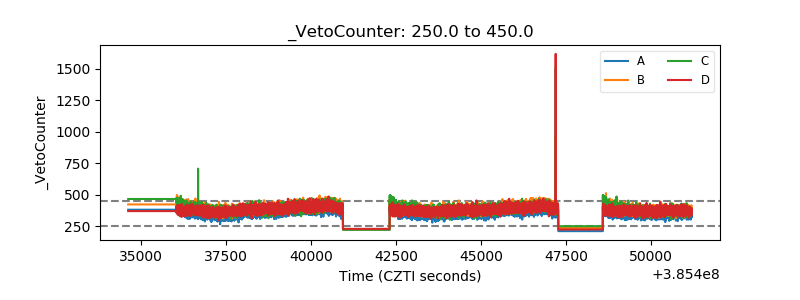 |