| Param | Original file | Final file |
|---|---|---|
| Filename | modeM0/AS1T05_010T01_9000005016_35002cztM0_level2.evt | modeM0/AS1T05_010T01_9000005016_35002cztM0_level2_quad_clean.evt |
| Size (bytes) | 402,384,960 | 88,994,880 |
| Size | 383.7 MB | 84.9 MB |
| Events in quadrant A | 2,601,234 | 602,327 |
| Events in quadrant B | 2,778,919 | 617,228 |
| Events in quadrant C | 2,704,395 | 591,385 |
| Events in quadrant D | 3,775,406 | 546,937 |
| Mode M0 | |||
|---|---|---|---|
| Quadrant | BADHDUFLAG | Total packets | Discarded packets |
| A | 0 | 10655 | 3 |
| B | 0 | 11096 | 2 |
| C | 0 | 10667 | 2 |
| D | 0 | 14478 | 2 |
| Mode M9 | |||
|---|---|---|---|
| Quadrant | BADHDUFLAG | Total packets | Discarded packets |
| A | 0 | 34 | 0 |
| B | 0 | 34 | 0 |
| C | 0 | 34 | 0 |
| D | 0 | 35 | 0 |
| Mode SS | |||
|---|---|---|---|
| Quadrant | BADHDUFLAG | Total packets | Discarded packets |
| A | 0 | 98 | 0 |
| B | 0 | 98 | 0 |
| C | 0 | 98 | 0 |
| D | 0 | 98 | 0 |
| Quadrant | Total seconds | Saturated seconds | Saturation percentage |
|---|---|---|---|
| A | 4806 | 25 | 0.520183% |
| B | 4806 | 39 | 0.811486% |
| C | 4806 | 55 | 1.144403% |
| D | 4806 | 131 | 2.725759% |
Noise dominated data is calculated using 1-second bins in cleaned event files. If a bin has >2000 counts, and if more than 50% of those come from <1% of pixels, then it is considered to be noise-dominated and hence unusable.
| Quadrant | # 1 sec bins | Bins with >0 counts | Bins with >2000 counts | High rate bins dominated by noise | Noise dominated (total time) | Noise dominated (detector-on time) | Marked lightcurve |
|---|---|---|---|---|---|---|---|
| A | 6959 | 4807 | 25 | 25 | 0.36% | 0.52% | 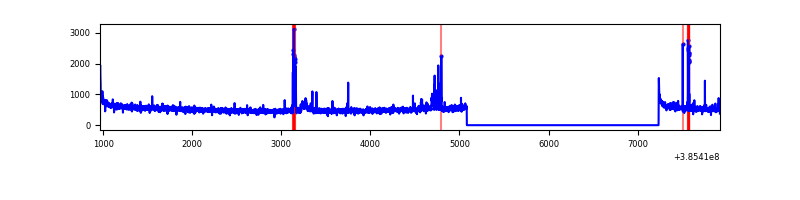 |
| B | 6959 | 4807 | 21 | 21 | 0.30% | 0.44% | 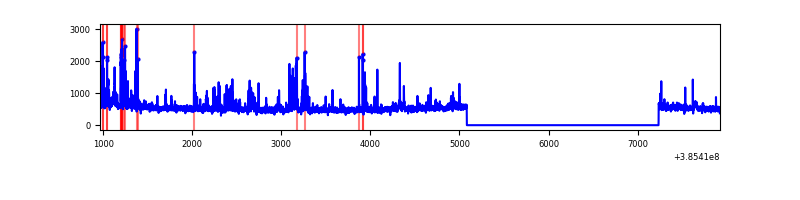 |
| C | 6959 | 4807 | 46 | 46 | 0.66% | 0.96% | 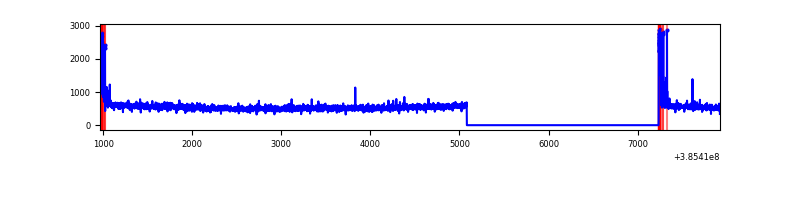 |
| D | 6959 | 4807 | 110 | 110 | 1.58% | 2.29% | 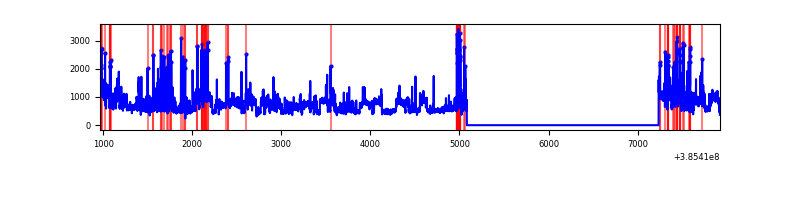 |
Top three noisy pixels from each quadrant. If the there are fewer than three noisy pixels in the level2.evt file, extra rows are filled as -1
| Pixel properties | Quadrant properties | ||||||
|---|---|---|---|---|---|---|---|
| Quadrant | DetID | PixID | Counts | Sigma | Mean | Median | Sigma |
| A | 15 | 174 | 112038 | 910.33 | 612 | 601 | 122.4 |
| A | 10 | 83 | 73614 | 596.44 | 612 | 601 | 122.4 |
| A | 15 | 169 | 39907 | 321.09 | 612 | 601 | 122.4 |
| B | 5 | 172 | 116333 | 1010.38 | 613 | 601 | 114.5 |
| B | 4 | 232 | 93979 | 815.23 | 613 | 601 | 114.5 |
| B | 0 | 190 | 69986 | 605.76 | 613 | 601 | 114.5 |
| C | 15 | 214 | 202244 | 1478.99 | 591 | 597 | 136.3 |
| C | 0 | 10 | 153494 | 1121.43 | 591 | 597 | 136.3 |
| C | 14 | 67 | 41537 | 300.28 | 591 | 597 | 136.3 |
| D | 8 | 195 | 874654 | 6176.57 | 581 | 566 | 141.5 |
| D | 12 | 6 | 220770 | 1556.03 | 581 | 566 | 141.5 |
| D | 12 | 128 | 93002 | 653.18 | 581 | 566 | 141.5 |
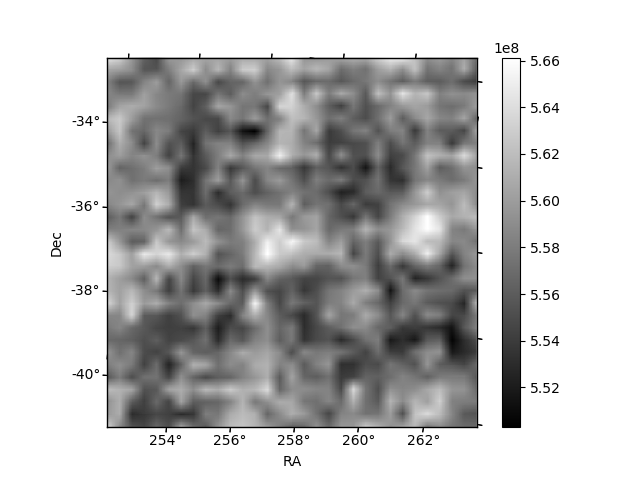
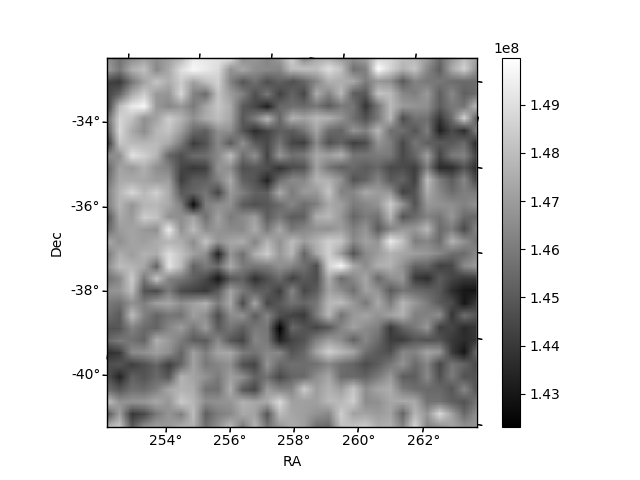
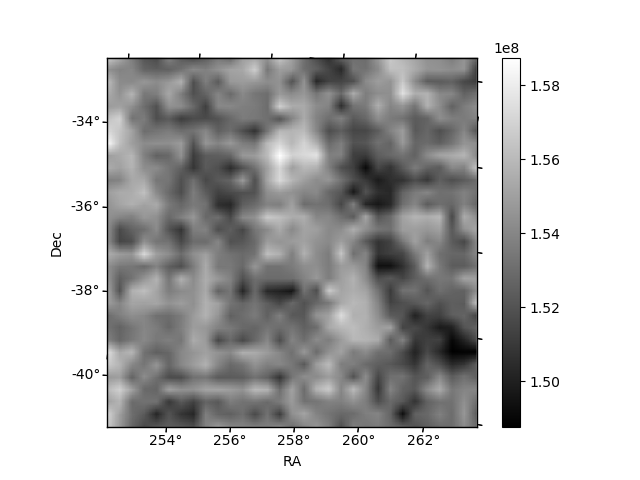
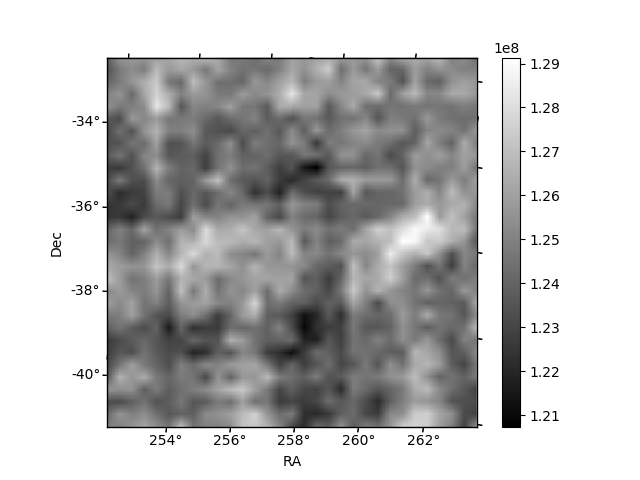
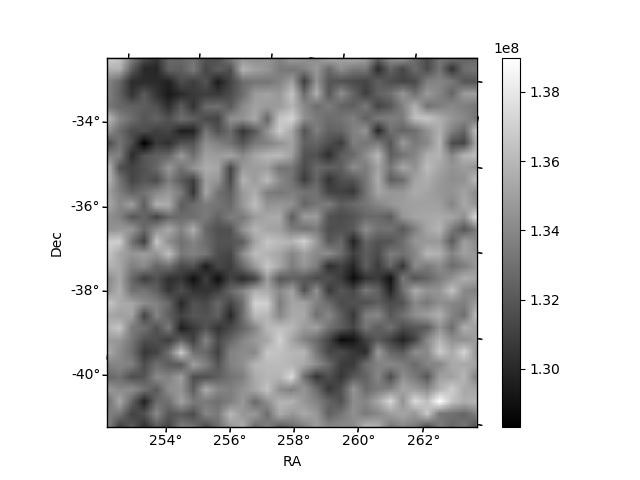
Histogram calculated using DETX and DETY for each event in the final _common_clean file
| Quadrant A | 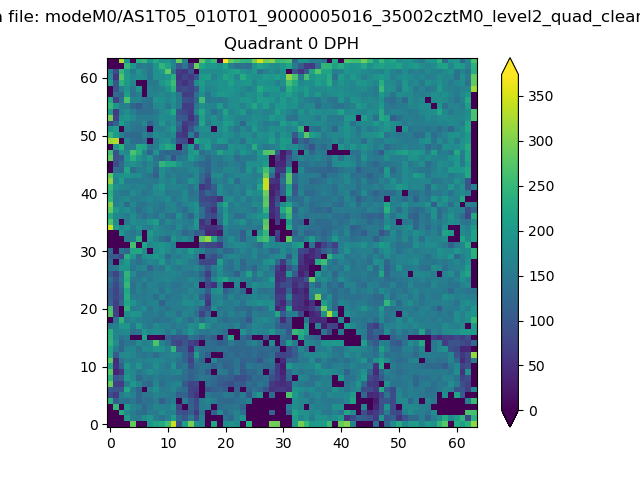 |
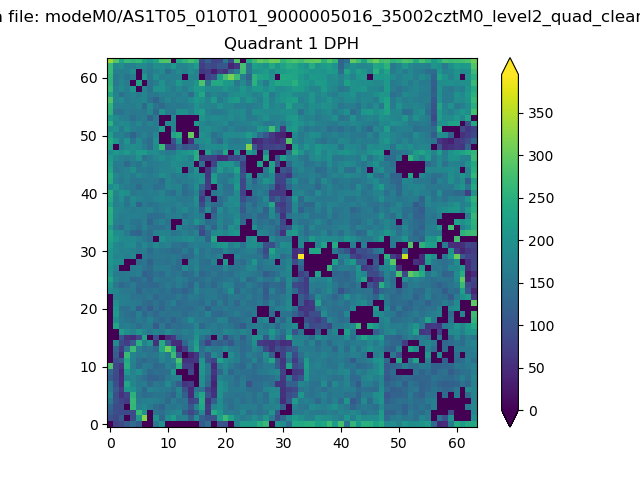 |
Quadrant B |
|---|---|---|---|
| Quadrant D | 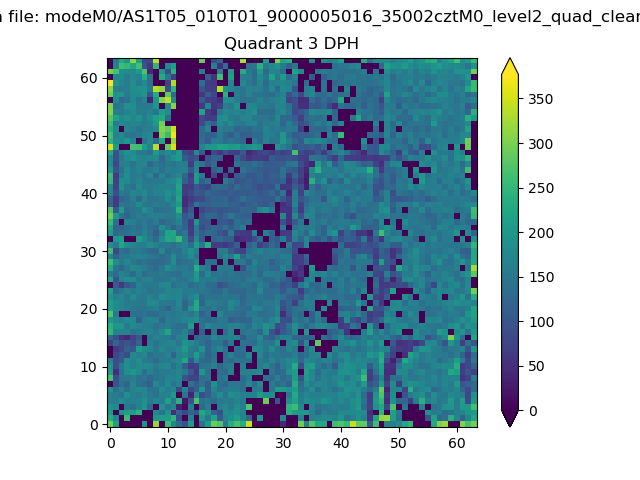 |
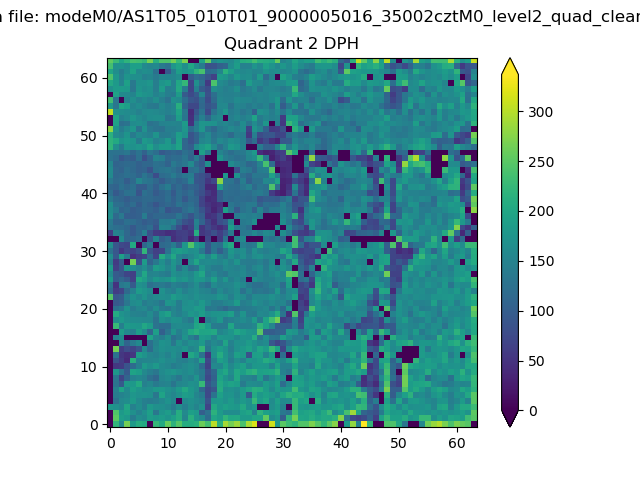 |
Quadrant C |
| Plot type | Count rate plots | Images |
|---|---|---|
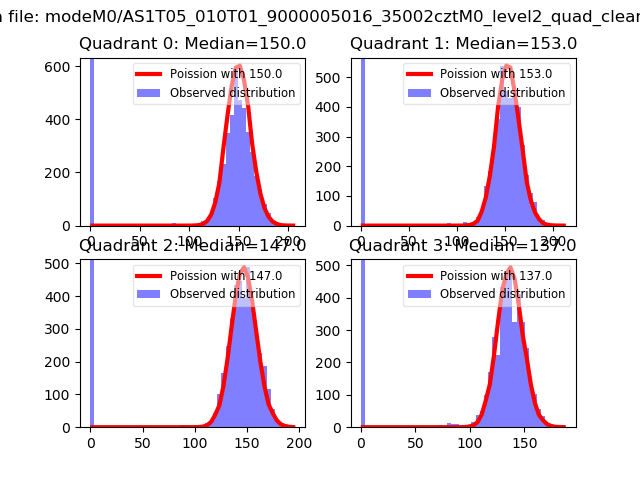
| Comparison with Poisson distribution Blue bars denote a histogram of data divided into 1 sec bins. Red curve is a Poisson curve with rate = median count rate of data. |
 |
 |
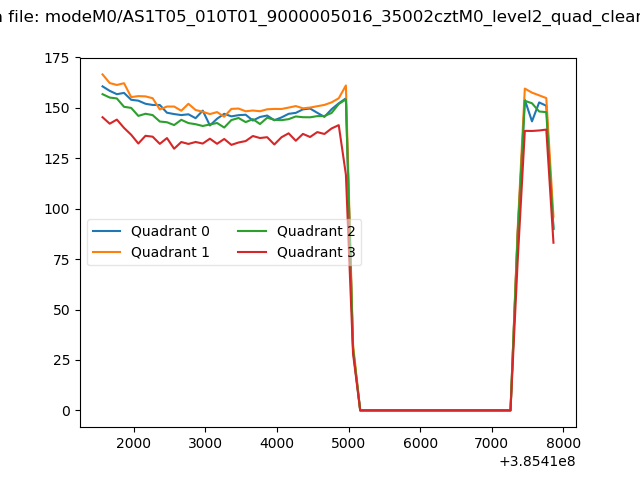
| Quadrant-wise count rates Data is divided into 100 sec bins |
 |
|
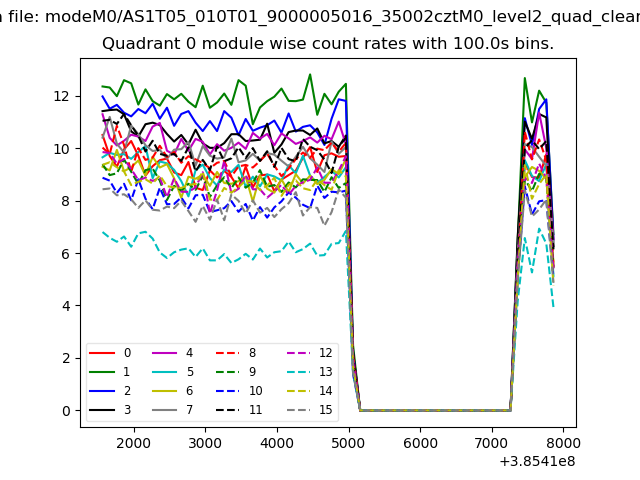
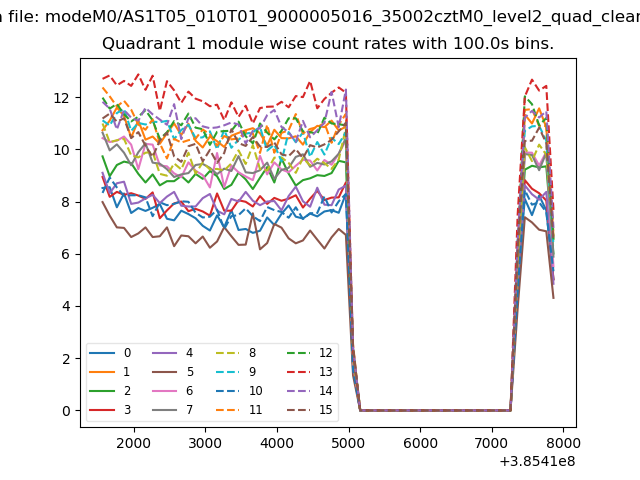
| Module-wise count rates for Quadrant A Data is divided into 100 sec bins |
 |
 |
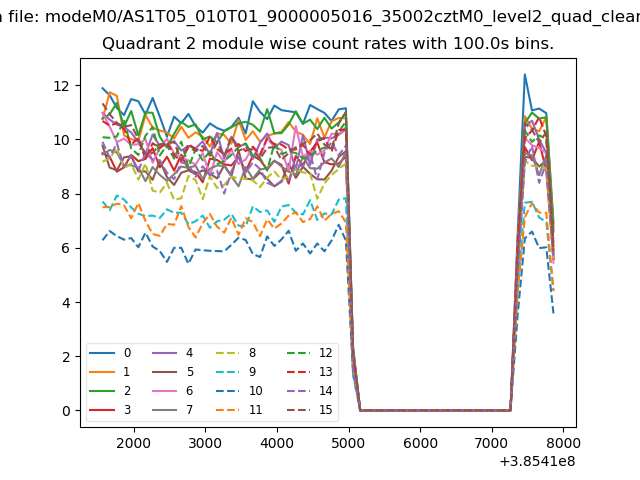
| Module-wise count rates for Quadrant B Data is divided into 100 sec bins |
 |
 |
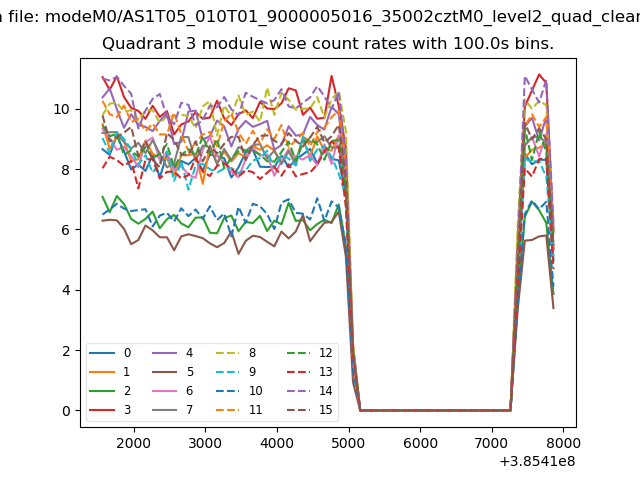
| Module-wise count rates for Quadrant C Data is divided into 100 sec bins |
 |
 |
| Module-wise count rates for Quadrant D Data is divided into 100 sec bins |
 |
 |
| Parameter | Plot |
|---|---|
| CZT HV Monitor |  |
| D_VDD | 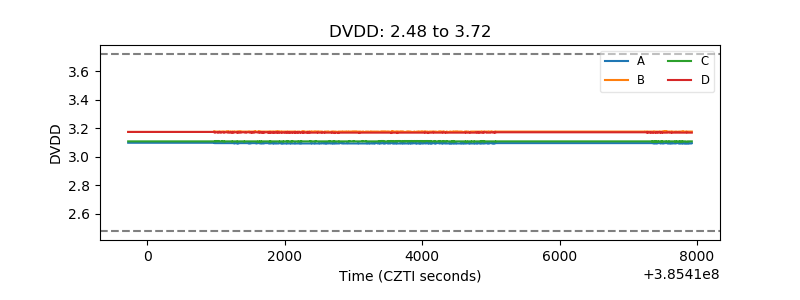 |
| Temperature 1 | 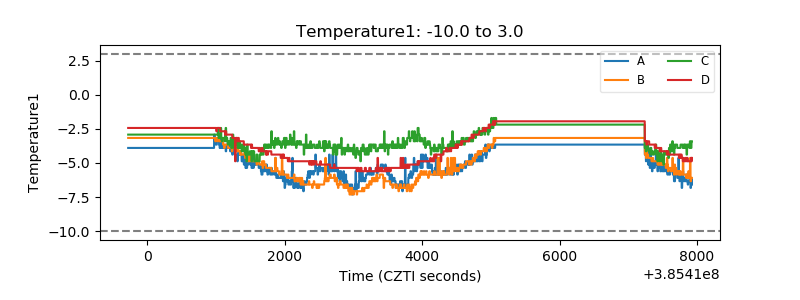 |
| Veto HV Monitor | 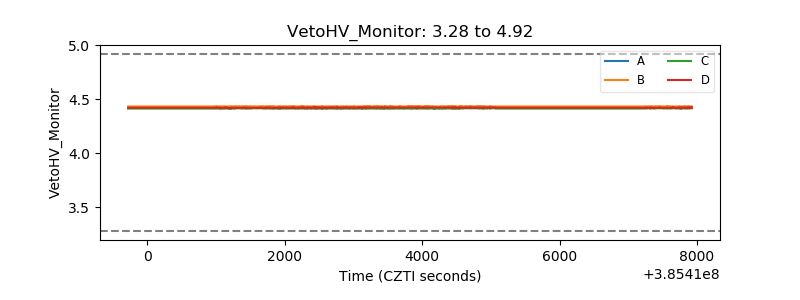 |
| Veto LLD | 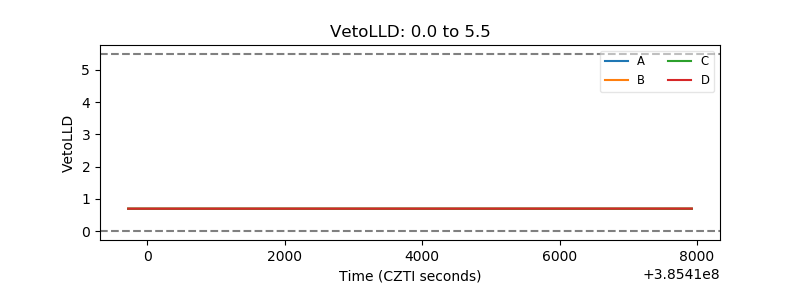 |
| Alpha Counter | 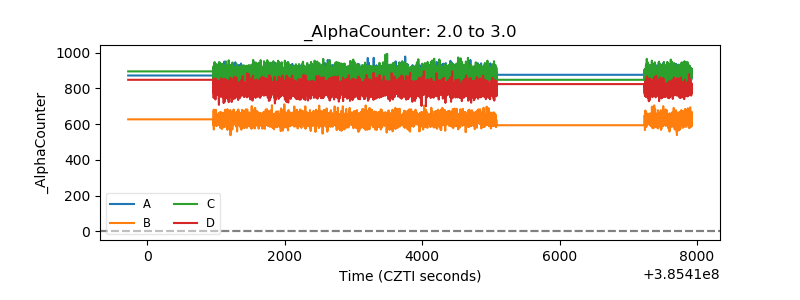 |
| _CPM_Rate | 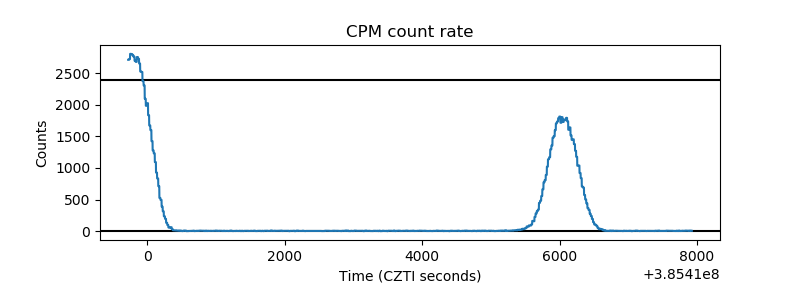 |
| CZT Counter | 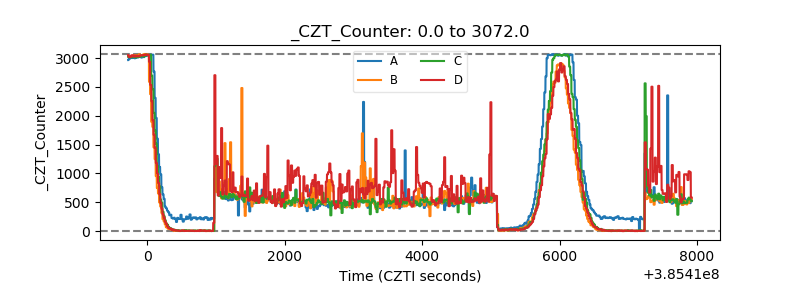 |
| +2.5 Volts monitor | 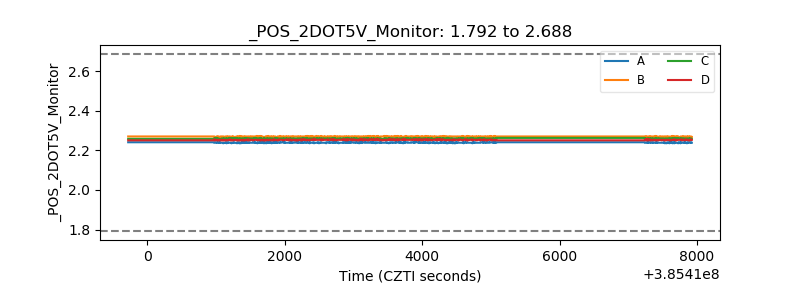 |
| +5 Volts monitor | 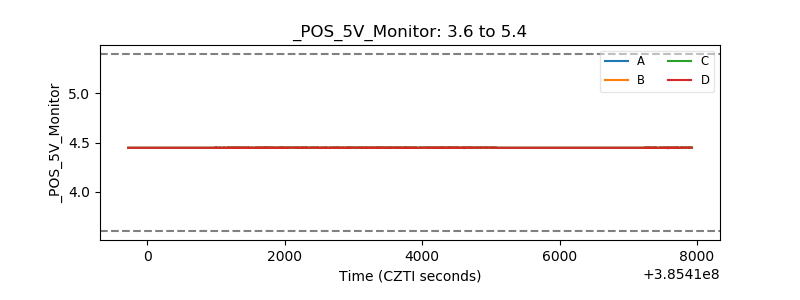 |
| _ROLL_ROT | 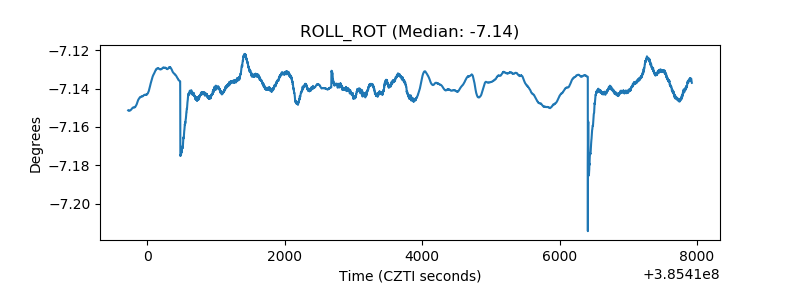 |
| _Roll_DEC | 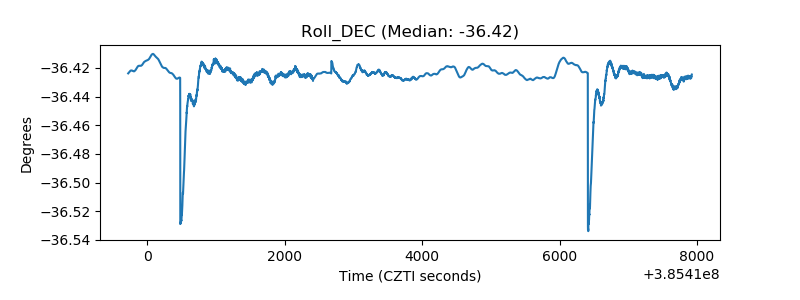 |
| _Roll_RA | 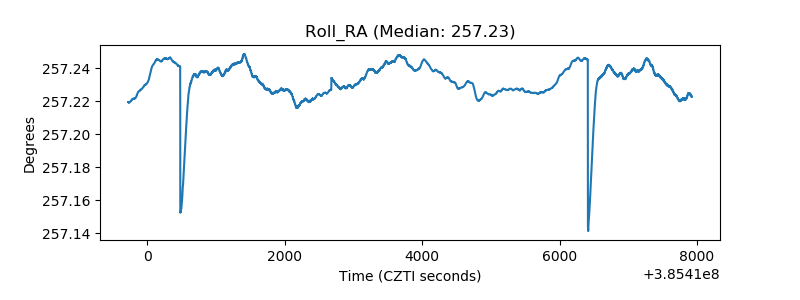 |
| Veto Counter | 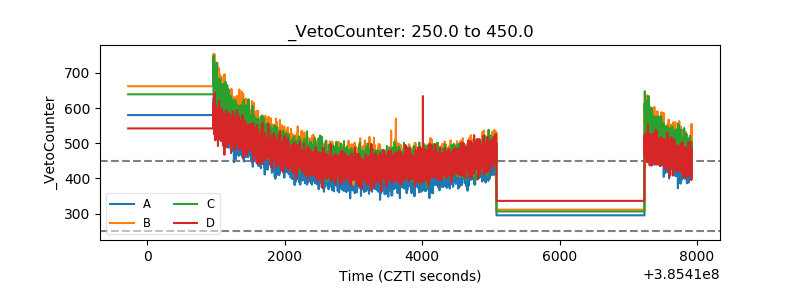 |