| Param | Original file | Final file |
|---|---|---|
| Filename | modeM0/AS1T05_010T01_9000005016_35001cztM0_level2.evt | modeM0/AS1T05_010T01_9000005016_35001cztM0_level2_quad_clean.evt |
| Size (bytes) | 429,186,240 | 76,282,560 |
| Size | 409.3 MB | 72.7 MB |
| Events in quadrant A | 2,687,080 | 502,457 |
| Events in quadrant B | 2,809,450 | 514,016 |
| Events in quadrant C | 2,890,842 | 490,463 |
| Events in quadrant D | 4,275,172 | 456,607 |
| Mode M0 | |||
|---|---|---|---|
| Quadrant | BADHDUFLAG | Total packets | Discarded packets |
| A | 0 | 10919 | 3 |
| B | 0 | 11268 | 2 |
| C | 0 | 11379 | 2 |
| D | 0 | 15990 | 2 |
| Mode M9 | |||
|---|---|---|---|
| Quadrant | BADHDUFLAG | Total packets | Discarded packets |
| A | 0 | 21 | 0 |
| B | 0 | 21 | 0 |
| C | 0 | 21 | 0 |
| D | 0 | 21 | 0 |
| Mode SS | |||
|---|---|---|---|
| Quadrant | BADHDUFLAG | Total packets | Discarded packets |
| A | 0 | 102 | 0 |
| B | 0 | 102 | 0 |
| C | 0 | 102 | 0 |
| D | 0 | 102 | 0 |
| Quadrant | Total seconds | Saturated seconds | Saturation percentage |
|---|---|---|---|
| A | 4935 | 26 | 0.526849% |
| B | 4935 | 38 | 0.770010% |
| C | 4935 | 73 | 1.479230% |
| D | 4936 | 321 | 6.503241% |
Noise dominated data is calculated using 1-second bins in cleaned event files. If a bin has >2000 counts, and if more than 50% of those come from <1% of pixels, then it is considered to be noise-dominated and hence unusable.
| Quadrant | # 1 sec bins | Bins with >0 counts | Bins with >2000 counts | High rate bins dominated by noise | Noise dominated (total time) | Noise dominated (detector-on time) | Marked lightcurve |
|---|---|---|---|---|---|---|---|
| A | 7029 | 4936 | 14 | 14 | 0.20% | 0.28% |  |
| B | 7029 | 4936 | 17 | 17 | 0.24% | 0.34% |  |
| C | 7029 | 4936 | 66 | 66 | 0.94% | 1.34% |  |
| D | 7030 | 4937 | 287 | 287 | 4.08% | 5.81% | 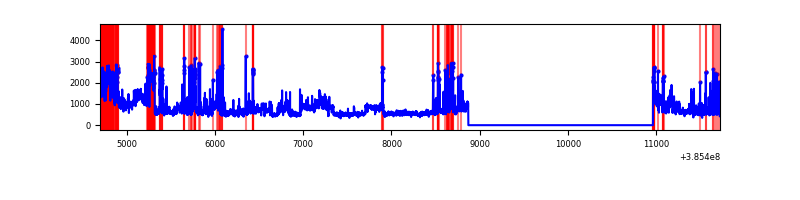 |
Top three noisy pixels from each quadrant. If the there are fewer than three noisy pixels in the level2.evt file, extra rows are filled as -1
| Pixel properties | Quadrant properties | ||||||
|---|---|---|---|---|---|---|---|
| Quadrant | DetID | PixID | Counts | Sigma | Mean | Median | Sigma |
| A | 10 | 83 | 76470 | 588.01 | 650 | 640 | 129.0 |
| A | 15 | 174 | 51311 | 392.92 | 650 | 640 | 129.0 |
| A | 15 | 169 | 30704 | 233.13 | 650 | 640 | 129.0 |
| B | 5 | 172 | 79832 | 660.06 | 650 | 636 | 120.0 |
| B | 0 | 190 | 75802 | 626.48 | 650 | 636 | 120.0 |
| B | 4 | 81 | 36940 | 302.58 | 650 | 636 | 120.0 |
| C | 15 | 214 | 206628 | 1434.96 | 623 | 628 | 143.6 |
| C | 0 | 10 | 195465 | 1357.2 | 623 | 628 | 143.6 |
| C | 14 | 67 | 53358 | 367.31 | 623 | 628 | 143.6 |
| D | 8 | 195 | 776966 | 5319.28 | 603 | 589 | 146.0 |
| D | 10 | 118 | 609706 | 4173.31 | 603 | 589 | 146.0 |
| D | 12 | 6 | 194004 | 1325.17 | 603 | 589 | 146.0 |
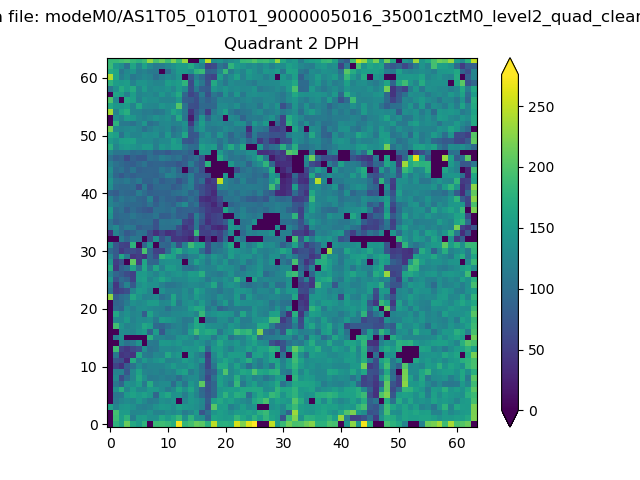
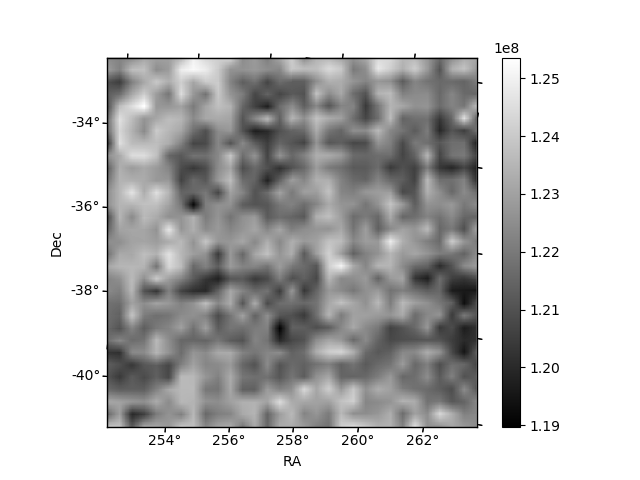
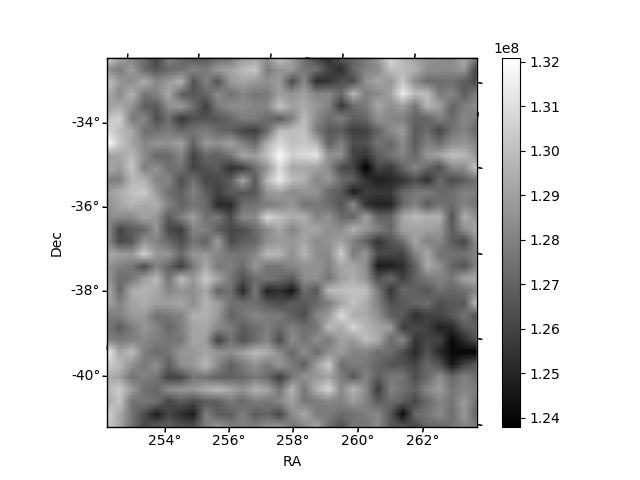
Histogram calculated using DETX and DETY for each event in the final _common_clean file
| Quadrant A | 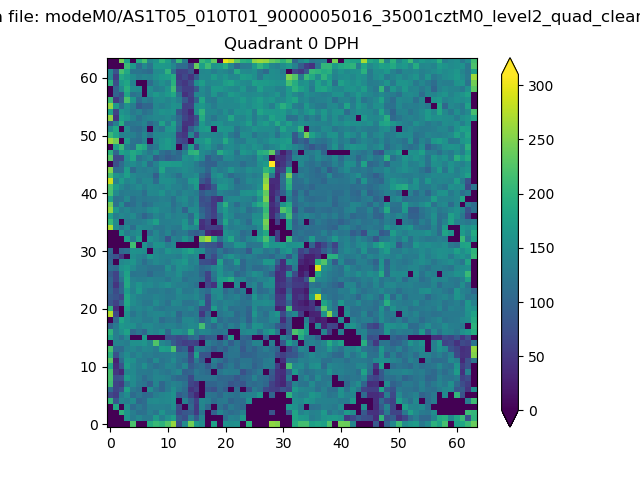 |
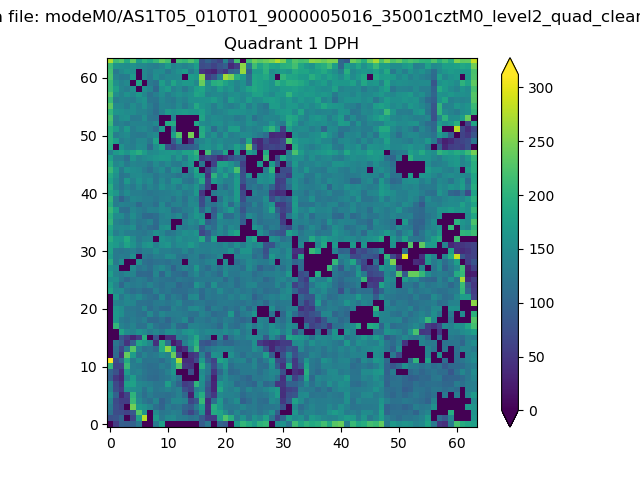 |
Quadrant B |
|---|---|---|---|
| Quadrant D | 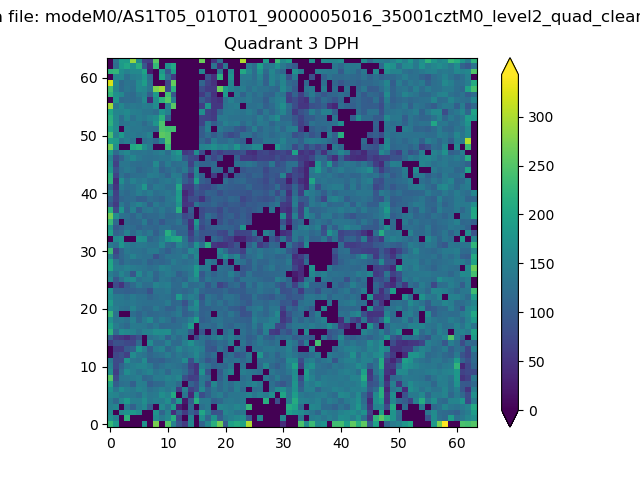 |
 |
Quadrant C |
| Plot type | Count rate plots | Images |
|---|---|---|
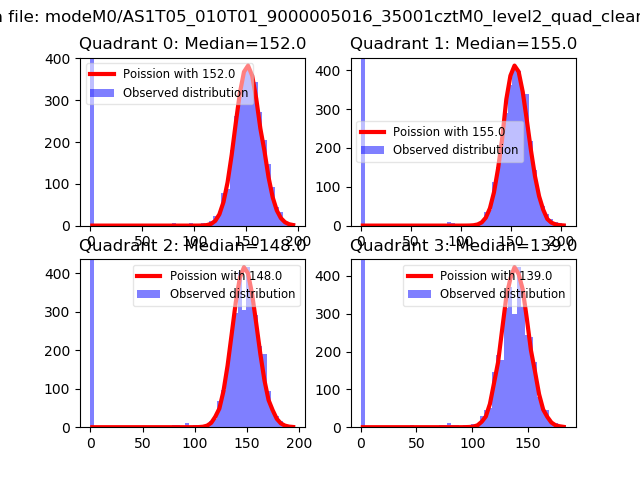
| Comparison with Poisson distribution Blue bars denote a histogram of data divided into 1 sec bins. Red curve is a Poisson curve with rate = median count rate of data. |
 |
 |
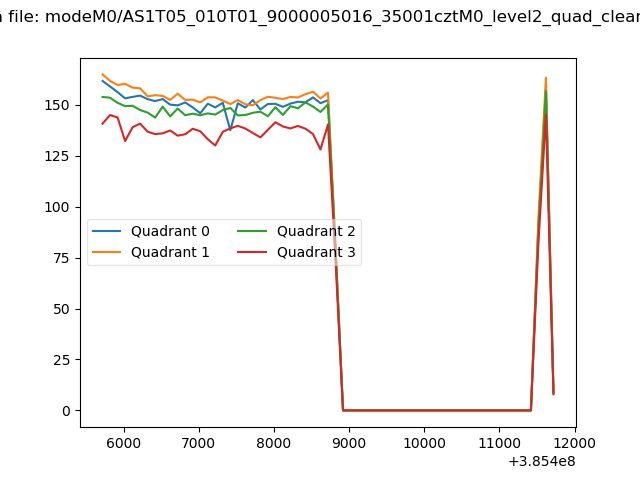
| Quadrant-wise count rates Data is divided into 100 sec bins |
 |
|
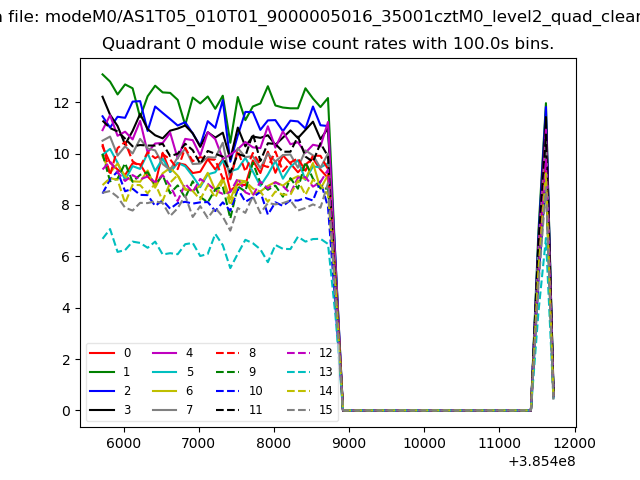
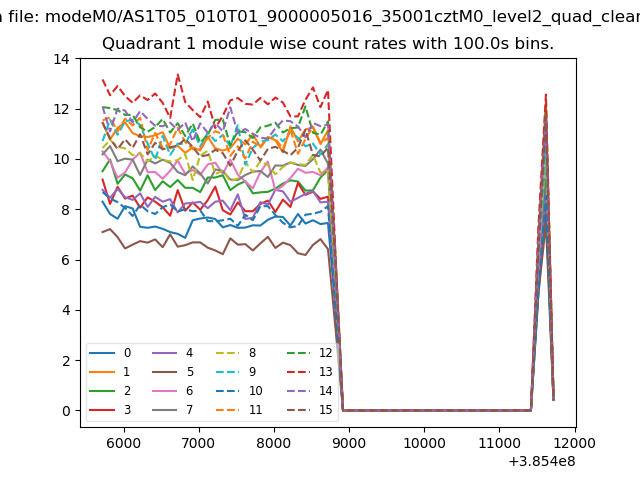
| Module-wise count rates for Quadrant A Data is divided into 100 sec bins |
 |
 |
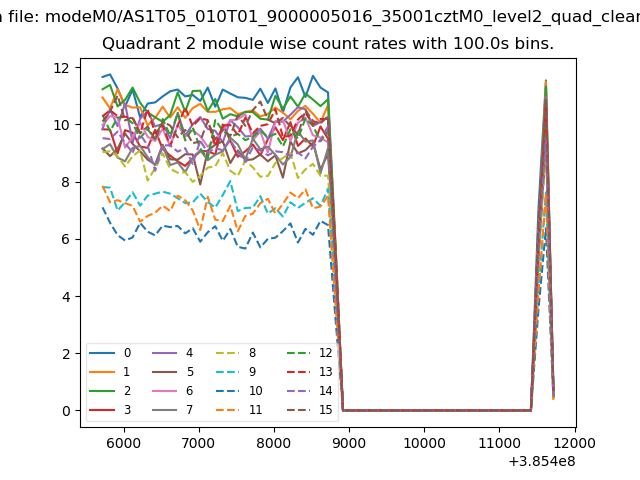
| Module-wise count rates for Quadrant B Data is divided into 100 sec bins |
 |
 |
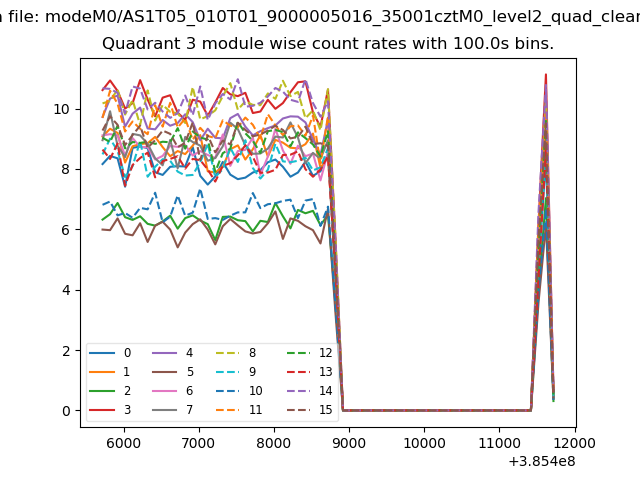
| Module-wise count rates for Quadrant C Data is divided into 100 sec bins |
 |
 |
| Module-wise count rates for Quadrant D Data is divided into 100 sec bins |
 |
 |
| Parameter | Plot |
|---|---|
| CZT HV Monitor |  |
| D_VDD | 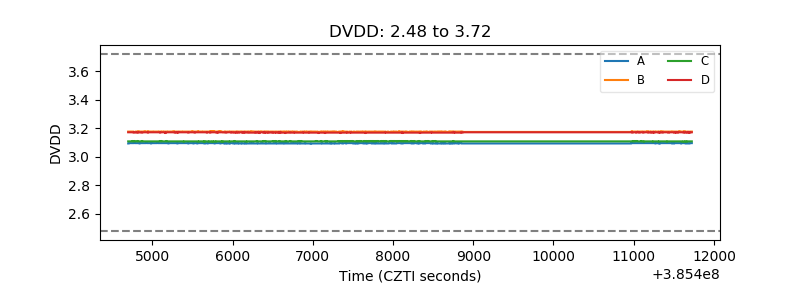 |
| Temperature 1 | 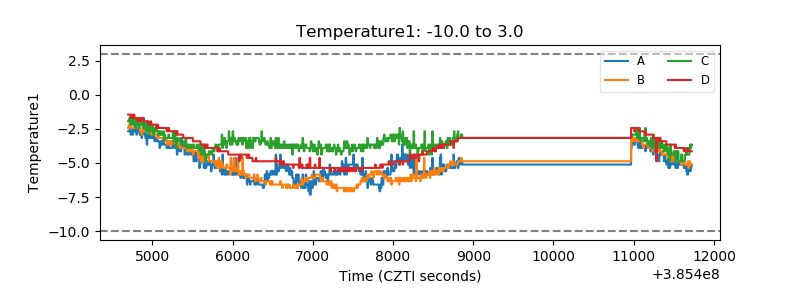 |
| Veto HV Monitor | 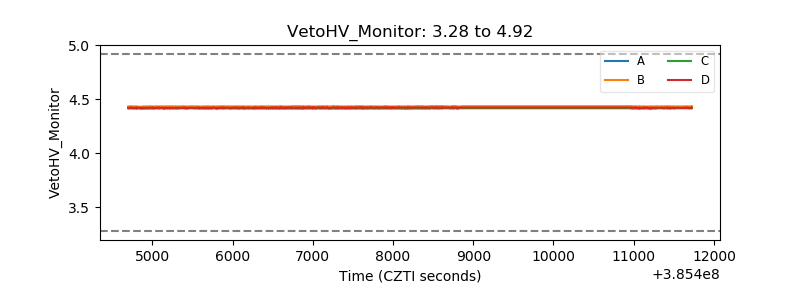 |
| Veto LLD | 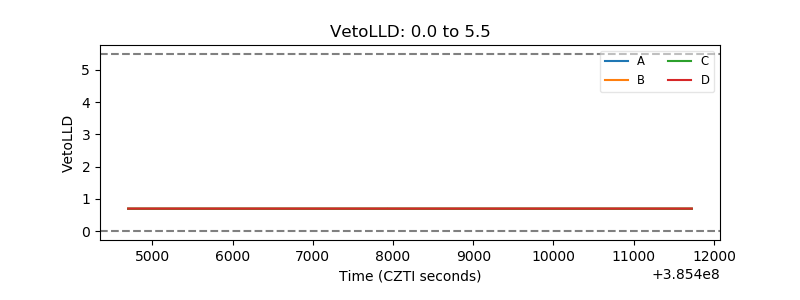 |
| Alpha Counter | 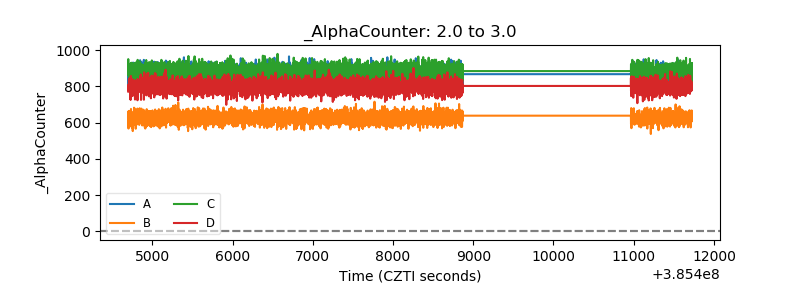 |
| _CPM_Rate | 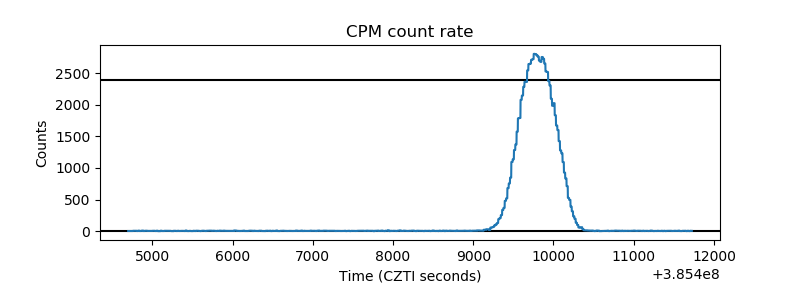 |
| CZT Counter | 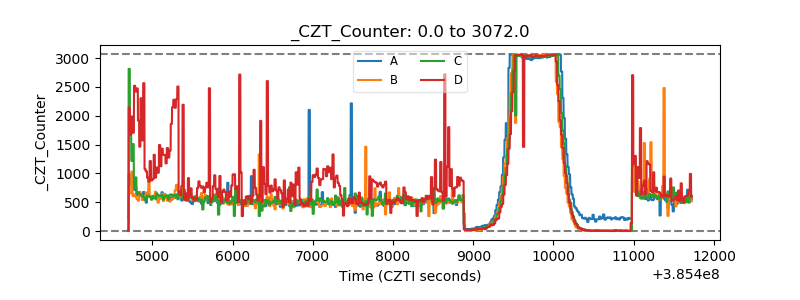 |
| +2.5 Volts monitor | 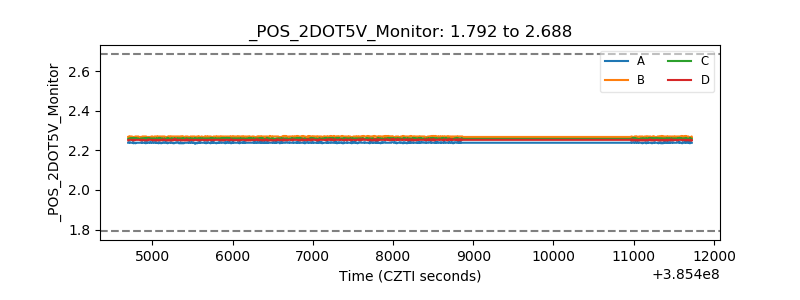 |
| +5 Volts monitor | 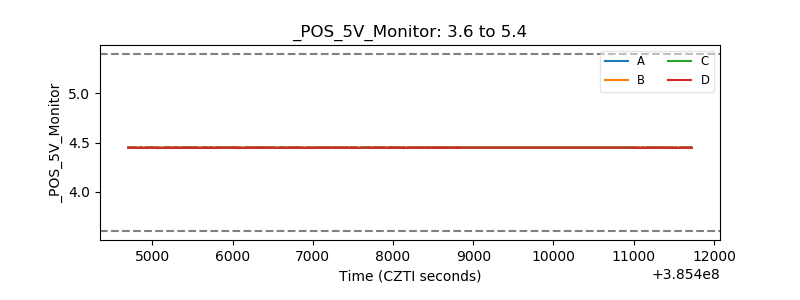 |
| _ROLL_ROT | 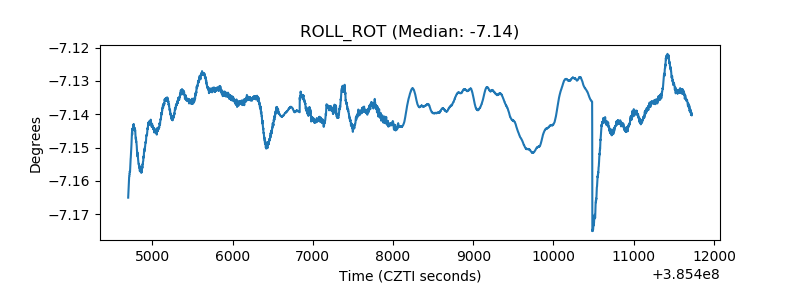 |
| _Roll_DEC | 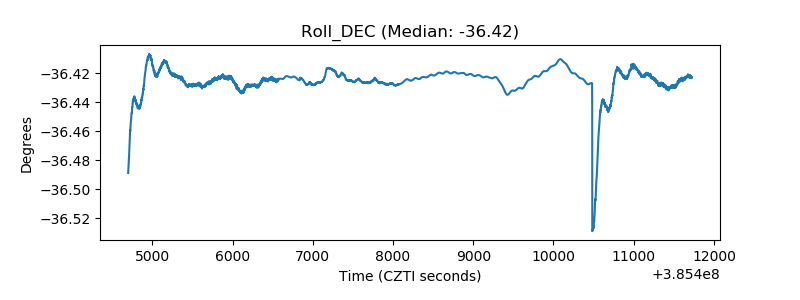 |
| _Roll_RA | 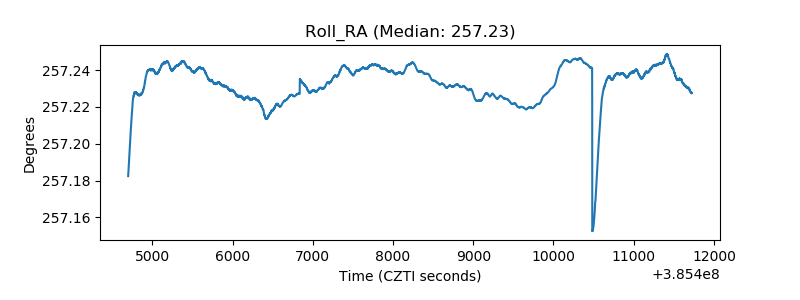 |
| Veto Counter | 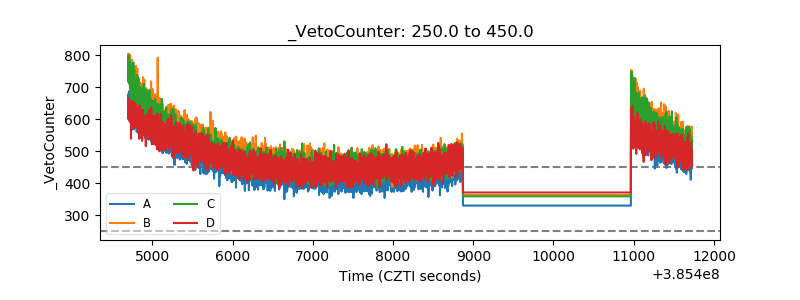 |