| Param | Original file | Final file |
|---|---|---|
| Filename | modeM0/AS1T05_010T01_9000005016_35000cztM0_level2.evt | modeM0/AS1T05_010T01_9000005016_35000cztM0_level2_quad_clean.evt |
| Size (bytes) | 488,088,000 | 64,546,560 |
| Size | 465.5 MB | 61.6 MB |
| Events in quadrant A | 2,749,504 | 410,093 |
| Events in quadrant B | 2,964,938 | 414,769 |
| Events in quadrant C | 3,187,545 | 398,274 |
| Events in quadrant D | 5,529,889 | 369,535 |
| Mode M0 | |||
|---|---|---|---|
| Quadrant | BADHDUFLAG | Total packets | Discarded packets |
| A | 0 | 11359 | 3 |
| B | 0 | 12046 | 2 |
| C | 0 | 12475 | 2 |
| D | 0 | 19975 | 2 |
| Mode M9 | |||
|---|---|---|---|
| Quadrant | BADHDUFLAG | Total packets | Discarded packets |
| A | 0 | 30 | 0 |
| B | 0 | 30 | 0 |
| C | 0 | 30 | 0 |
| D | 0 | 31 | 0 |
| Mode SS | |||
|---|---|---|---|
| Quadrant | BADHDUFLAG | Total packets | Discarded packets |
| A | 0 | 104 | 0 |
| B | 0 | 104 | 0 |
| C | 0 | 104 | 0 |
| D | 0 | 104 | 0 |
| Quadrant | Total seconds | Saturated seconds | Saturation percentage |
|---|---|---|---|
| A | 5166 | 12 | 0.232288% |
| B | 5166 | 39 | 0.754936% |
| C | 5166 | 93 | 1.800232% |
| D | 5166 | 807 | 15.621370% |
Noise dominated data is calculated using 1-second bins in cleaned event files. If a bin has >2000 counts, and if more than 50% of those come from <1% of pixels, then it is considered to be noise-dominated and hence unusable.
| Quadrant | # 1 sec bins | Bins with >0 counts | Bins with >2000 counts | High rate bins dominated by noise | Noise dominated (total time) | Noise dominated (detector-on time) | Marked lightcurve |
|---|---|---|---|---|---|---|---|
| A | 7169 | 5167 | 3 | 3 | 0.04% | 0.06% | 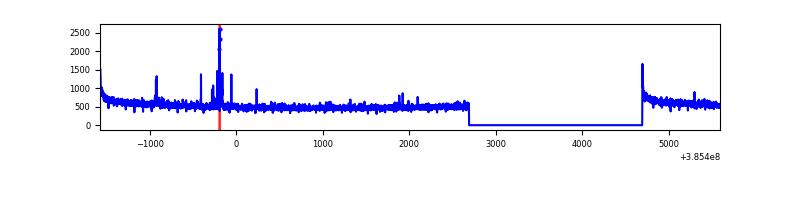 |
| B | 7169 | 5167 | 18 | 18 | 0.25% | 0.35% | 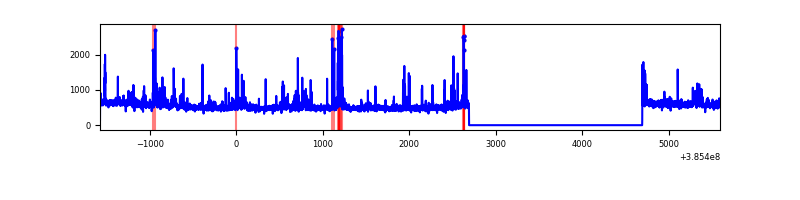 |
| C | 7169 | 5167 | 80 | 80 | 1.12% | 1.55% | 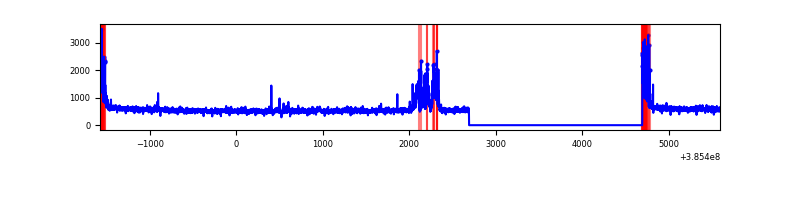 |
| D | 7169 | 5167 | 717 | 717 | 10.00% | 13.88% | 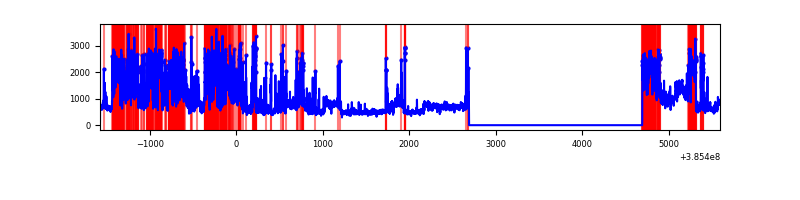 |
Top three noisy pixels from each quadrant. If the there are fewer than three noisy pixels in the level2.evt file, extra rows are filled as -1
| Pixel properties | Quadrant properties | ||||||
|---|---|---|---|---|---|---|---|
| Quadrant | DetID | PixID | Counts | Sigma | Mean | Median | Sigma |
| A | 10 | 83 | 78493 | 579.25 | 677 | 666 | 134.4 |
| A | 15 | 223 | 42204 | 309.16 | 677 | 666 | 134.4 |
| A | 13 | 254 | 8780 | 60.39 | 677 | 666 | 134.4 |
| B | 5 | 172 | 132600 | 1066.43 | 674 | 660 | 123.7 |
| B | 4 | 232 | 65102 | 520.86 | 674 | 660 | 123.7 |
| B | 4 | 81 | 33549 | 265.83 | 674 | 660 | 123.7 |
| C | 15 | 214 | 217114 | 1461.93 | 645 | 652 | 148.1 |
| C | 0 | 10 | 206816 | 1392.38 | 645 | 652 | 148.1 |
| C | 14 | 128 | 191056 | 1285.94 | 645 | 652 | 148.1 |
| D | 10 | 118 | 1929852 | 13312.27 | 599 | 584 | 144.9 |
| D | 8 | 195 | 775445 | 5346.67 | 599 | 584 | 144.9 |
| D | 12 | 6 | 128330 | 881.47 | 599 | 584 | 144.9 |
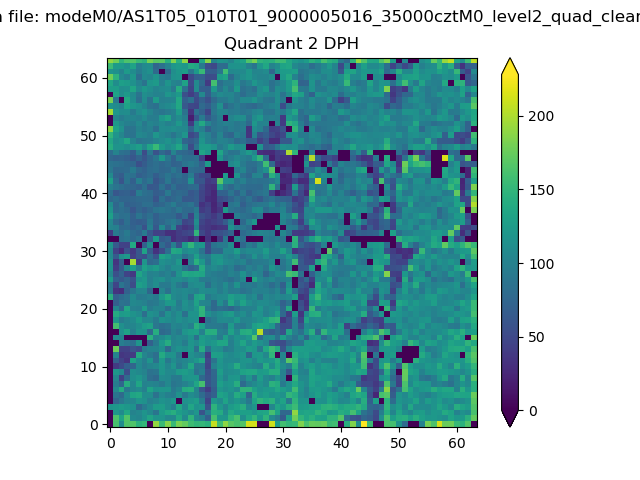
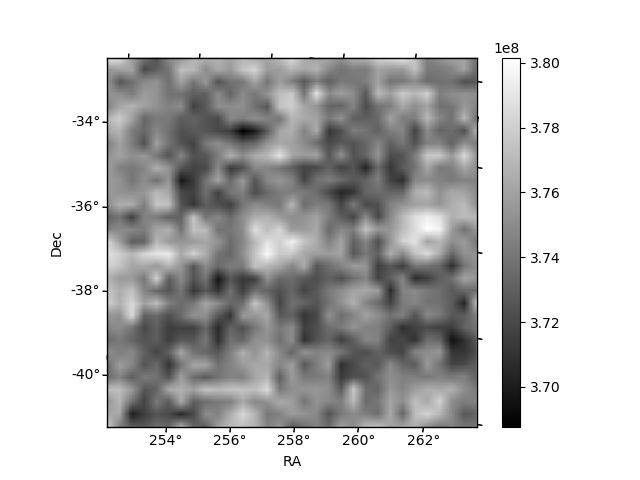
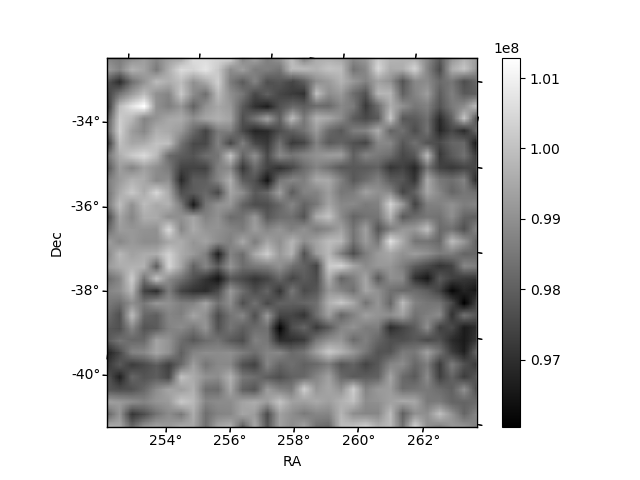
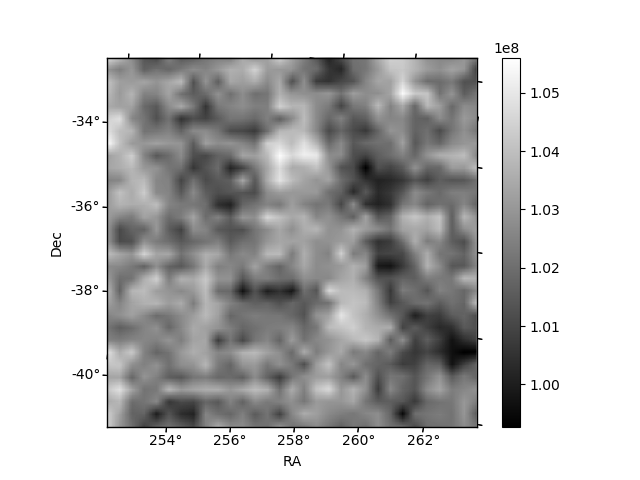
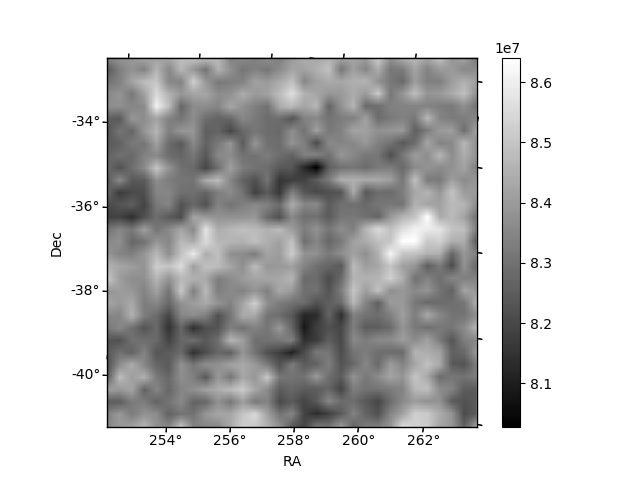
Histogram calculated using DETX and DETY for each event in the final _common_clean file
| Quadrant A | 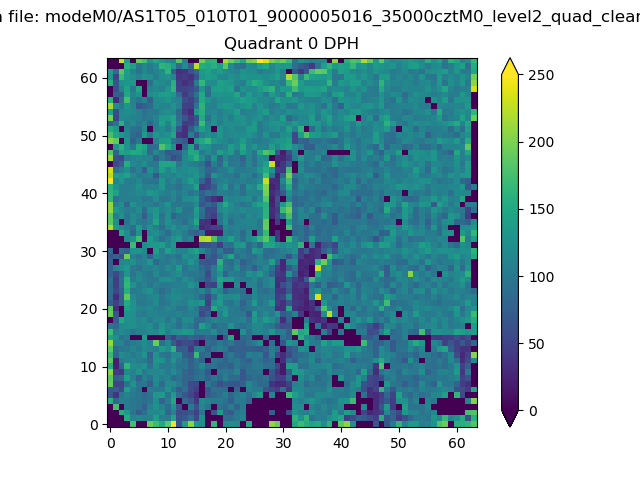 |
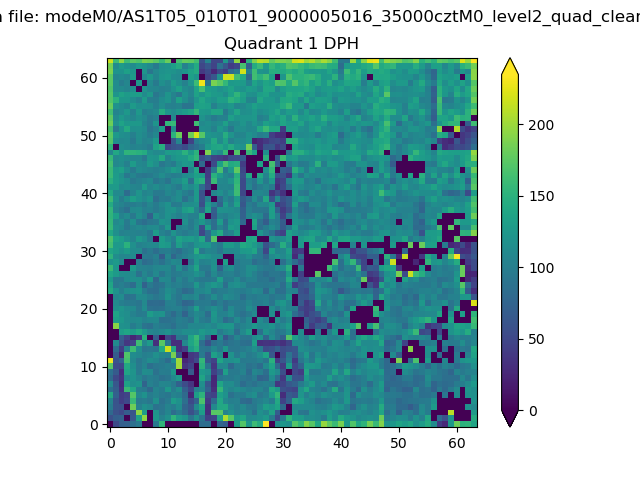 |
Quadrant B |
|---|---|---|---|
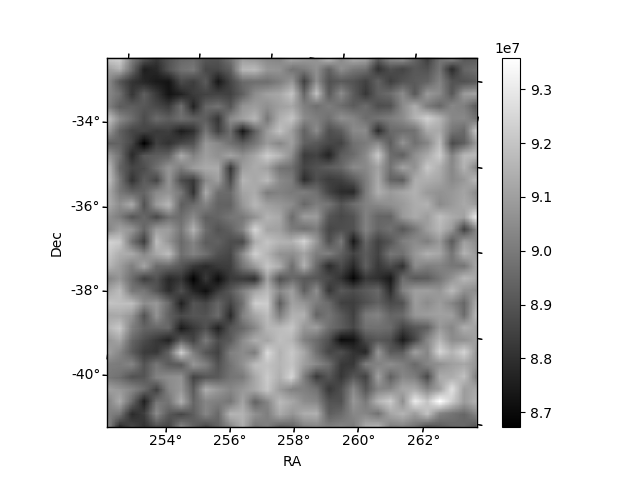
| Quadrant D | 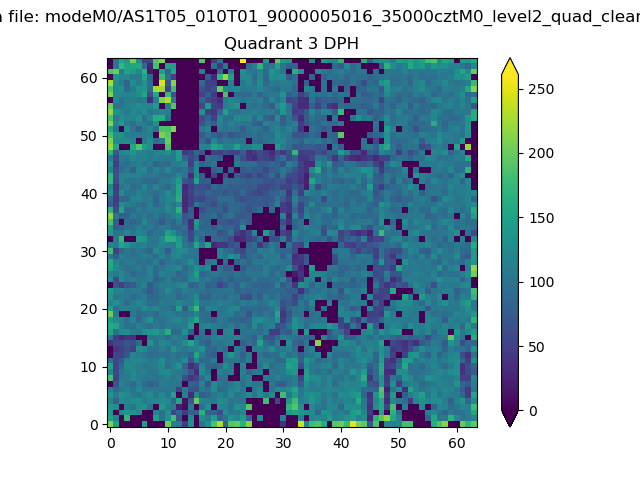 |
 |
Quadrant C |
| Plot type | Count rate plots | Images |
|---|---|---|
| Comparison with Poisson distribution Blue bars denote a histogram of data divided into 1 sec bins. Red curve is a Poisson curve with rate = median count rate of data. |
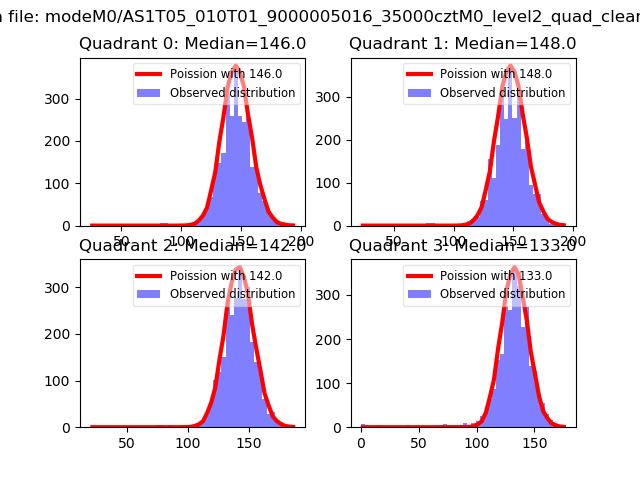 |
 |
| Quadrant-wise count rates Data is divided into 100 sec bins |
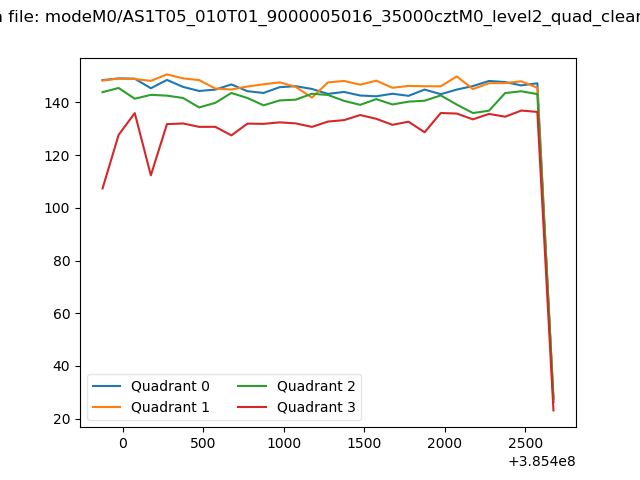 |
|
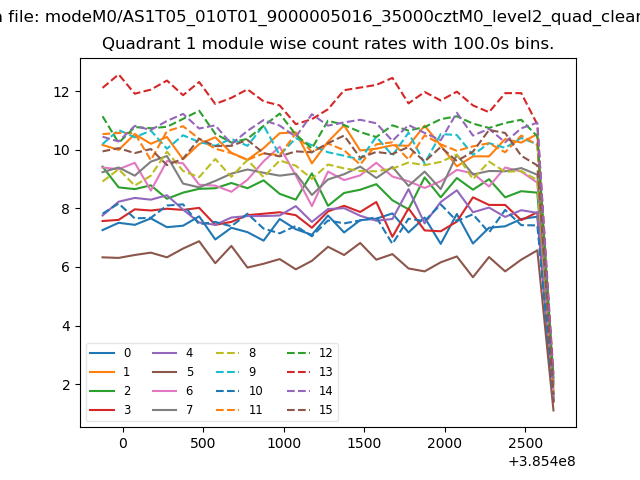
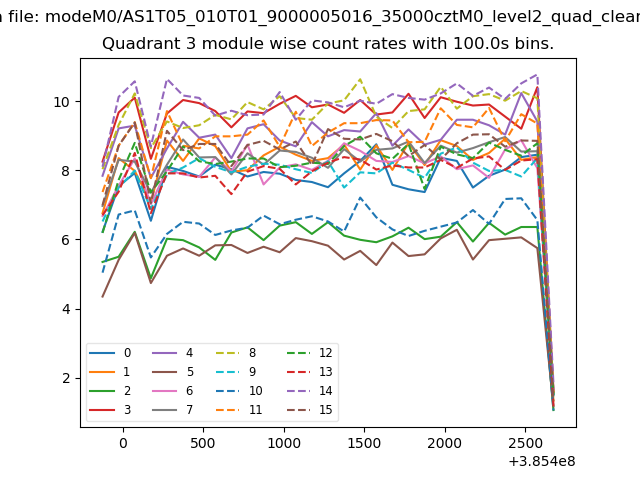
| Module-wise count rates for Quadrant A Data is divided into 100 sec bins |
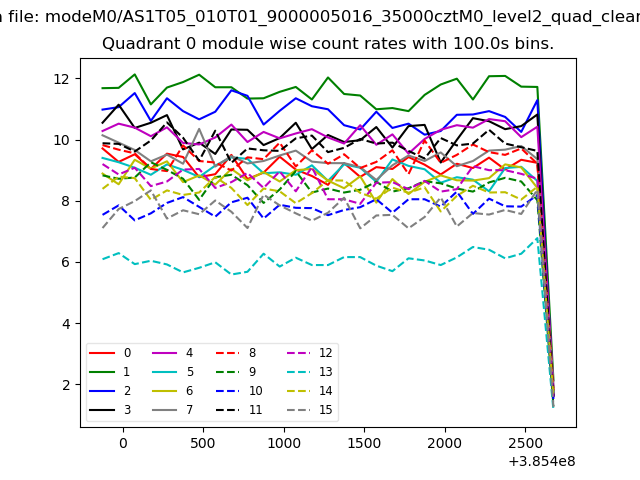 |
 |
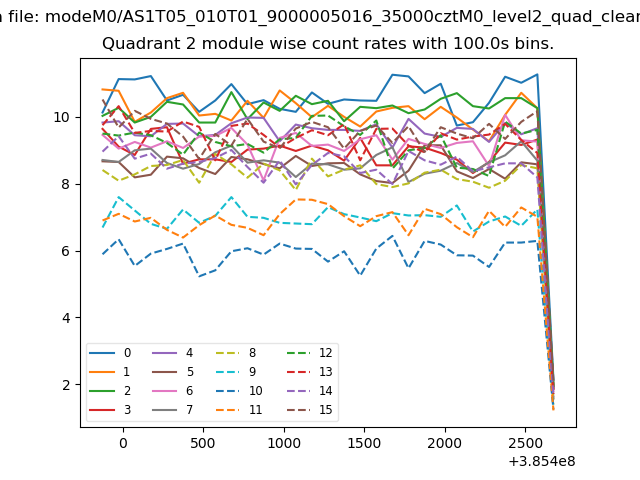
| Module-wise count rates for Quadrant B Data is divided into 100 sec bins |
 |
 |
| Module-wise count rates for Quadrant C Data is divided into 100 sec bins |
 |
 |
| Module-wise count rates for Quadrant D Data is divided into 100 sec bins |
 |
 |
| Parameter | Plot |
|---|---|
| CZT HV Monitor |  |
| D_VDD | 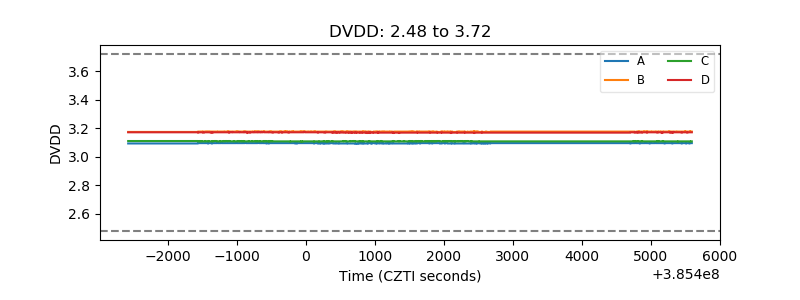 |
| Temperature 1 | 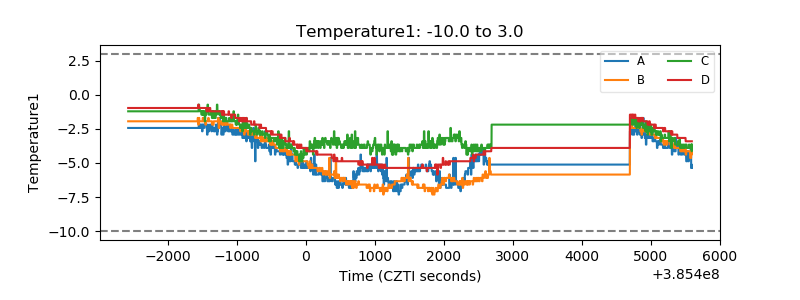 |
| Veto HV Monitor | 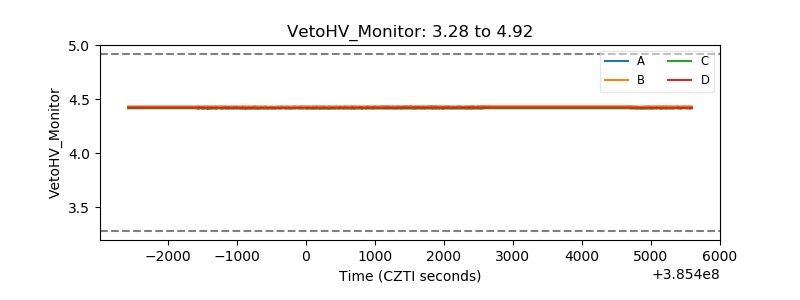 |
| Veto LLD | 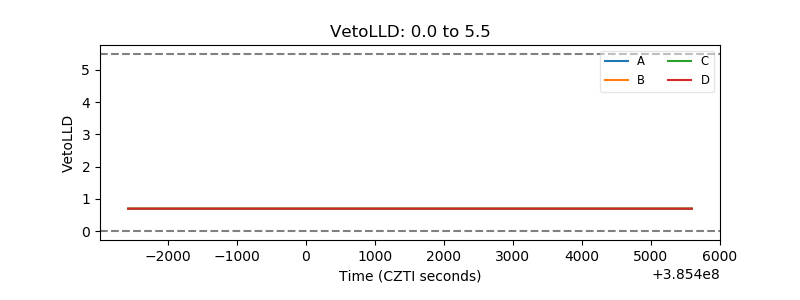 |
| Alpha Counter | 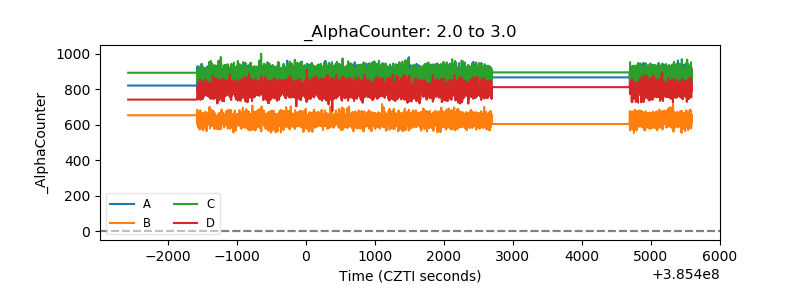 |
| _CPM_Rate | 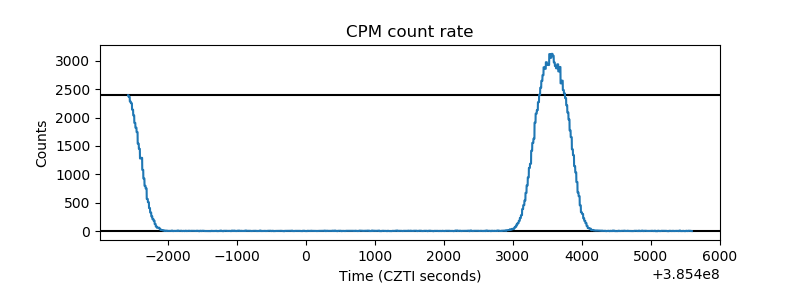 |
| CZT Counter | 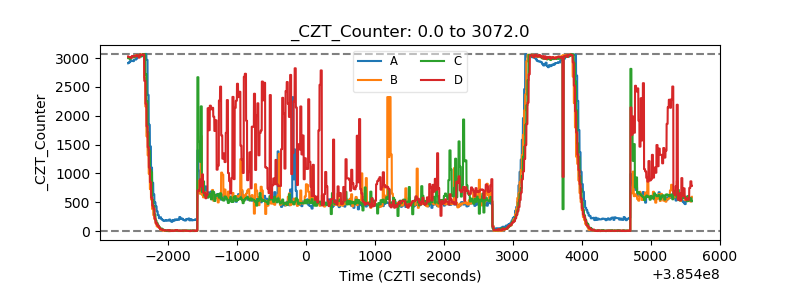 |
| +2.5 Volts monitor | 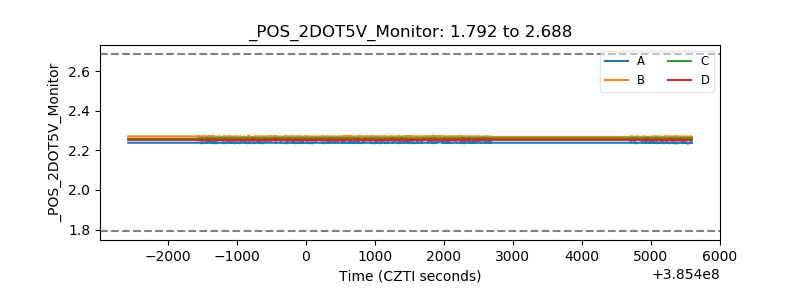 |
| +5 Volts monitor | 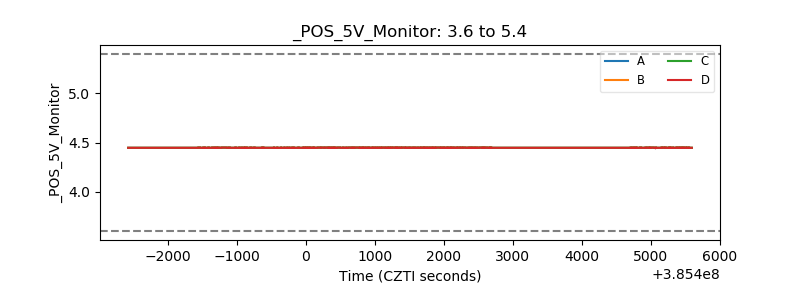 |
| _ROLL_ROT | 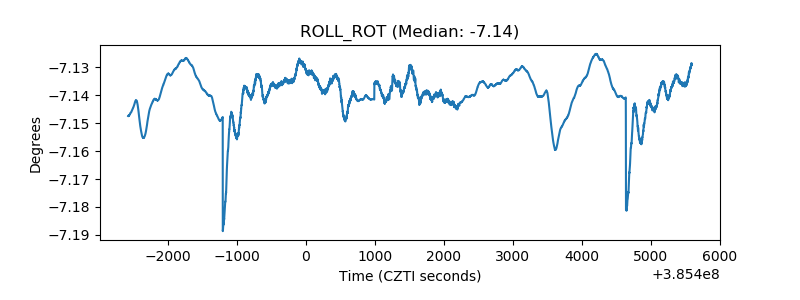 |
| _Roll_DEC | 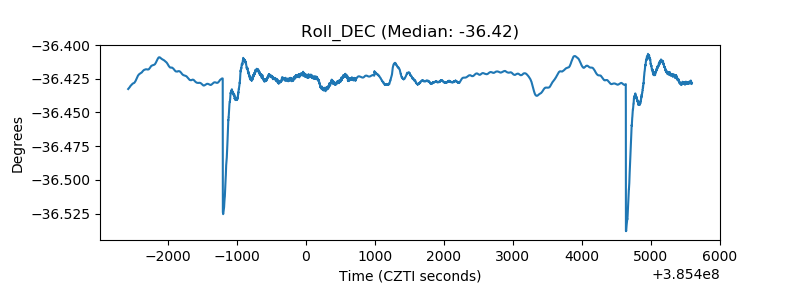 |
| _Roll_RA | 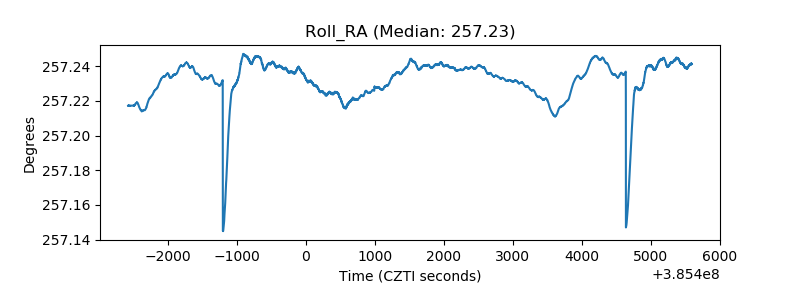 |
| Veto Counter | 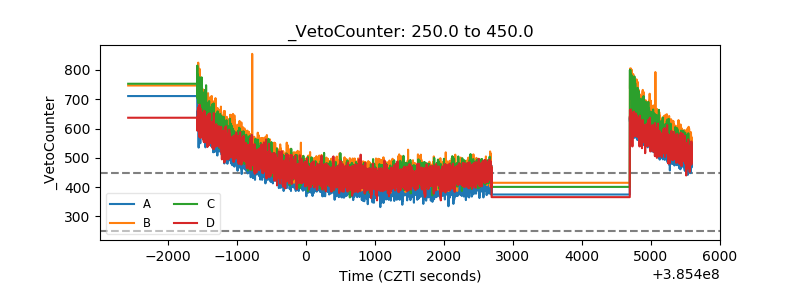 |