| Param | Original file | Final file |
|---|---|---|
| Filename | modeM0/AS1T05_010T01_9000005016cztM0_level2_bc.evt | modeM0/AS1T05_010T01_9000005016cztM0_level2_quad_clean.evt |
| Size (bytes) | 7,240,173,120 | 2,275,240,320 |
| Size | 6.7 GB | 2.1 GB |
| Events in quadrant A | 37,615,292 | 14,745,904 |
| Events in quadrant B | 44,769,851 | 14,938,990 |
| Events in quadrant C | 43,809,067 | 14,546,442 |
| Events in quadrant D | 82,012,092 | 13,532,155 |
| Mode M0 | |||
|---|---|---|---|
| Quadrant | BADHDUFLAG | Total packets | Discarded packets |
| A | 0 | 339495 | 0 |
| B | 0 | 373040 | 0 |
| C | 0 | 346199 | 0 |
| D | 0 | 496561 | 0 |
| Mode M9 | |||
|---|---|---|---|
| Quadrant | BADHDUFLAG | Total packets | Discarded packets |
| A | 0 | 640 | 0 |
| B | 0 | 640 | 0 |
| C | 0 | 640 | 0 |
| D | 0 | 641 | 0 |
| Mode SS | |||
|---|---|---|---|
| Quadrant | BADHDUFLAG | Total packets | Discarded packets |
| A | 0 | 3324 | 0 |
| B | 0 | 3324 | 0 |
| C | 0 | 3324 | 0 |
| D | 0 | 3324 | 0 |
| Quadrant | Total seconds | Saturated seconds | Saturation percentage |
|---|---|---|---|
| A | 162889 | 420 | 0.257844% |
| B | 162889 | 2824 | 1.733696% |
| C | 162889 | 1077 | 0.661186% |
| D | 162889 | 6546 | 4.018688% |
Noise dominated data is calculated using 1-second bins in cleaned event files. If a bin has >2000 counts, and if more than 50% of those come from <1% of pixels, then it is considered to be noise-dominated and hence unusable.
| Quadrant | # 1 sec bins | Bins with >0 counts | Bins with >2000 counts | High rate bins dominated by noise | Noise dominated (total time) | Noise dominated (detector-on time) | Marked lightcurve |
|---|---|---|---|---|---|---|---|
| A | 231198 | 162922 | 41 | 41 | 0.02% | 0.03% | 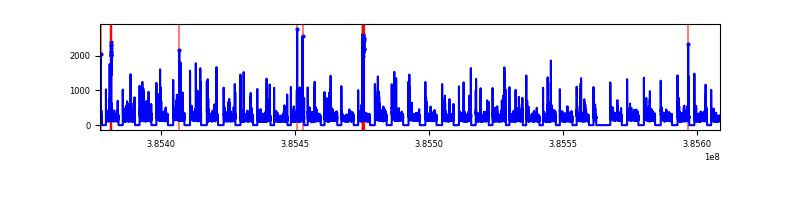 |
| B | 231199 | 162883 | 101 | 101 | 0.04% | 0.06% | 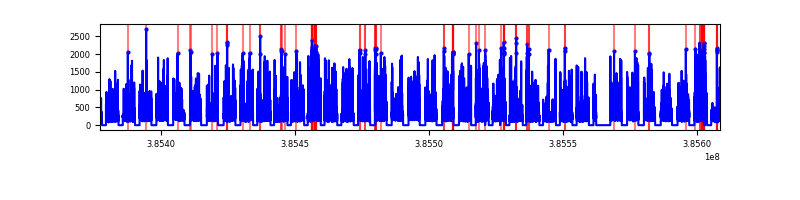 |
| C | 231199 | 162892 | 174 | 174 | 0.08% | 0.11% | 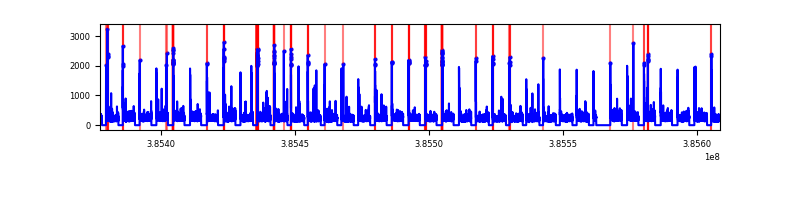 |
| D | 231198 | 162885 | 516 | 516 | 0.22% | 0.32% | 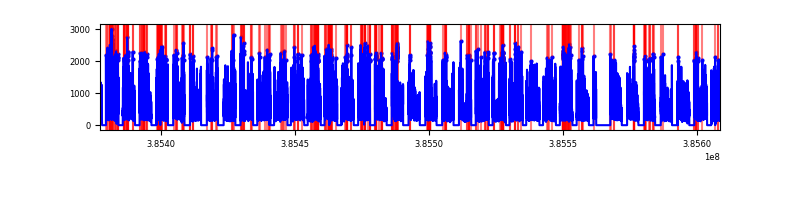 |
Top three noisy pixels from each quadrant. If the there are fewer than three noisy pixels in the level2.evt file, extra rows are filled as -1
| Pixel properties | Quadrant properties | ||||||
|---|---|---|---|---|---|---|---|
| Quadrant | DetID | PixID | Counts | Sigma | Mean | Median | Sigma |
| A | 10 | 83 | 1647792 | 848.64 | 8851 | 8767 | 1931.4 |
| A | 15 | 223 | 662673 | 338.57 | 8851 | 8767 | 1931.4 |
| A | 13 | 6 | 295514 | 148.47 | 8851 | 8767 | 1931.4 |
| B | 5 | 172 | 3305509 | 1899.43 | 8875 | 8716 | 1735.7 |
| B | 5 | 31 | 1741091 | 998.1 | 8875 | 8716 | 1735.7 |
| B | 4 | 232 | 1388281 | 794.83 | 8875 | 8716 | 1735.7 |
| C | 15 | 214 | 6411952 | 3252.88 | 8619 | 8611 | 1968.5 |
| C | 0 | 10 | 2331132 | 1179.83 | 8619 | 8611 | 1968.5 |
| C | 14 | 67 | 689284 | 345.78 | 8619 | 8611 | 1968.5 |
| D | 8 | 195 | 29160702 | 14317.24 | 8502 | 8303 | 2036.2 |
| D | 10 | 118 | 3716940 | 1821.37 | 8502 | 8303 | 2036.2 |
| D | 13 | 249 | 2405211 | 1177.16 | 8502 | 8303 | 2036.2 |
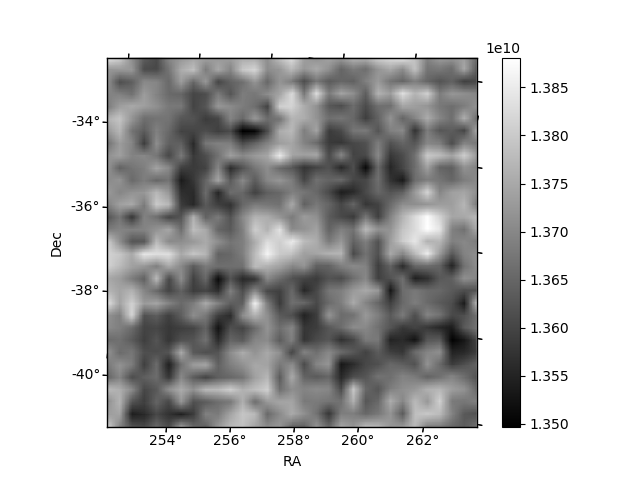
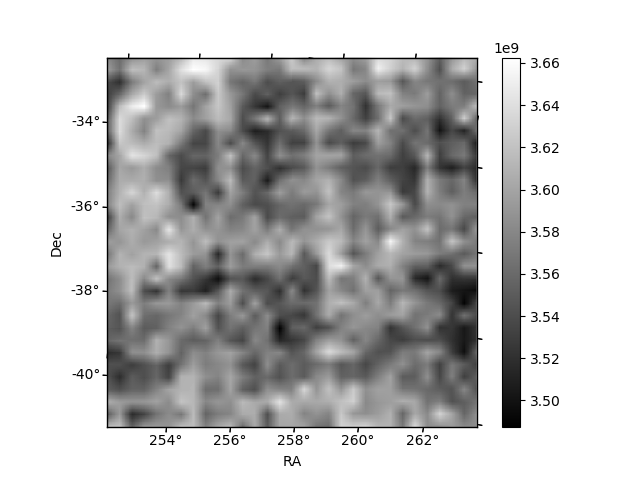
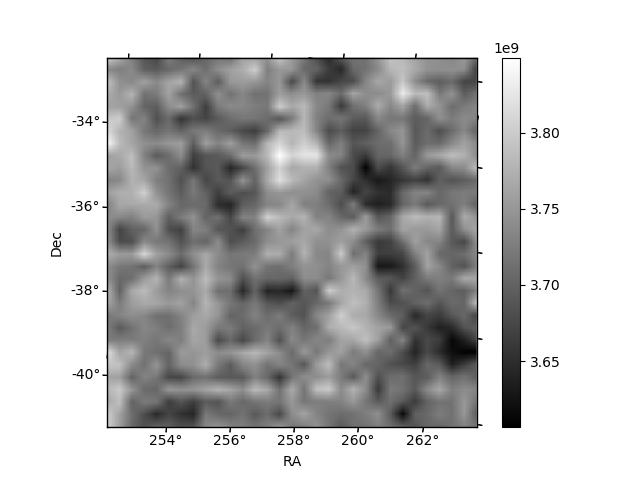
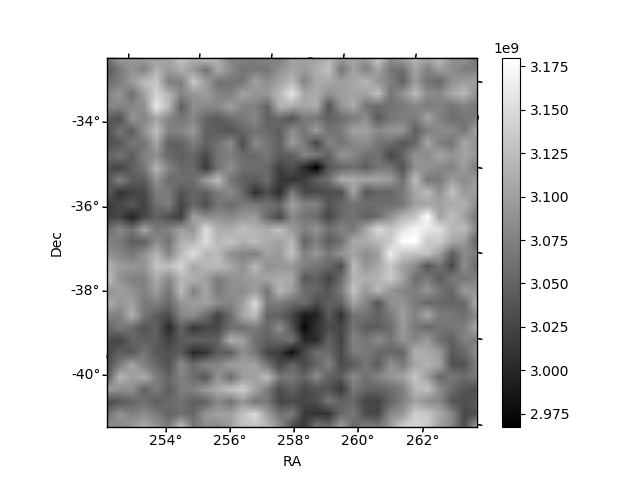
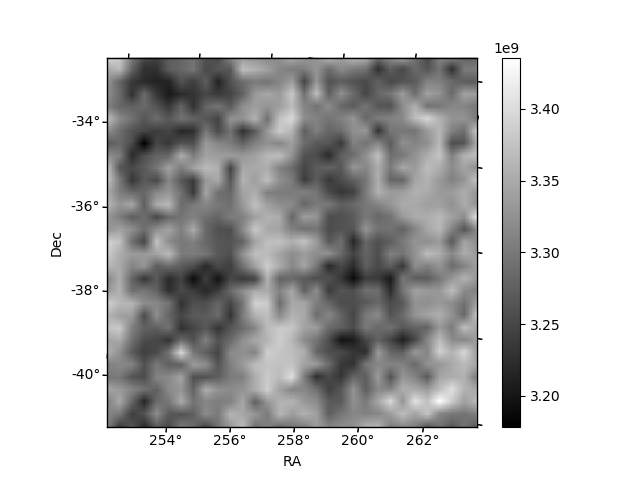
Histogram calculated using DETX and DETY for each event in the final _common_clean file
| Quadrant A | 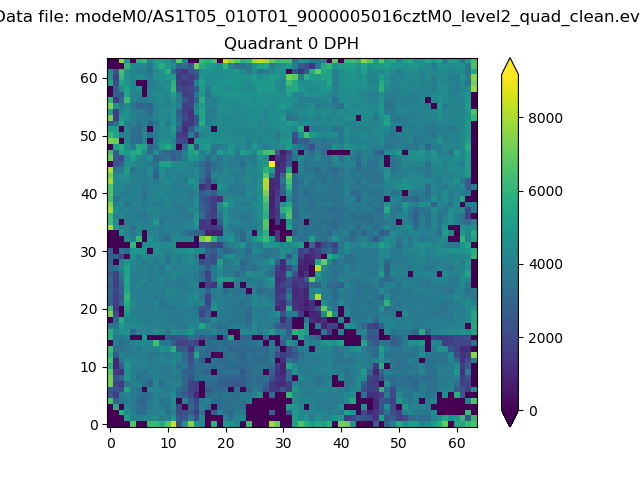 |
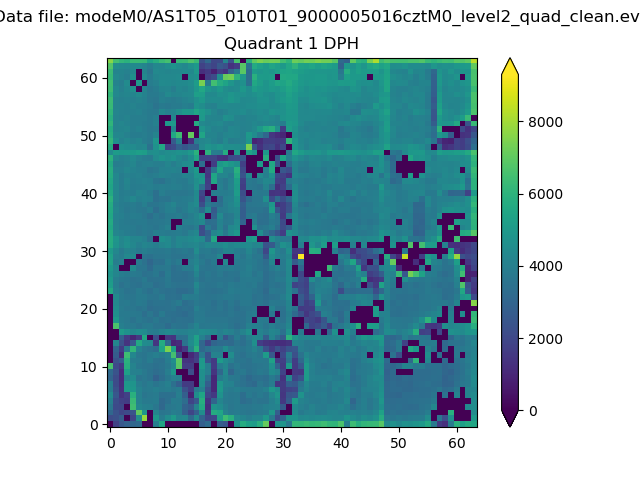 |
Quadrant B |
|---|---|---|---|
| Quadrant D | 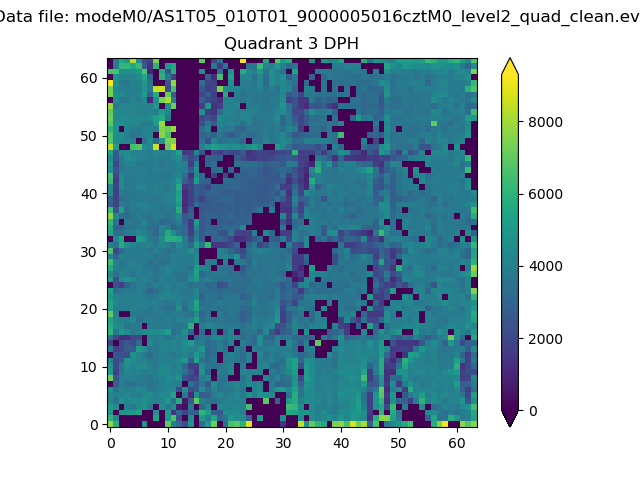 |
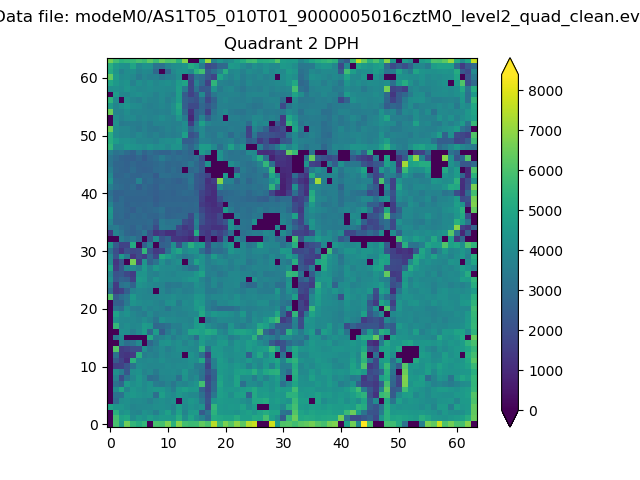 |
Quadrant C |
| Plot type | Count rate plots | Images |
|---|---|---|
| Comparison with Poisson distribution Blue bars denote a histogram of data divided into 1 sec bins. Red curve is a Poisson curve with rate = median count rate of data. |
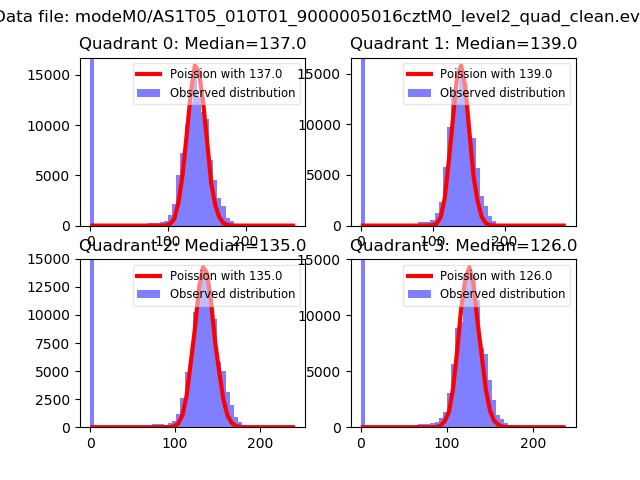 |
 |
| Quadrant-wise count rates Data is divided into 100 sec bins |
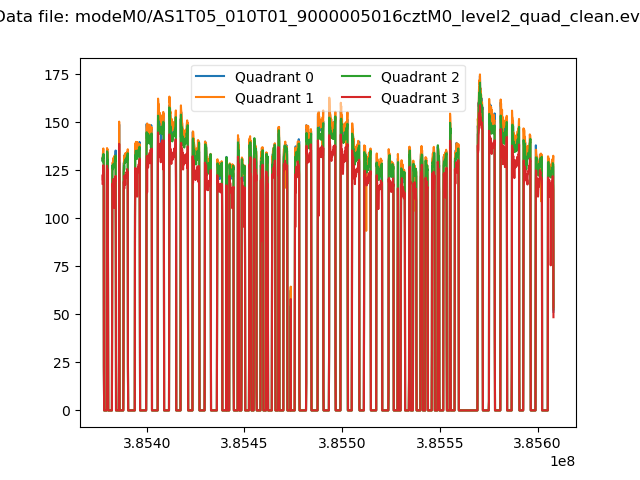 |
|
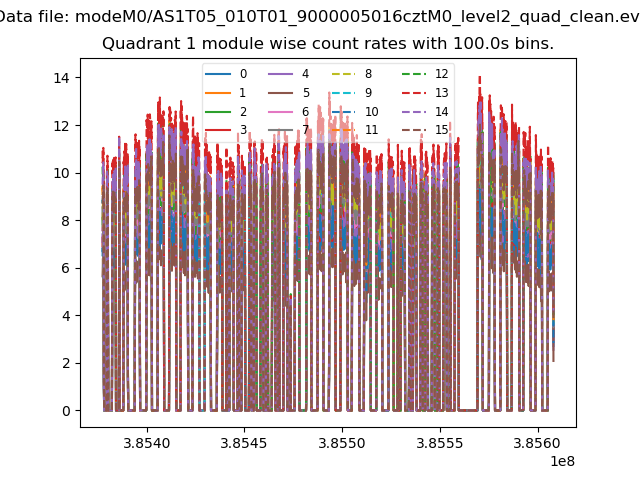
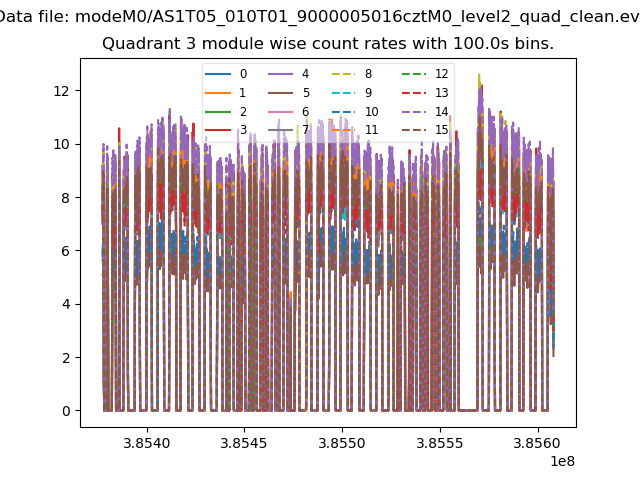
| Module-wise count rates for Quadrant A Data is divided into 100 sec bins |
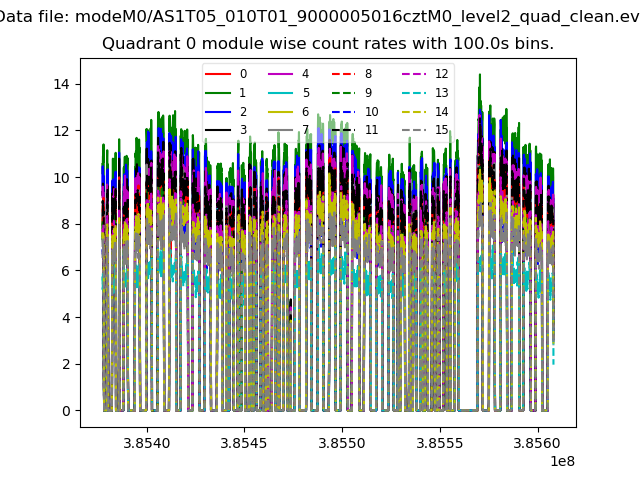 |
 |
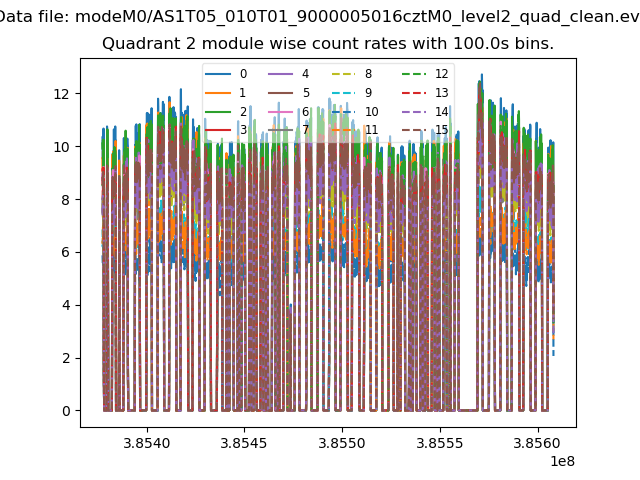
| Module-wise count rates for Quadrant B Data is divided into 100 sec bins |
 |
 |
| Module-wise count rates for Quadrant C Data is divided into 100 sec bins |
 |
 |
| Module-wise count rates for Quadrant D Data is divided into 100 sec bins |
 |
 |
| Parameter | Plot |
|---|---|
| CZT HV Monitor | 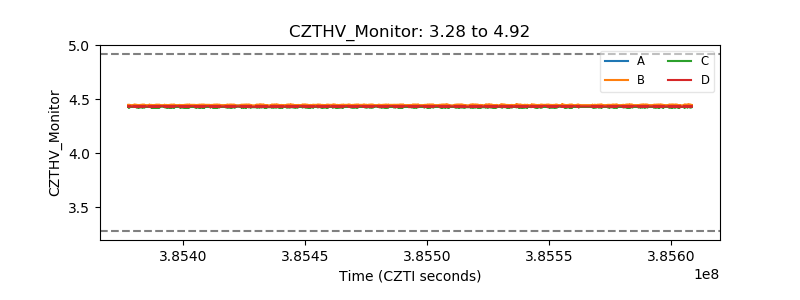 |
| D_VDD | 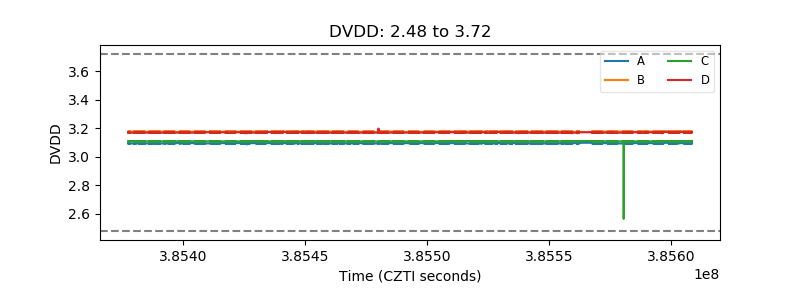 |
| Temperature 1 | 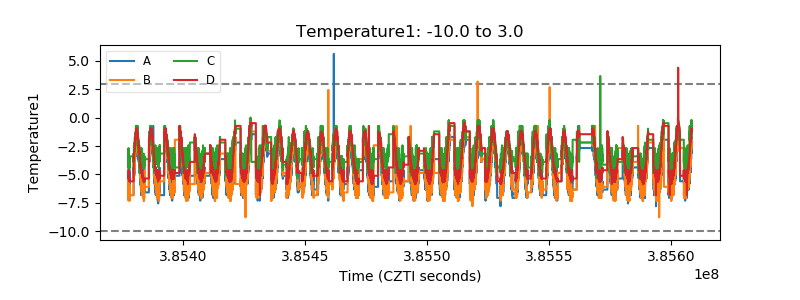 |
| Veto HV Monitor | 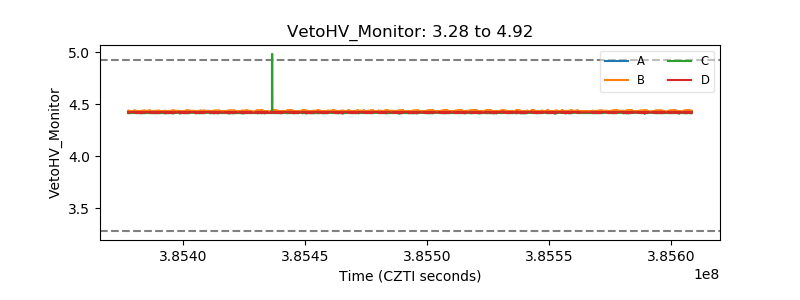 |
| Veto LLD | 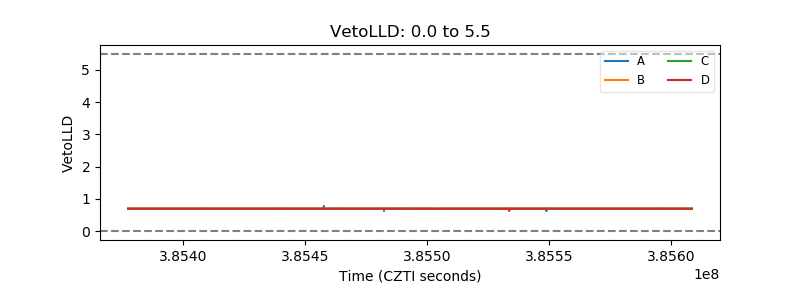 |
| Alpha Counter | 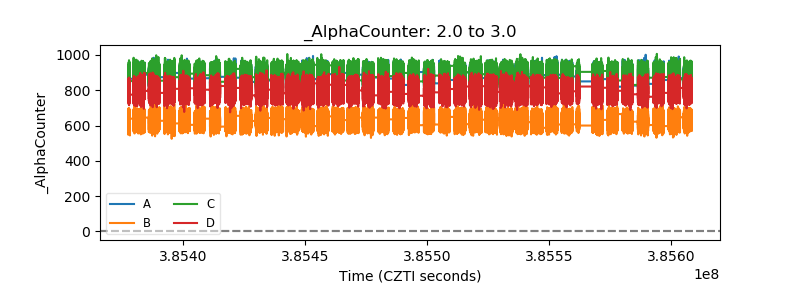 |
| _CPM_Rate | 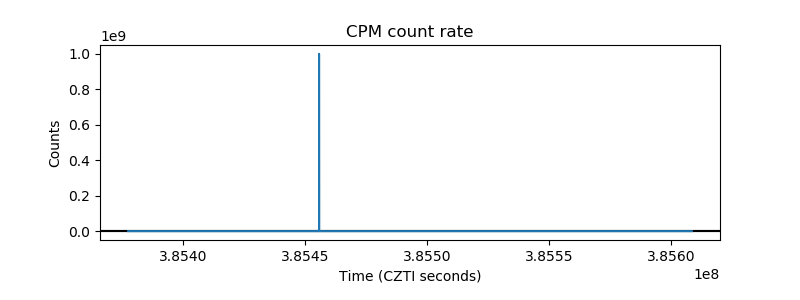 |
| CZT Counter | 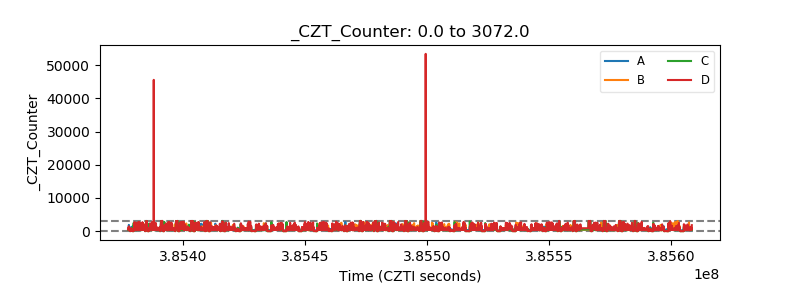 |
| +2.5 Volts monitor | 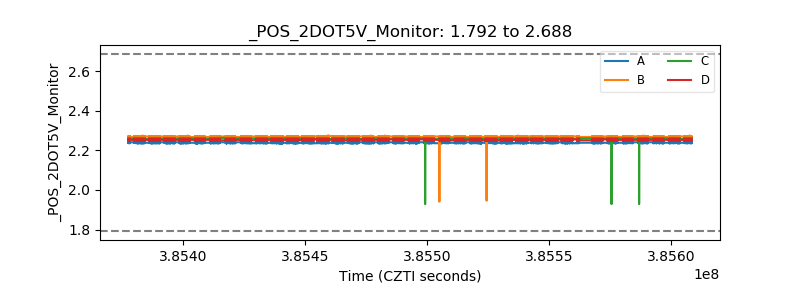 |
| +5 Volts monitor | 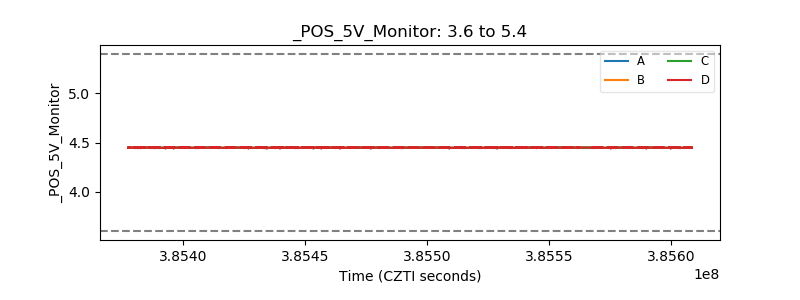 |
| _ROLL_ROT | 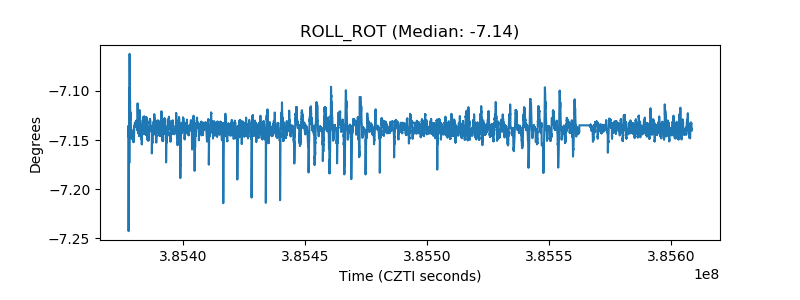 |
| _Roll_DEC | 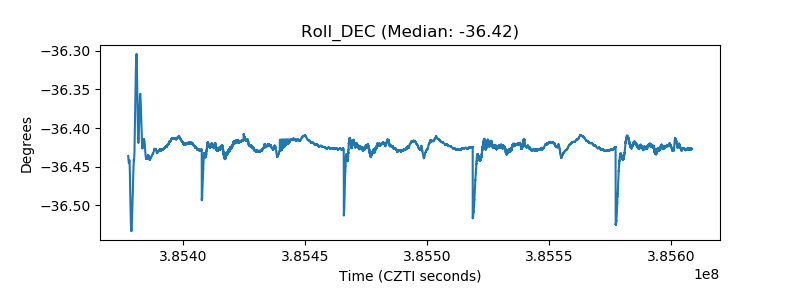 |
| _Roll_RA | 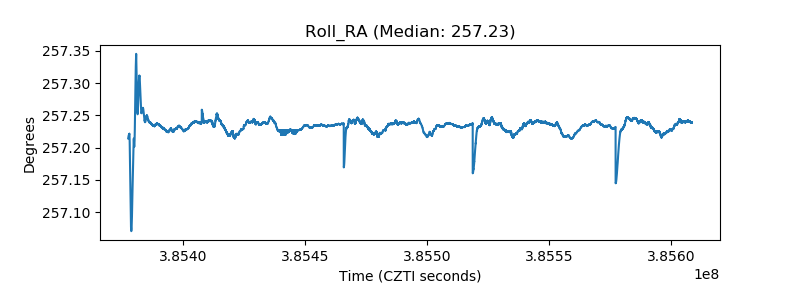 |
| Veto Counter | 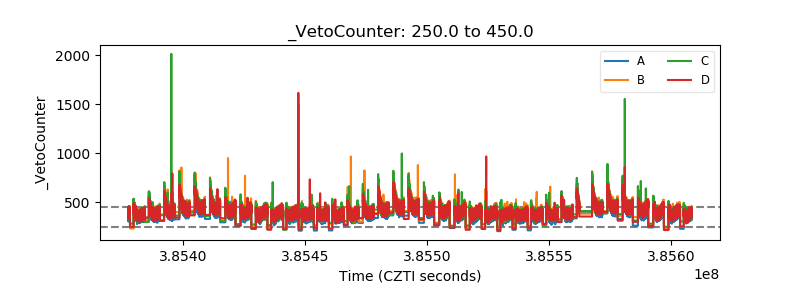 |