| Param | Original file | Final file |
|---|---|---|
| Filename | modeM0/AS1A10_123T11_9000005014_34992cztM0_level2.evt | modeM0/AS1A10_123T11_9000005014_34992cztM0_level2_quad_clean.evt |
| Size (bytes) | 507,297,600 | 71,648,640 |
| Size | 483.8 MB | 68.3 MB |
| Events in quadrant A | 4,903,171 | 386,710 |
| Events in quadrant B | 2,739,643 | 470,884 |
| Events in quadrant C | 3,153,255 | 466,758 |
| Events in quadrant D | 4,169,550 | 435,005 |
| Mode M0 | |||
|---|---|---|---|
| Quadrant | BADHDUFLAG | Total packets | Discarded packets |
| A | 0 | 18314 | 3 |
| B | 0 | 11985 | 2 |
| C | 0 | 13060 | 2 |
| D | 0 | 16561 | 2 |
| Mode SS | |||
|---|---|---|---|
| Quadrant | BADHDUFLAG | Total packets | Discarded packets |
| A | 0 | 118 | 0 |
| B | 0 | 118 | 0 |
| C | 0 | 118 | 0 |
| D | 0 | 118 | 0 |
| Mode M9 | |||
|---|---|---|---|
| Quadrant | BADHDUFLAG | Total packets | Discarded packets |
| A | 0 | 25 | 0 |
| B | 0 | 25 | 0 |
| C | 0 | 25 | 0 |
| D | 0 | 26 | 0 |
| Quadrant | Total seconds | Saturated seconds | Saturation percentage |
|---|---|---|---|
| A | 5866 | 918 | 15.649506% |
| B | 5866 | 13 | 0.221616% |
| C | 5866 | 34 | 0.579611% |
| D | 5866 | 128 | 2.182066% |
Noise dominated data is calculated using 1-second bins in cleaned event files. If a bin has >2000 counts, and if more than 50% of those come from <1% of pixels, then it is considered to be noise-dominated and hence unusable.
| Quadrant | # 1 sec bins | Bins with >0 counts | Bins with >2000 counts | High rate bins dominated by noise | Noise dominated (total time) | Noise dominated (detector-on time) | Marked lightcurve |
|---|---|---|---|---|---|---|---|
| A | 7180 | 5867 | 851 | 851 | 11.85% | 14.50% | 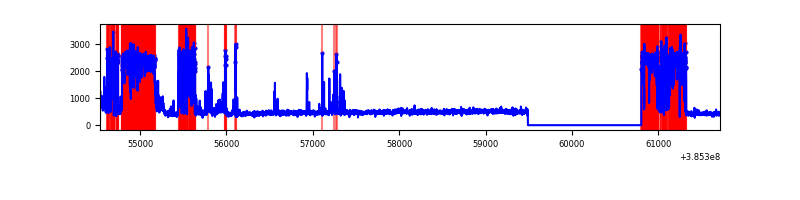 |
| B | 7180 | 5867 | 5 | 5 | 0.07% | 0.09% | 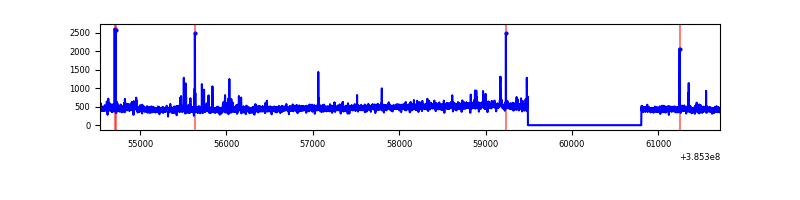 |
| C | 7180 | 5867 | 29 | 29 | 0.40% | 0.49% | 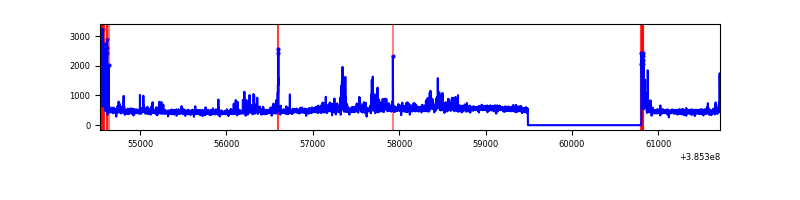 |
| D | 7180 | 5867 | 111 | 111 | 1.55% | 1.89% | 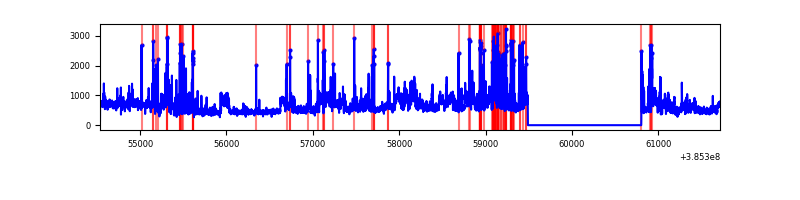 |
Top three noisy pixels from each quadrant. If the there are fewer than three noisy pixels in the level2.evt file, extra rows are filled as -1
| Pixel properties | Quadrant properties | ||||||
|---|---|---|---|---|---|---|---|
| Quadrant | DetID | PixID | Counts | Sigma | Mean | Median | Sigma |
| A | 15 | 169 | 2402504 | 19387.28 | 614 | 602 | 123.9 |
| A | 10 | 83 | 60354 | 482.3 | 614 | 602 | 123.9 |
| A | 9 | 143 | 52841 | 421.65 | 614 | 602 | 123.9 |
| B | 5 | 172 | 40881 | 311.49 | 668 | 651 | 129.2 |
| B | 4 | 232 | 17242 | 128.46 | 668 | 651 | 129.2 |
| B | 12 | 111 | 16345 | 121.52 | 668 | 651 | 129.2 |
| C | 15 | 214 | 244074 | 1601.52 | 652 | 655 | 152.0 |
| C | 15 | 159 | 185099 | 1213.51 | 652 | 655 | 152.0 |
| C | 0 | 10 | 132823 | 869.57 | 652 | 655 | 152.0 |
| D | 8 | 195 | 1004587 | 6365.58 | 648 | 629 | 157.7 |
| D | 13 | 249 | 242522 | 1533.72 | 648 | 629 | 157.7 |
| D | 12 | 217 | 211014 | 1333.94 | 648 | 629 | 157.7 |
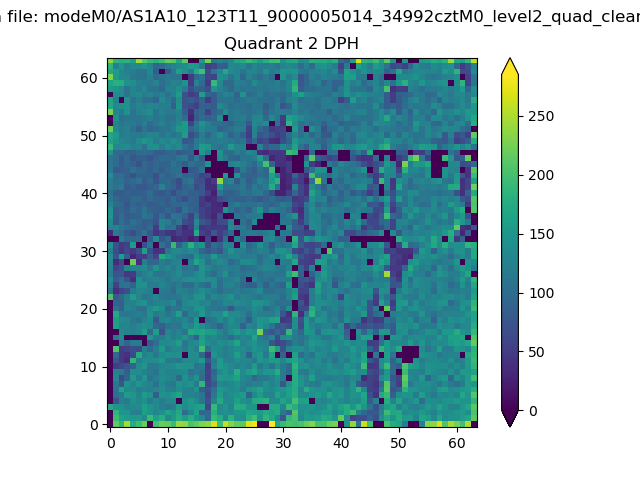
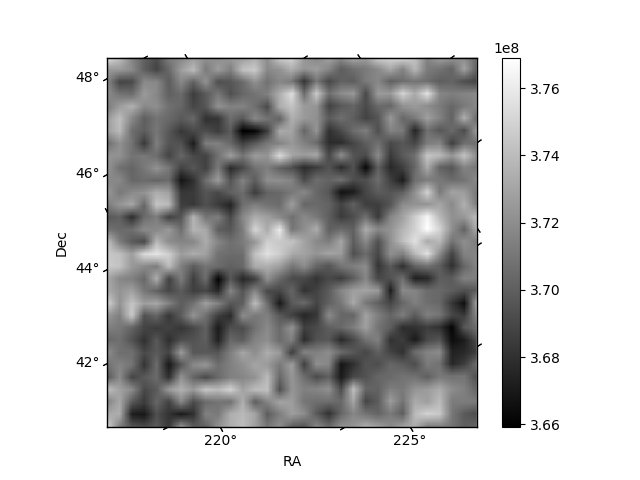
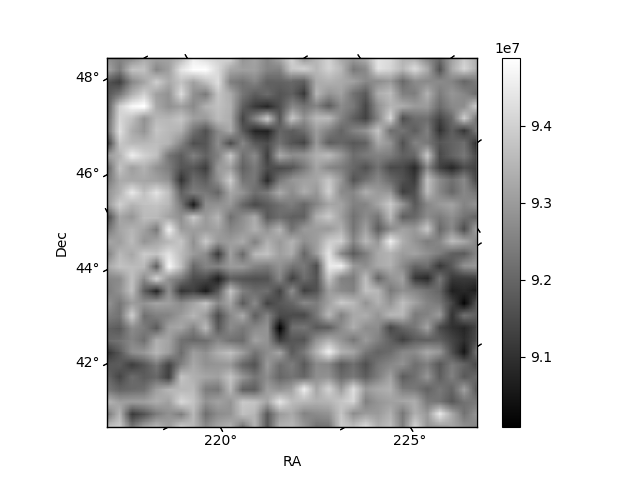
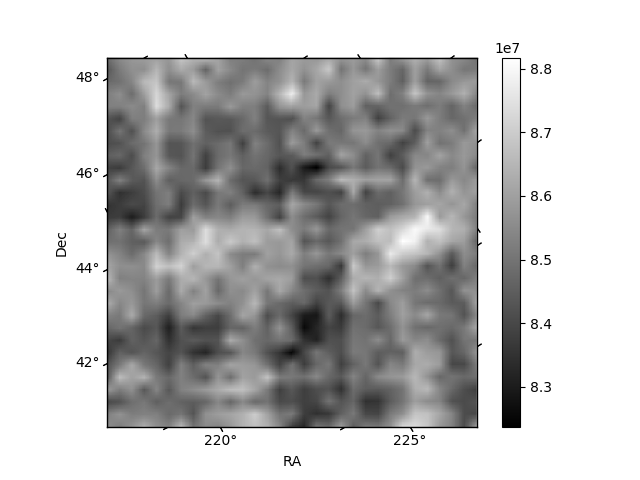
Histogram calculated using DETX and DETY for each event in the final _common_clean file
| Quadrant A | 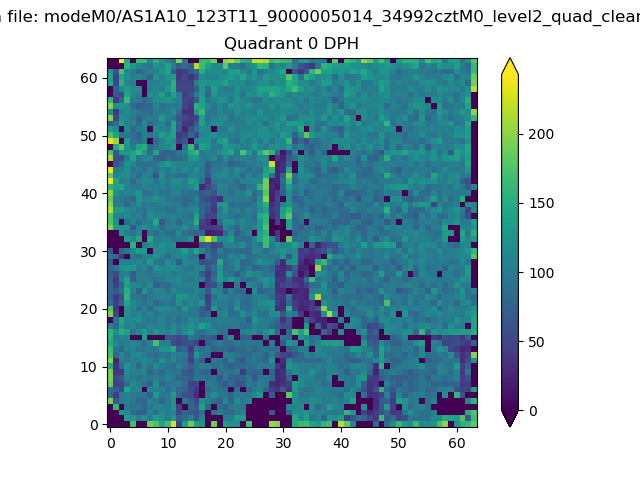 |
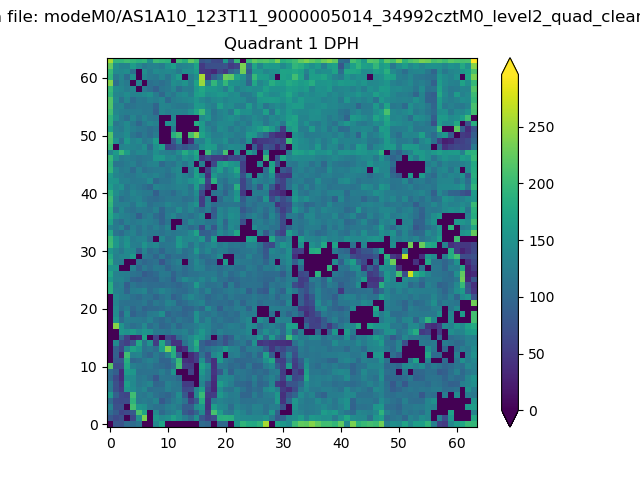 |
Quadrant B |
|---|---|---|---|
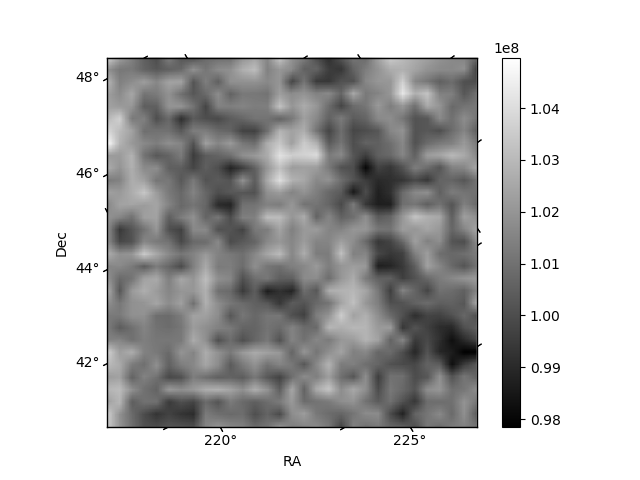
| Quadrant D | 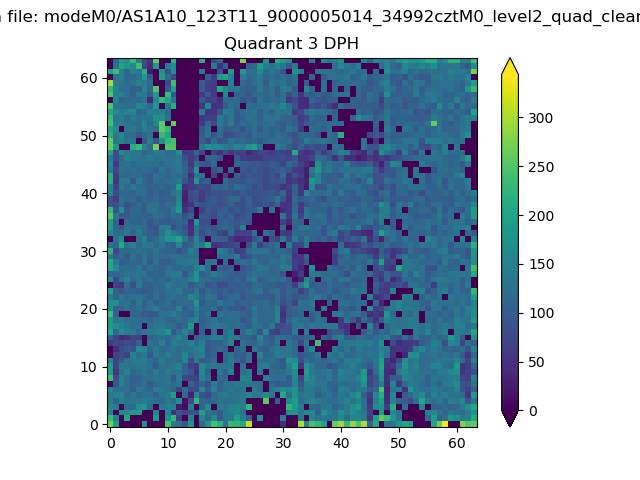 |
 |
Quadrant C |
| Plot type | Count rate plots | Images |
|---|---|---|
| Comparison with Poisson distribution Blue bars denote a histogram of data divided into 1 sec bins. Red curve is a Poisson curve with rate = median count rate of data. |
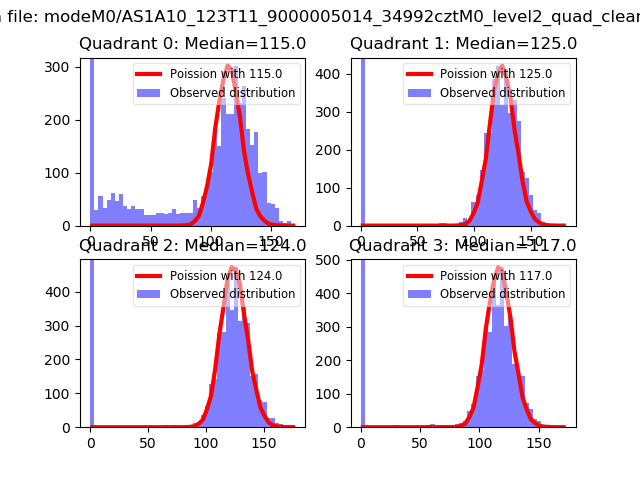 |
 |
| Quadrant-wise count rates Data is divided into 100 sec bins |
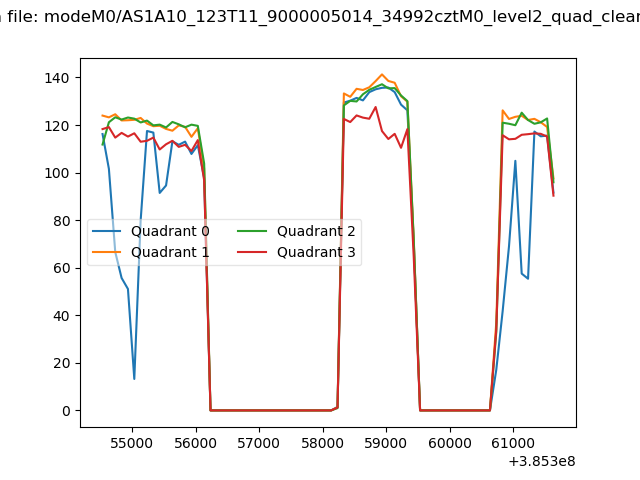 |
|
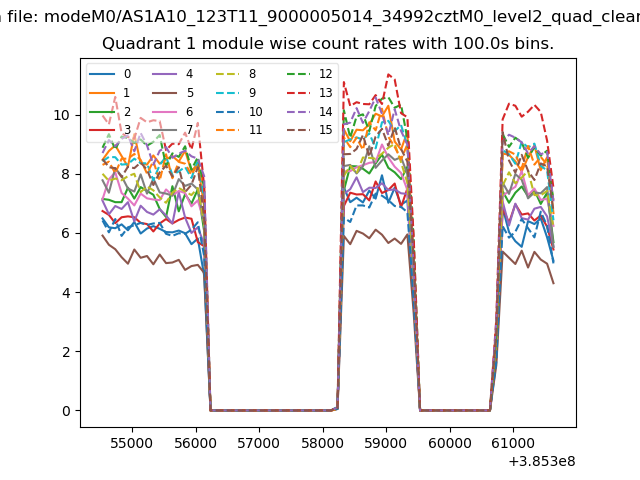
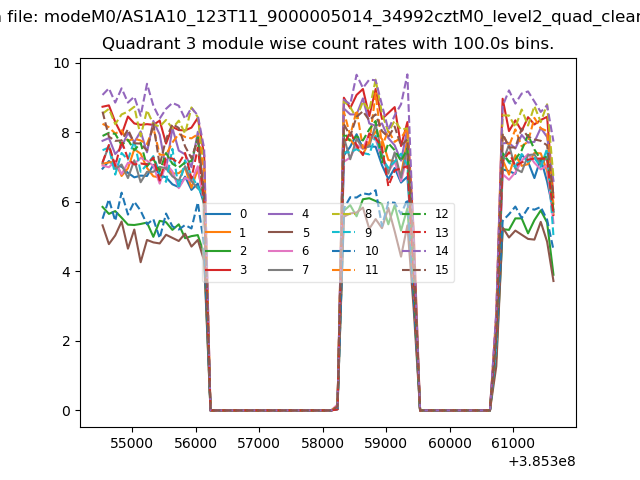
| Module-wise count rates for Quadrant A Data is divided into 100 sec bins |
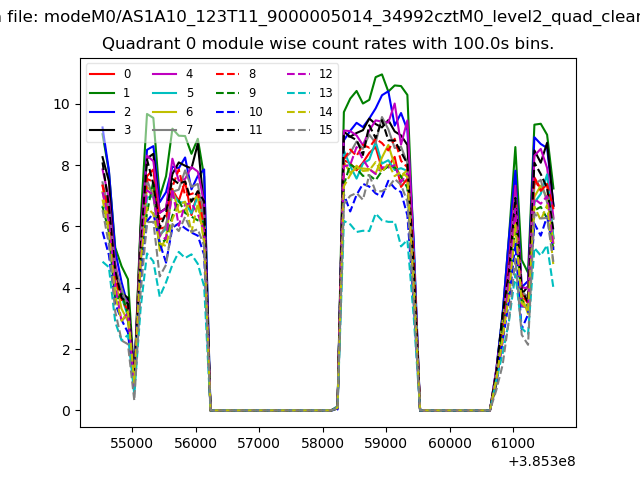 |
 |
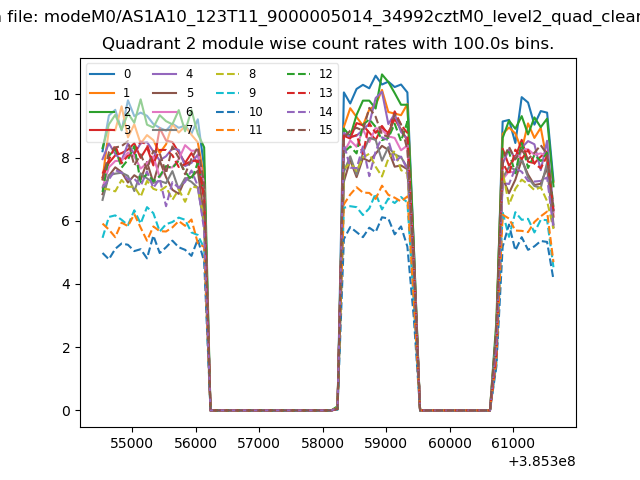
| Module-wise count rates for Quadrant B Data is divided into 100 sec bins |
 |
 |
| Module-wise count rates for Quadrant C Data is divided into 100 sec bins |
 |
 |
| Module-wise count rates for Quadrant D Data is divided into 100 sec bins |
 |
 |
| Parameter | Plot |
|---|---|
| CZT HV Monitor | 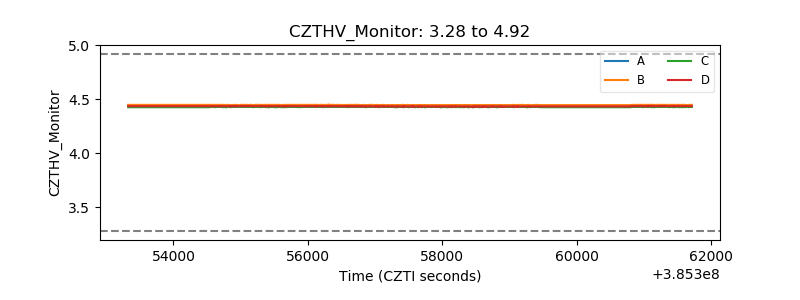 |
| D_VDD | 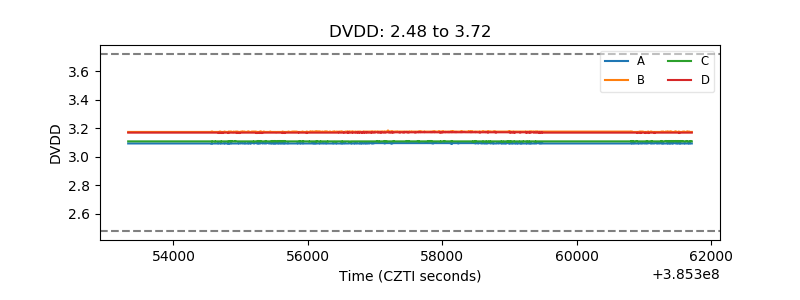 |
| Temperature 1 | 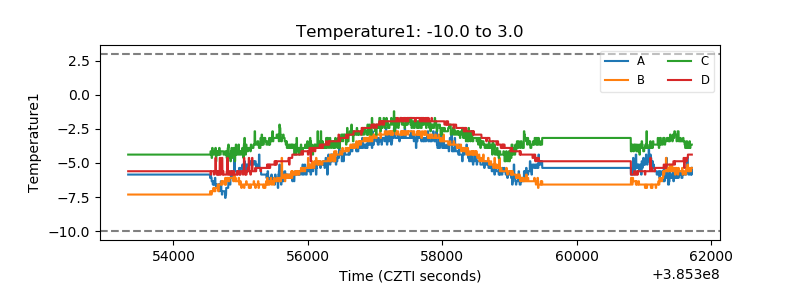 |
| Veto HV Monitor | 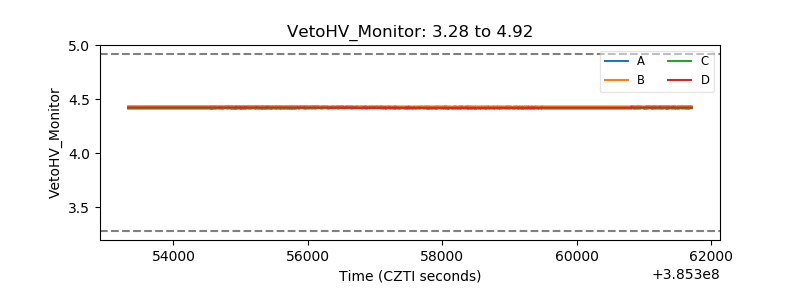 |
| Veto LLD | 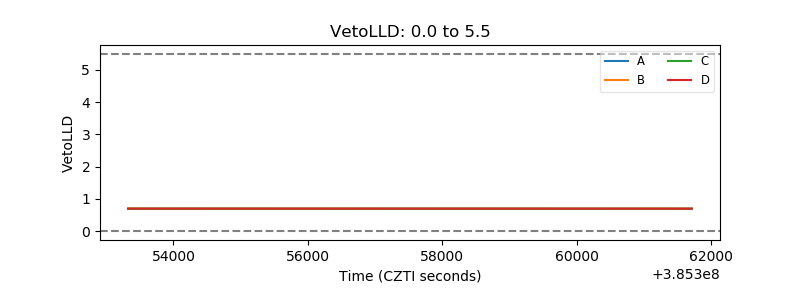 |
| Alpha Counter | 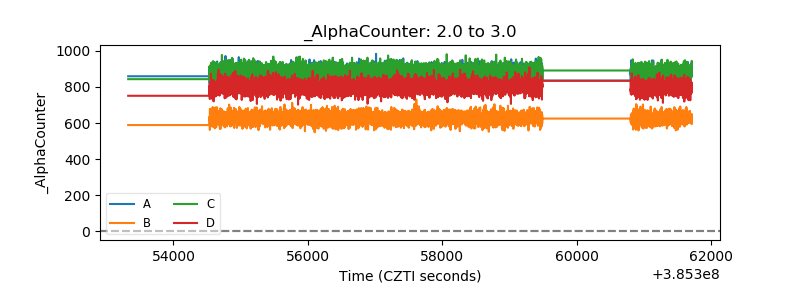 |
| _CPM_Rate | 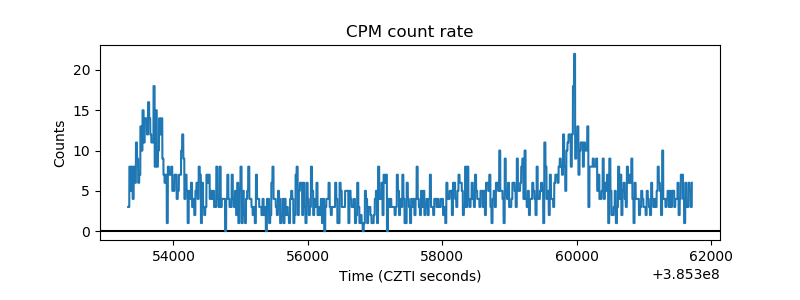 |
| CZT Counter | 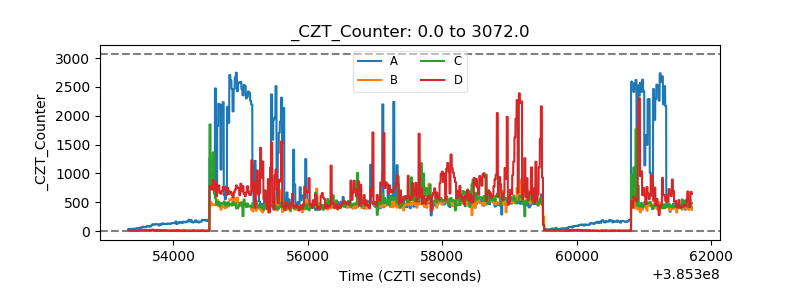 |
| +2.5 Volts monitor | 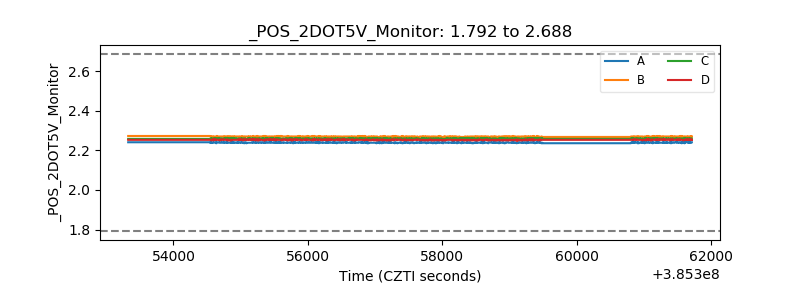 |
| +5 Volts monitor | 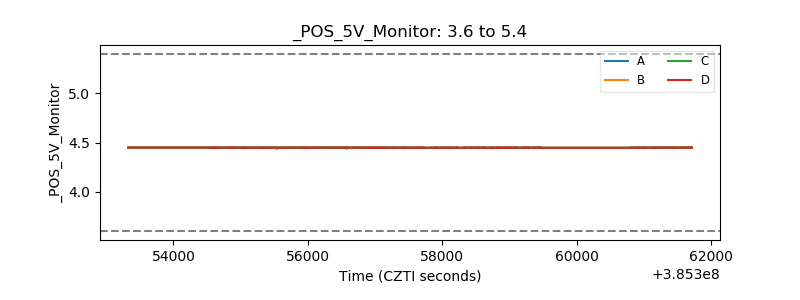 |
| _ROLL_ROT | 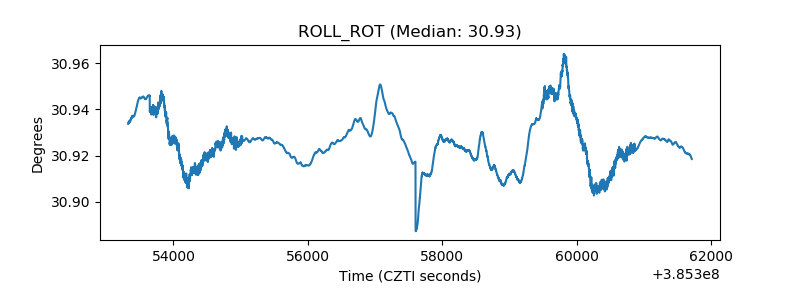 |
| _Roll_DEC | 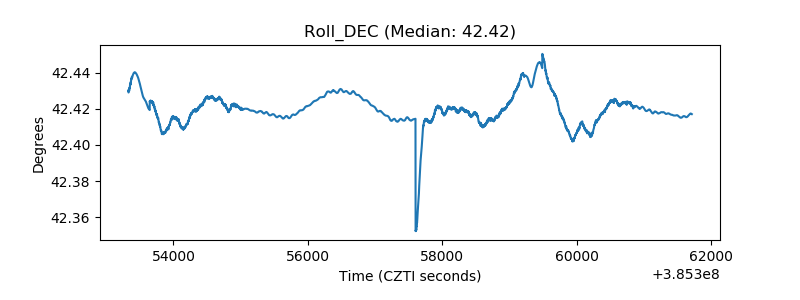 |
| _Roll_RA | 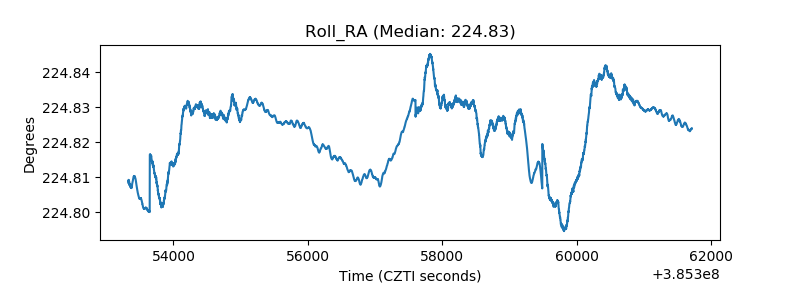 |
| Veto Counter | 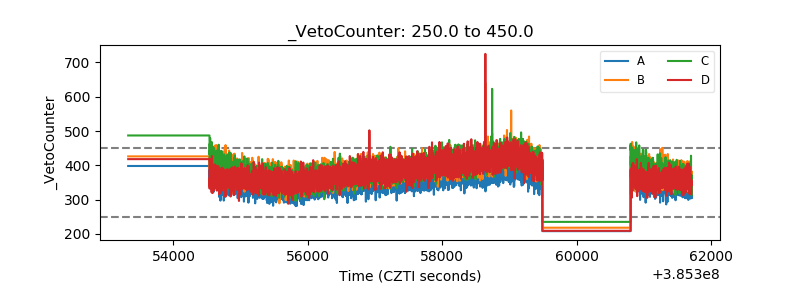 |