| Param | Original file | Final file |
|---|---|---|
| Filename | modeM0/AS1A10_123T11_9000005014_34990cztM0_level2.evt | modeM0/AS1A10_123T11_9000005014_34990cztM0_level2_quad_clean.evt |
| Size (bytes) | 465,442,560 | 68,526,720 |
| Size | 443.9 MB | 65.4 MB |
| Events in quadrant A | 2,716,662 | 415,578 |
| Events in quadrant B | 3,344,629 | 424,665 |
| Events in quadrant C | 3,094,645 | 423,490 |
| Events in quadrant D | 4,541,950 | 401,389 |
| Mode M0 | |||
|---|---|---|---|
| Quadrant | BADHDUFLAG | Total packets | Discarded packets |
| A | 0 | 11974 | 3 |
| B | 0 | 13828 | 2 |
| C | 0 | 12759 | 2 |
| D | 0 | 17644 | 2 |
| Mode SS | |||
|---|---|---|---|
| Quadrant | BADHDUFLAG | Total packets | Discarded packets |
| A | 0 | 120 | 0 |
| B | 0 | 120 | 0 |
| C | 0 | 120 | 0 |
| D | 0 | 120 | 0 |
| Mode M9 | |||
|---|---|---|---|
| Quadrant | BADHDUFLAG | Total packets | Discarded packets |
| A | 0 | 38 | 0 |
| B | 0 | 38 | 0 |
| C | 0 | 38 | 0 |
| D | 0 | 38 | 0 |
| Quadrant | Total seconds | Saturated seconds | Saturation percentage |
|---|---|---|---|
| A | 5868 | 5 | 0.085208% |
| B | 5868 | 159 | 2.709611% |
| C | 5868 | 68 | 1.158828% |
| D | 5868 | 188 | 3.203817% |
Noise dominated data is calculated using 1-second bins in cleaned event files. If a bin has >2000 counts, and if more than 50% of those come from <1% of pixels, then it is considered to be noise-dominated and hence unusable.
| Quadrant | # 1 sec bins | Bins with >0 counts | Bins with >2000 counts | High rate bins dominated by noise | Noise dominated (total time) | Noise dominated (detector-on time) | Marked lightcurve |
|---|---|---|---|---|---|---|---|
| A | 9664 | 5870 | 0 | 0 | 0.00% | 0.00% | 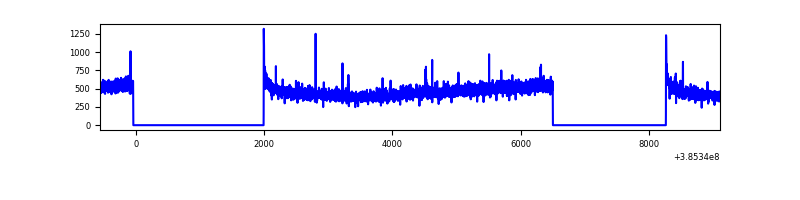 |
| B | 9664 | 5870 | 106 | 106 | 1.10% | 1.81% | 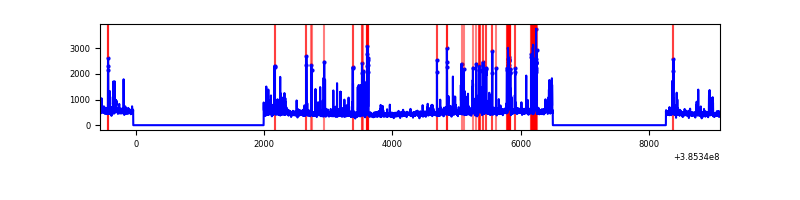 |
| C | 9664 | 5870 | 50 | 50 | 0.52% | 0.85% | 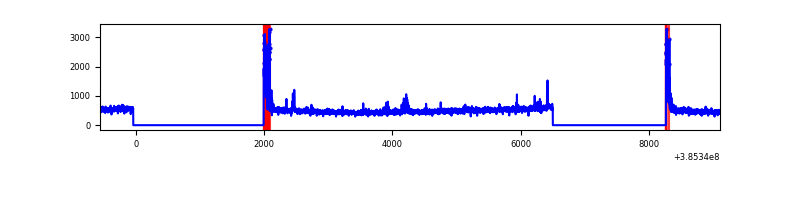 |
| D | 9664 | 5870 | 147 | 147 | 1.52% | 2.50% | 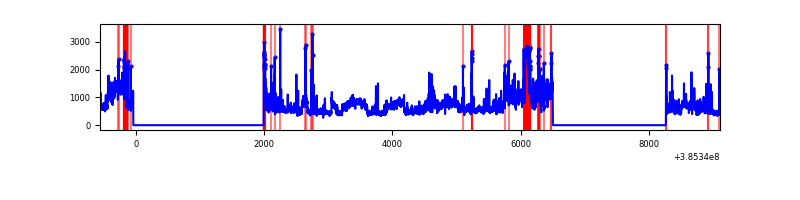 |
Top three noisy pixels from each quadrant. If the there are fewer than three noisy pixels in the level2.evt file, extra rows are filled as -1
| Pixel properties | Quadrant properties | ||||||
|---|---|---|---|---|---|---|---|
| Quadrant | DetID | PixID | Counts | Sigma | Mean | Median | Sigma |
| A | 10 | 83 | 76035 | 555.58 | 676 | 663 | 135.7 |
| A | 13 | 254 | 9937 | 68.36 | 676 | 663 | 135.7 |
| A | 13 | 6 | 9894 | 68.04 | 676 | 663 | 135.7 |
| B | 5 | 172 | 473405 | 3660.04 | 671 | 655 | 129.2 |
| B | 5 | 255 | 91920 | 706.57 | 671 | 655 | 129.2 |
| B | 4 | 232 | 48492 | 370.35 | 671 | 655 | 129.2 |
| C | 15 | 214 | 243217 | 1595.36 | 658 | 665 | 152.0 |
| C | 0 | 10 | 205836 | 1349.49 | 658 | 665 | 152.0 |
| C | 3 | 233 | 39116 | 252.91 | 658 | 665 | 152.0 |
| D | 8 | 195 | 1436418 | 9095.6 | 644 | 626 | 157.9 |
| D | 13 | 249 | 347815 | 2199.41 | 644 | 626 | 157.9 |
| D | 10 | 199 | 45745 | 285.82 | 644 | 626 | 157.9 |
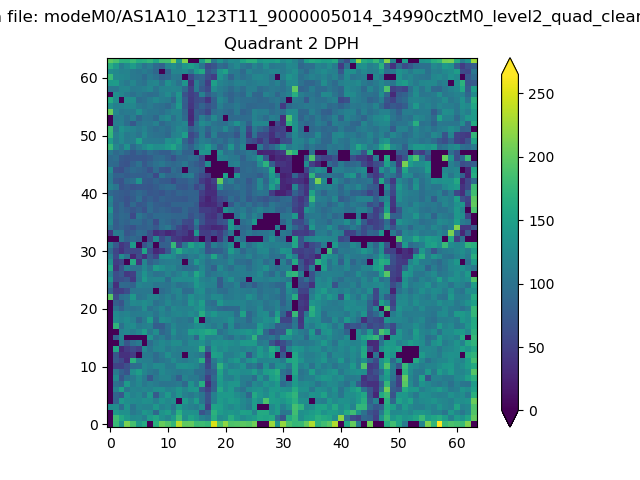
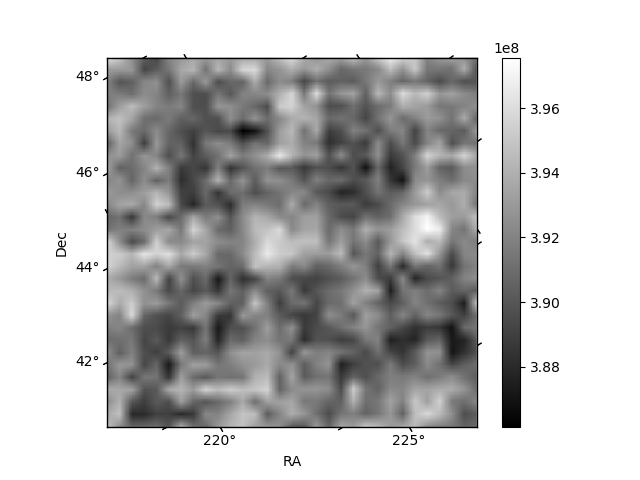
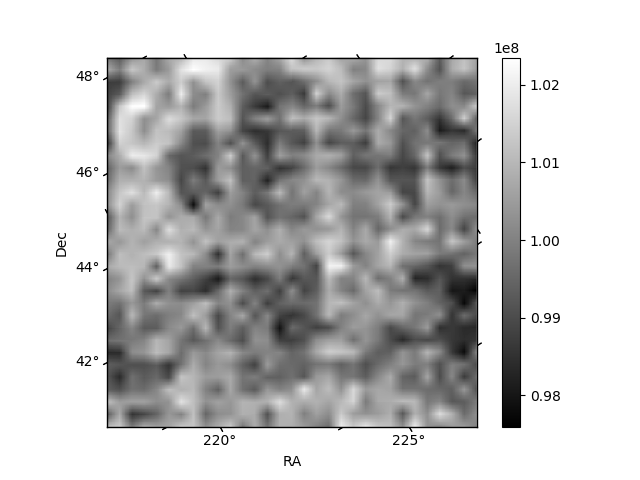
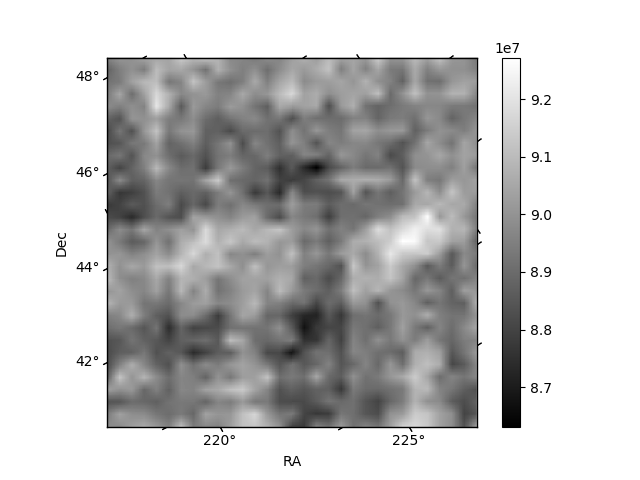
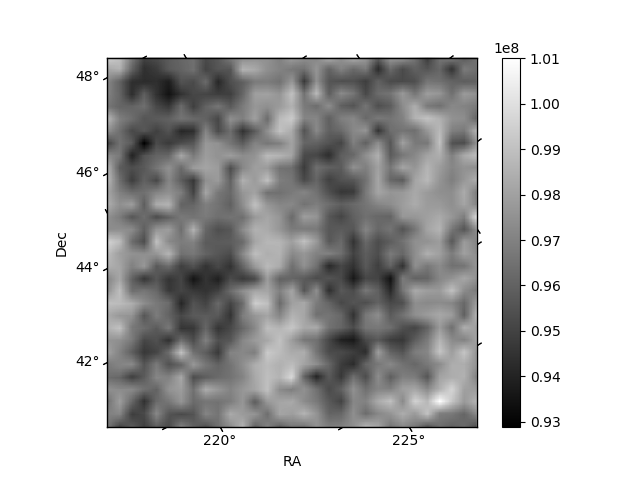
Histogram calculated using DETX and DETY for each event in the final _common_clean file
| Quadrant A | 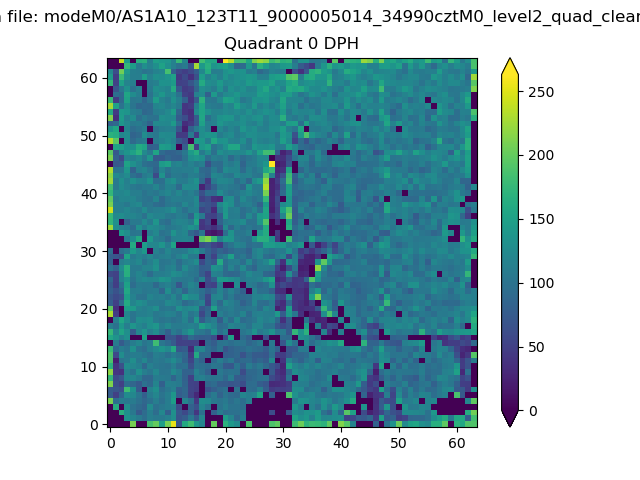 |
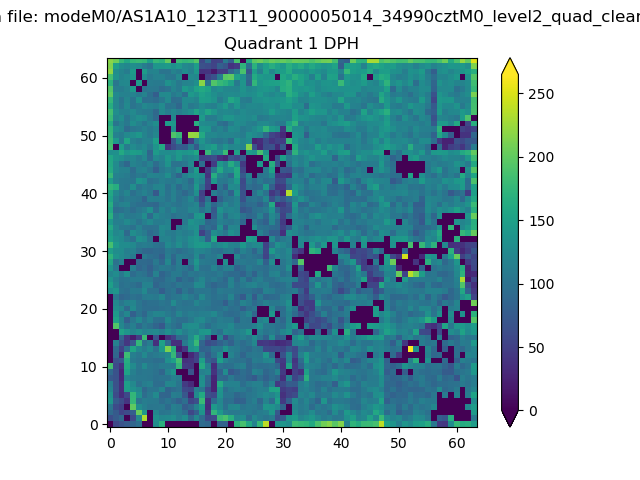 |
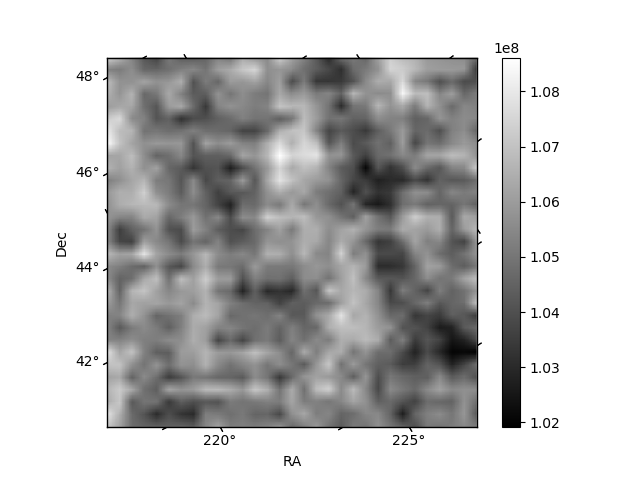
Quadrant B |
|---|---|---|---|
| Quadrant D | 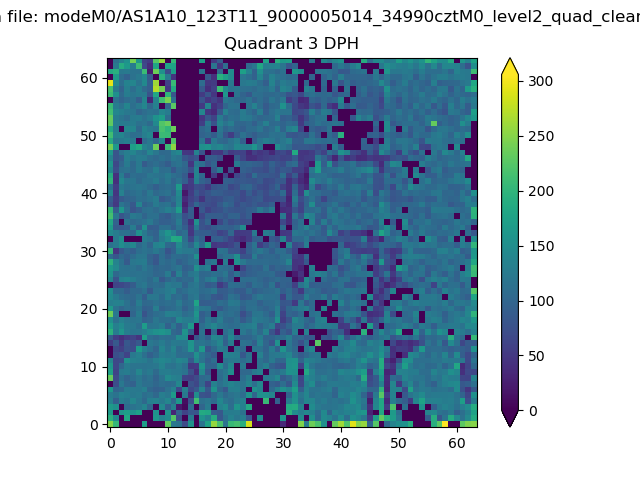 |
 |
Quadrant C |
| Plot type | Count rate plots | Images |
|---|---|---|
| Comparison with Poisson distribution Blue bars denote a histogram of data divided into 1 sec bins. Red curve is a Poisson curve with rate = median count rate of data. |
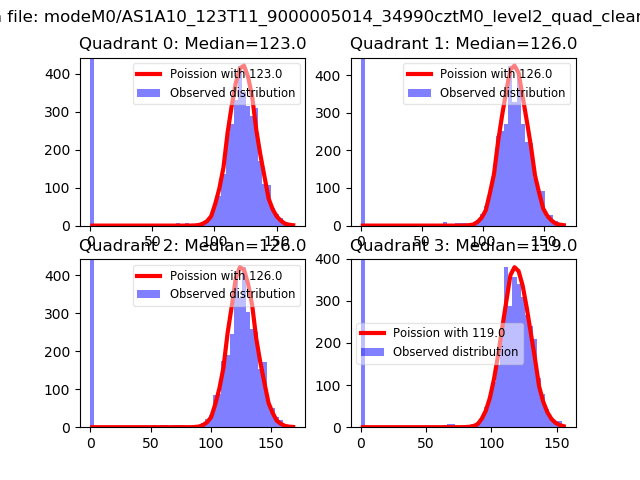 |
 |
| Quadrant-wise count rates Data is divided into 100 sec bins |
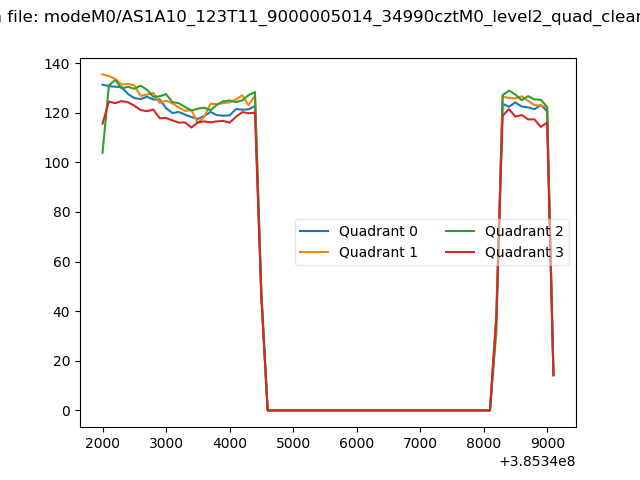 |
|
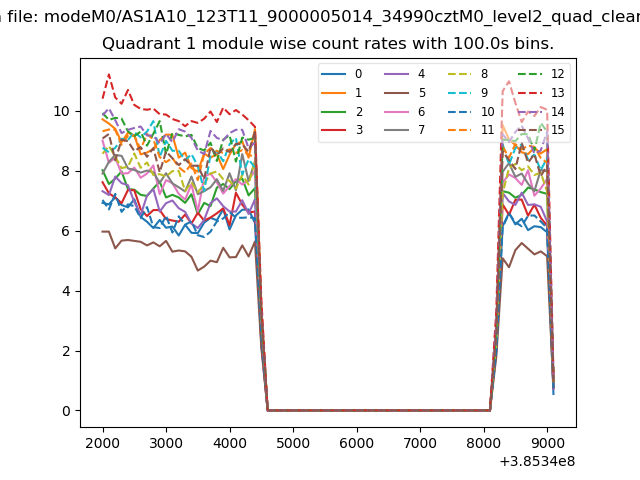
| Module-wise count rates for Quadrant A Data is divided into 100 sec bins |
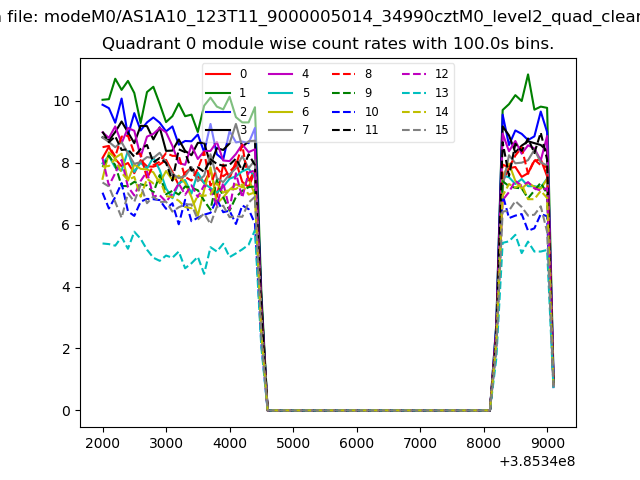 |
 |
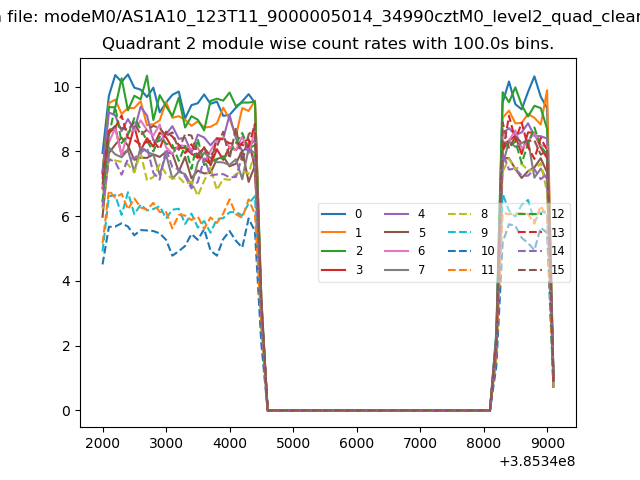
| Module-wise count rates for Quadrant B Data is divided into 100 sec bins |
 |
 |
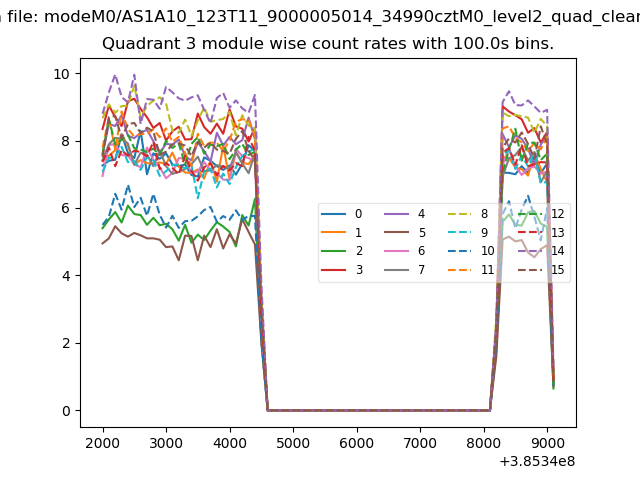
| Module-wise count rates for Quadrant C Data is divided into 100 sec bins |
 |
 |
| Module-wise count rates for Quadrant D Data is divided into 100 sec bins |
 |
 |
| Parameter | Plot |
|---|---|
| CZT HV Monitor | 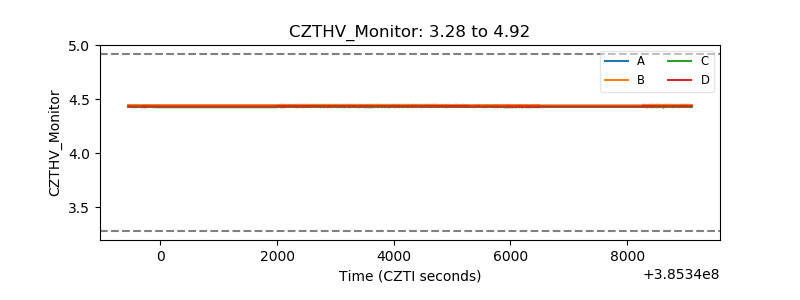 |
| D_VDD | 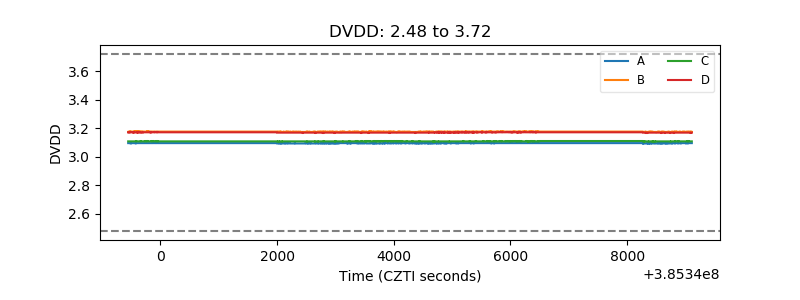 |
| Temperature 1 | 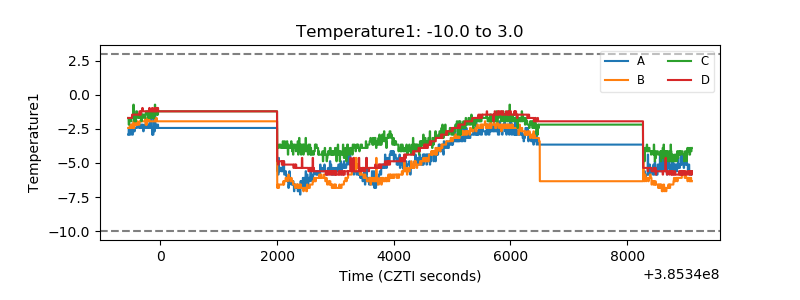 |
| Veto HV Monitor | 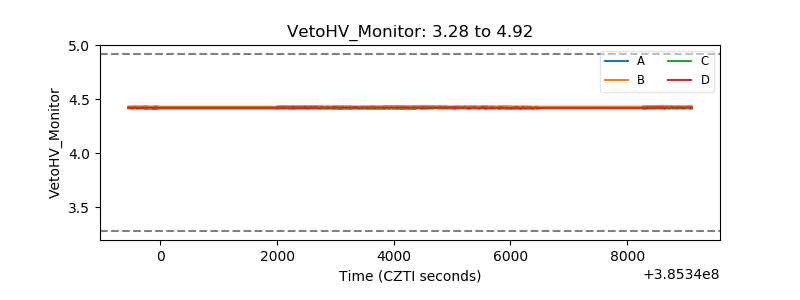 |
| Veto LLD | 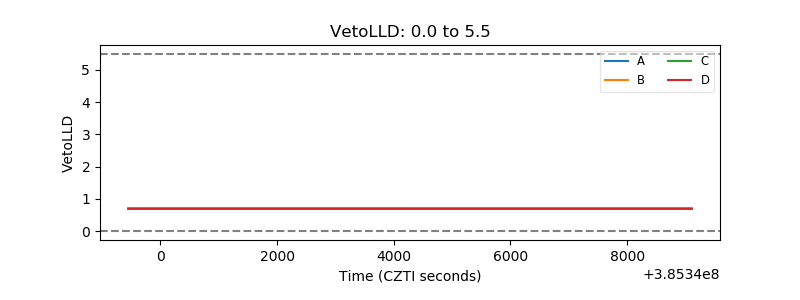 |
| Alpha Counter | 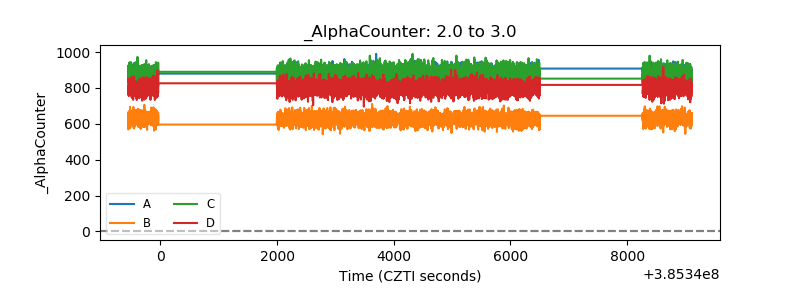 |
| _CPM_Rate | 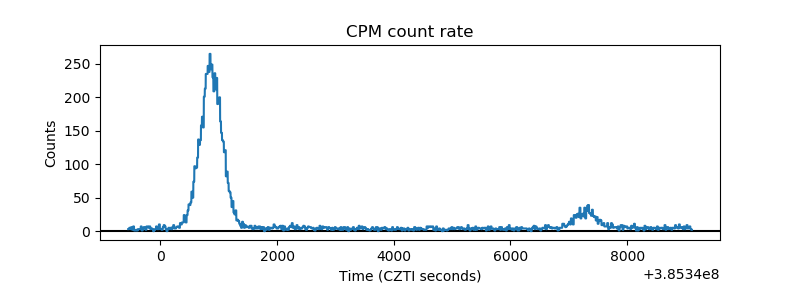 |
| CZT Counter | 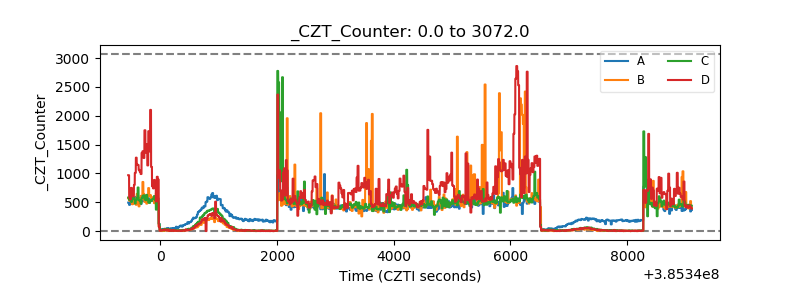 |
| +2.5 Volts monitor | 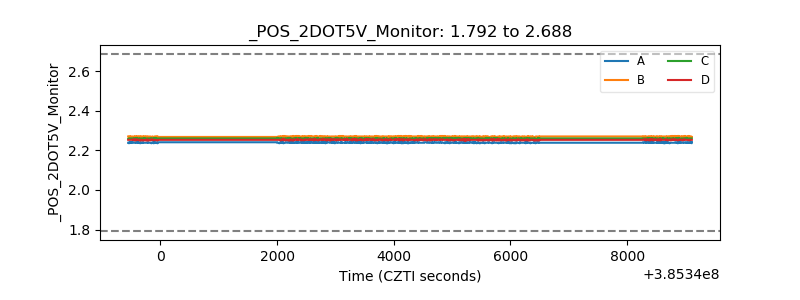 |
| +5 Volts monitor | 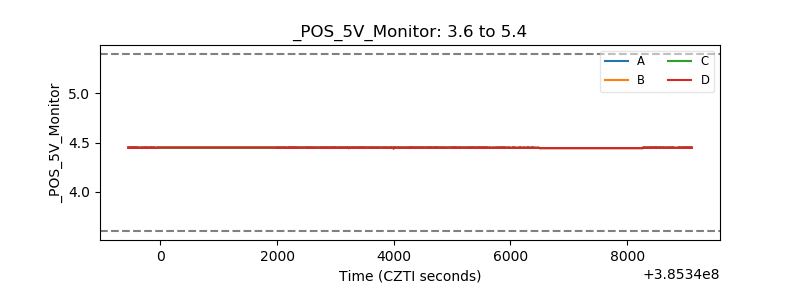 |
| _ROLL_ROT | 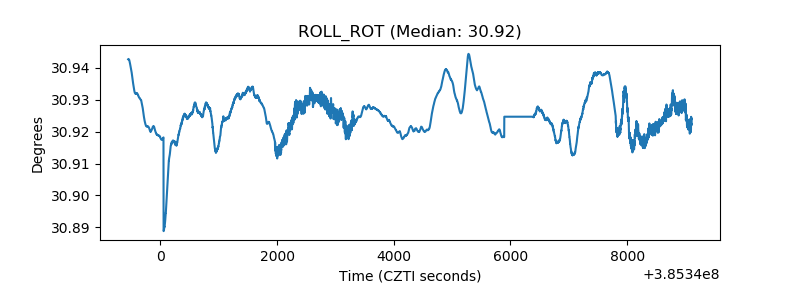 |
| _Roll_DEC | 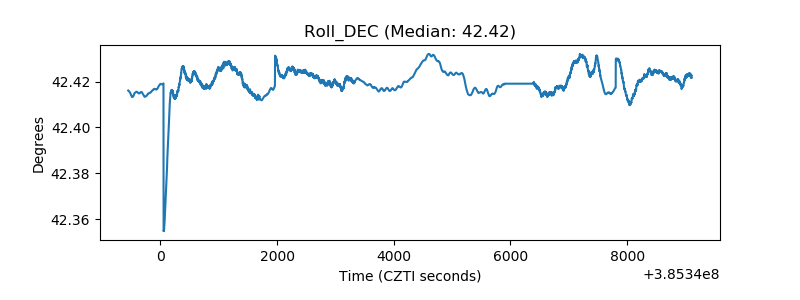 |
| _Roll_RA | 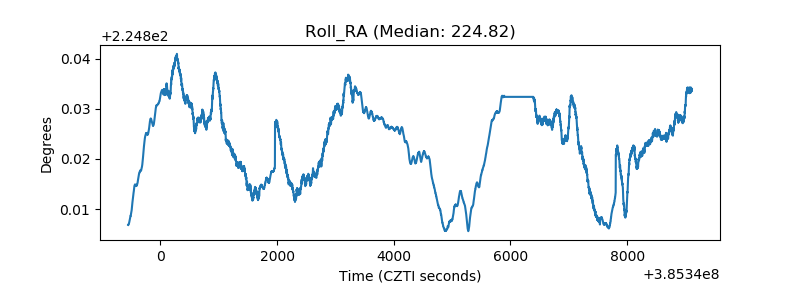 |
| Veto Counter | 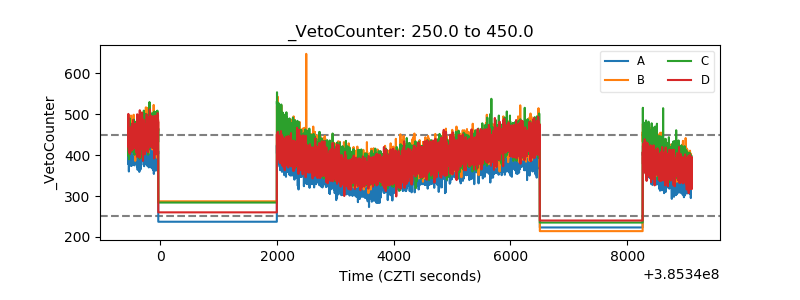 |