| Param | Original file | Final file |
|---|---|---|
| Filename | modeM0/AS1A10_123T11_9000005014_34989cztM0_level2.evt | modeM0/AS1A10_123T11_9000005014_34989cztM0_level2_quad_clean.evt |
| Size (bytes) | 380,462,400 | 74,511,360 |
| Size | 362.8 MB | 71.1 MB |
| Events in quadrant A | 2,281,592 | 475,969 |
| Events in quadrant B | 2,459,610 | 490,278 |
| Events in quadrant C | 2,665,126 | 486,678 |
| Events in quadrant D | 3,780,256 | 457,160 |
| Mode M0 | |||
|---|---|---|---|
| Quadrant | BADHDUFLAG | Total packets | Discarded packets |
| A | 0 | 10089 | 3 |
| B | 0 | 10534 | 2 |
| C | 0 | 10806 | 2 |
| D | 0 | 14572 | 2 |
| Mode SS | |||
|---|---|---|---|
| Quadrant | BADHDUFLAG | Total packets | Discarded packets |
| A | 0 | 100 | 0 |
| B | 0 | 100 | 0 |
| C | 0 | 100 | 0 |
| D | 0 | 100 | 0 |
| Mode M9 | |||
|---|---|---|---|
| Quadrant | BADHDUFLAG | Total packets | Discarded packets |
| A | 0 | 38 | 0 |
| B | 0 | 38 | 0 |
| C | 0 | 38 | 0 |
| D | 0 | 39 | 0 |
| Quadrant | Total seconds | Saturated seconds | Saturation percentage |
|---|---|---|---|
| A | 4939 | 2 | 0.040494% |
| B | 4939 | 30 | 0.607410% |
| C | 4939 | 85 | 1.720996% |
| D | 4939 | 102 | 2.065195% |
Noise dominated data is calculated using 1-second bins in cleaned event files. If a bin has >2000 counts, and if more than 50% of those come from <1% of pixels, then it is considered to be noise-dominated and hence unusable.
| Quadrant | # 1 sec bins | Bins with >0 counts | Bins with >2000 counts | High rate bins dominated by noise | Noise dominated (total time) | Noise dominated (detector-on time) | Marked lightcurve |
|---|---|---|---|---|---|---|---|
| A | 6972 | 4940 | 0 | 0 | 0.00% | 0.00% | 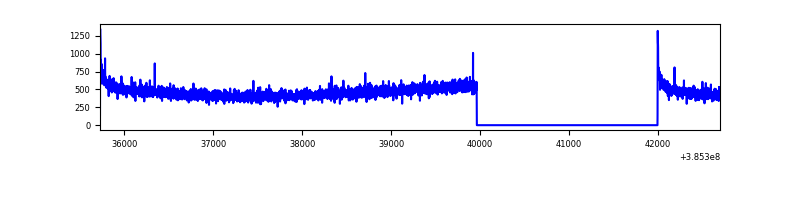 |
| B | 6972 | 4940 | 13 | 13 | 0.19% | 0.26% | 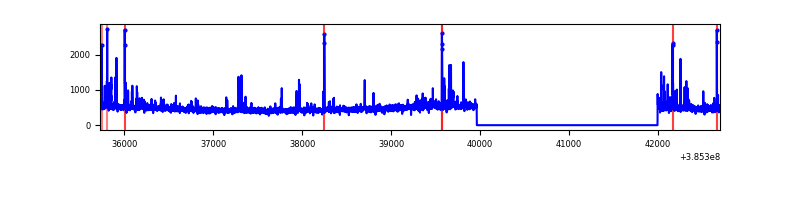 |
| C | 6972 | 4940 | 64 | 64 | 0.92% | 1.30% | 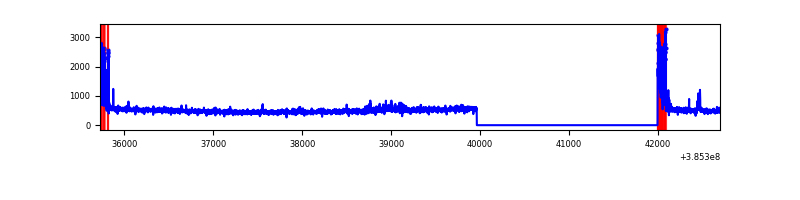 |
| D | 6972 | 4940 | 85 | 85 | 1.22% | 1.72% | 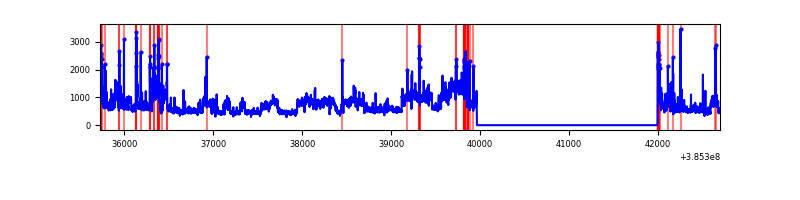 |
Top three noisy pixels from each quadrant. If the there are fewer than three noisy pixels in the level2.evt file, extra rows are filled as -1
| Pixel properties | Quadrant properties | ||||||
|---|---|---|---|---|---|---|---|
| Quadrant | DetID | PixID | Counts | Sigma | Mean | Median | Sigma |
| A | 10 | 83 | 70089 | 608.02 | 568 | 559 | 114.4 |
| A | 13 | 6 | 11209 | 93.13 | 568 | 559 | 114.4 |
| A | 13 | 254 | 8282 | 67.54 | 568 | 559 | 114.4 |
| B | 5 | 172 | 78885 | 716.95 | 572 | 557 | 109.3 |
| B | 5 | 255 | 59211 | 536.87 | 572 | 557 | 109.3 |
| B | 15 | 85 | 29753 | 267.24 | 572 | 557 | 109.3 |
| C | 0 | 10 | 230102 | 1774.09 | 559 | 564 | 129.4 |
| C | 15 | 214 | 206757 | 1593.66 | 559 | 564 | 129.4 |
| C | 15 | 159 | 23206 | 175.0 | 559 | 564 | 129.4 |
| D | 8 | 195 | 1273745 | 9369.97 | 553 | 539 | 135.9 |
| D | 13 | 249 | 179357 | 1315.98 | 553 | 539 | 135.9 |
| D | 1 | 47 | 61620 | 449.52 | 553 | 539 | 135.9 |
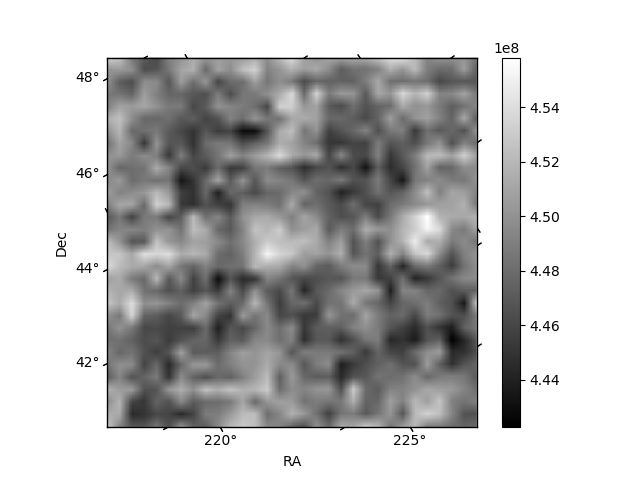
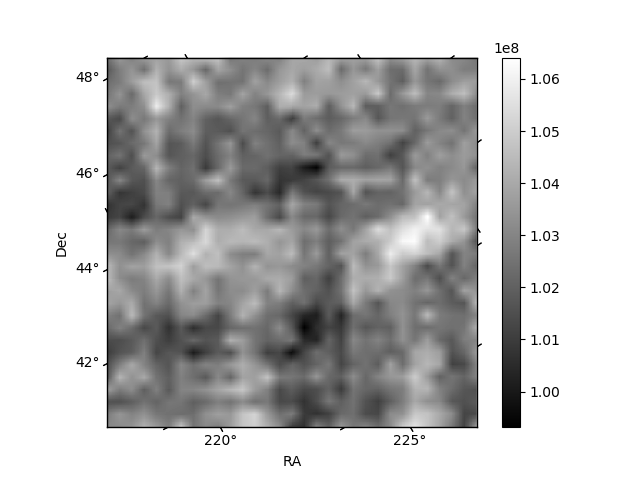
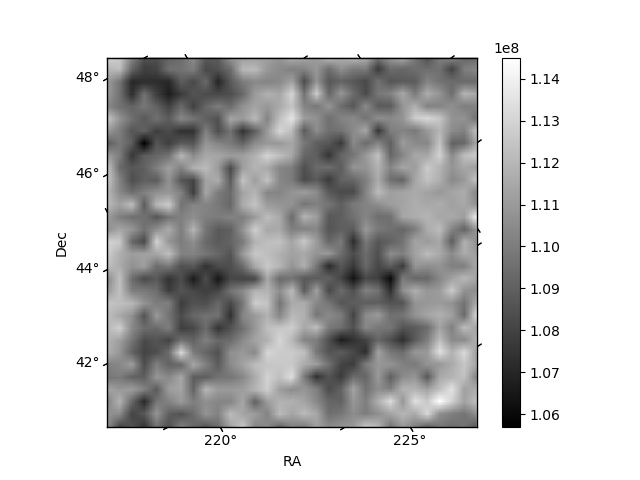
Histogram calculated using DETX and DETY for each event in the final _common_clean file
| Quadrant A | 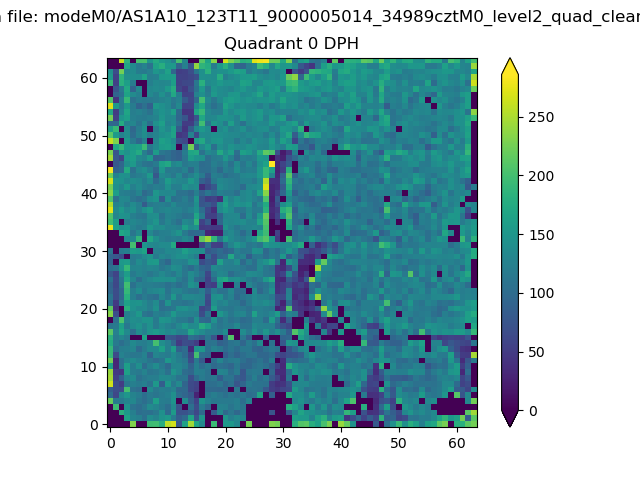 |
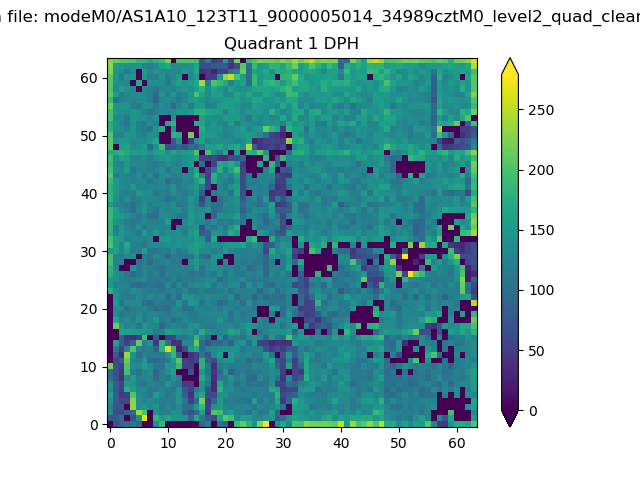 |
Quadrant B |
|---|---|---|---|
| Quadrant D | 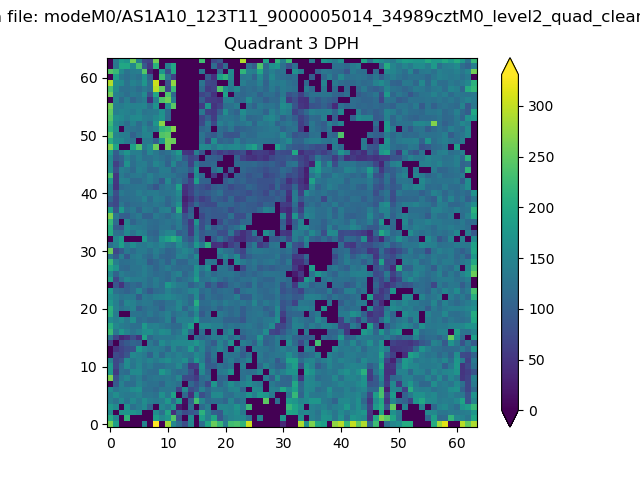 |
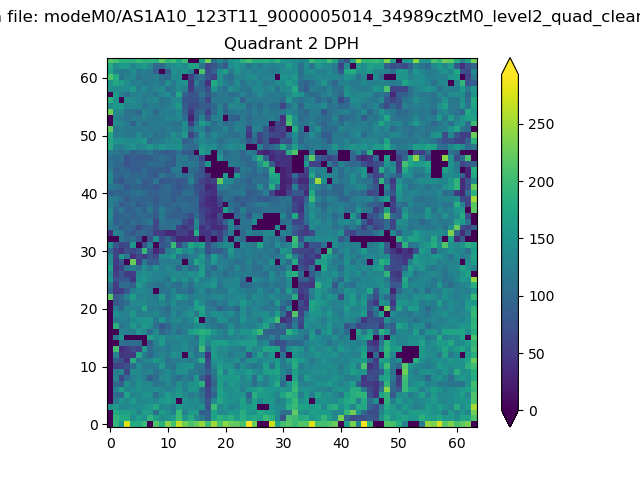 |
Quadrant C |
| Plot type | Count rate plots | Images |
|---|---|---|
| Comparison with Poisson distribution Blue bars denote a histogram of data divided into 1 sec bins. Red curve is a Poisson curve with rate = median count rate of data. |
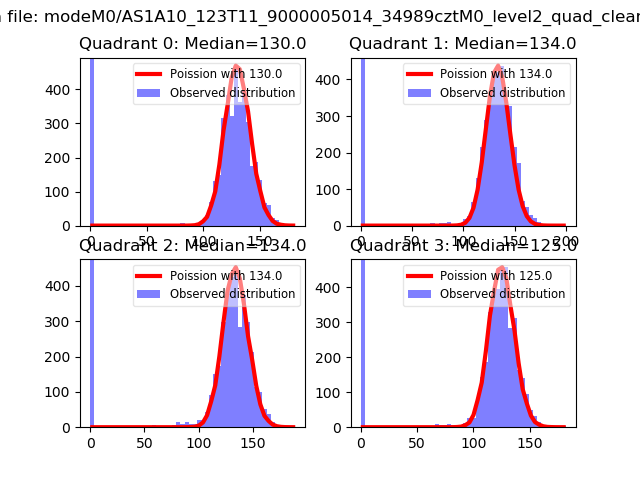 |
 |
| Quadrant-wise count rates Data is divided into 100 sec bins |
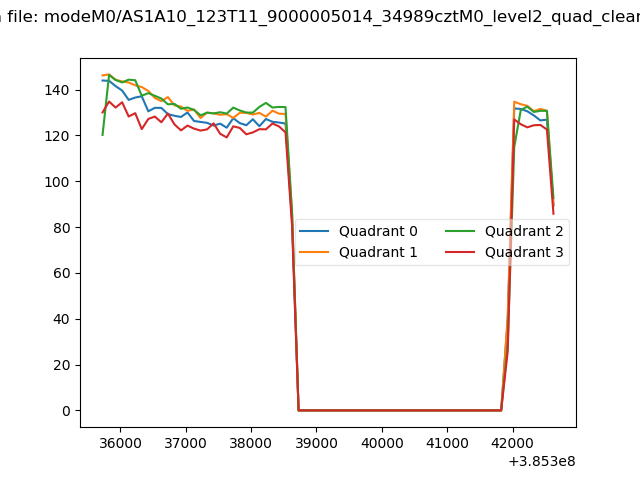 |
|
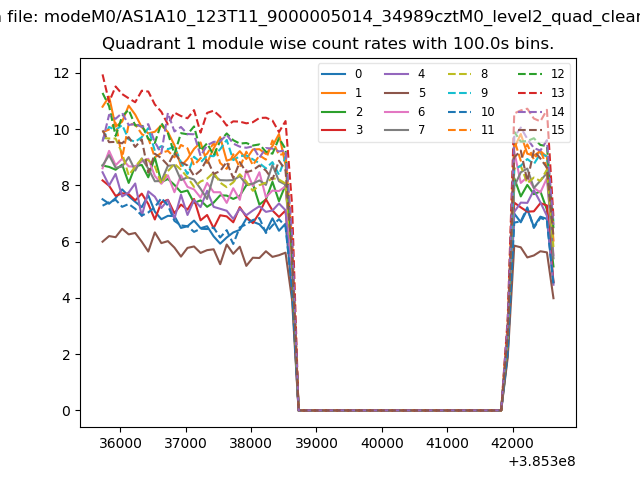
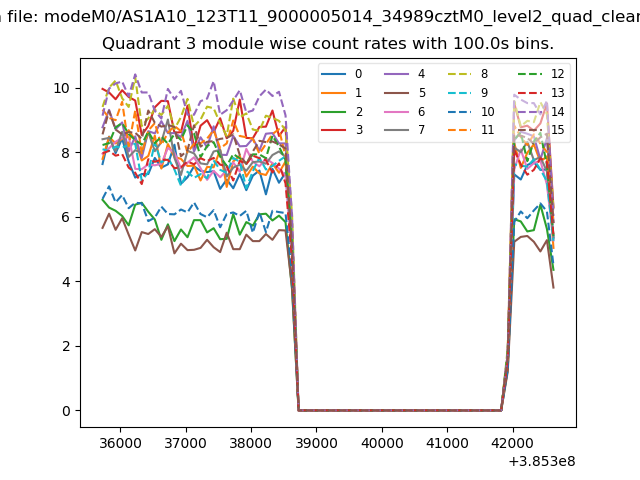
| Module-wise count rates for Quadrant A Data is divided into 100 sec bins |
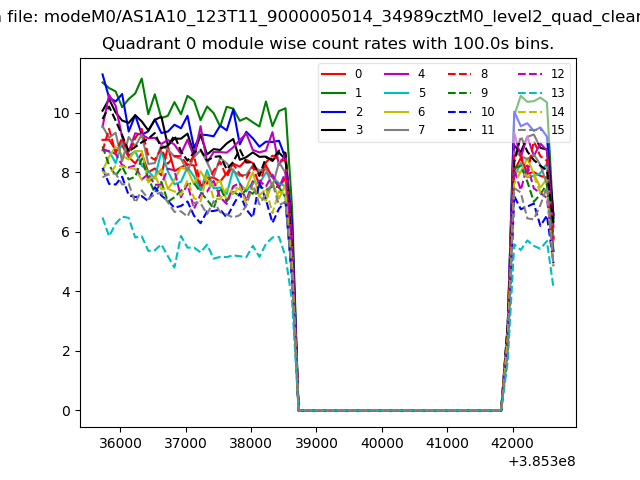 |
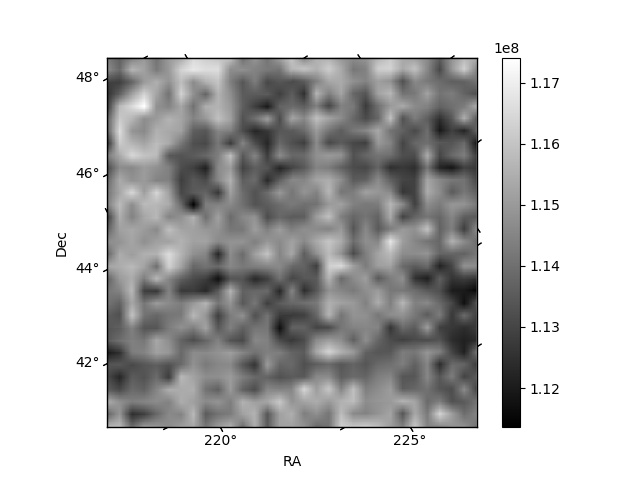 |
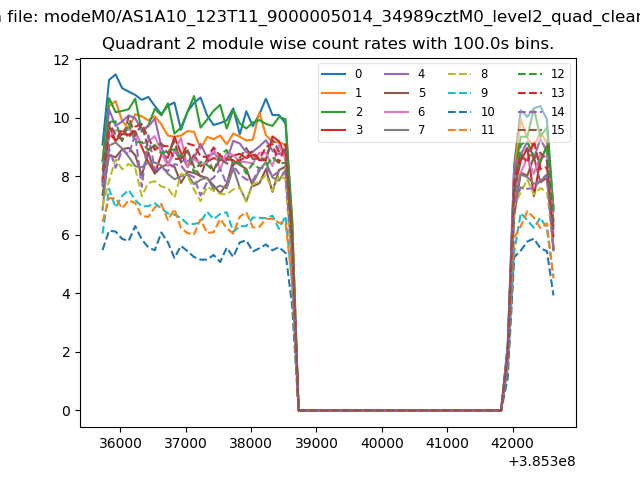
| Module-wise count rates for Quadrant B Data is divided into 100 sec bins |
 |
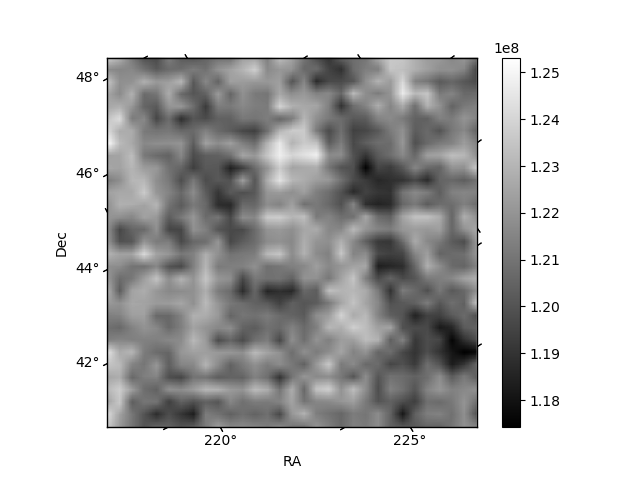 |
| Module-wise count rates for Quadrant C Data is divided into 100 sec bins |
 |
 |
| Module-wise count rates for Quadrant D Data is divided into 100 sec bins |
 |
 |
| Parameter | Plot |
|---|---|
| CZT HV Monitor |  |
| D_VDD | 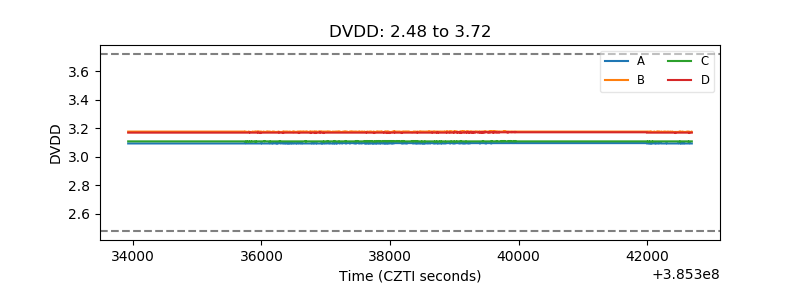 |
| Temperature 1 | 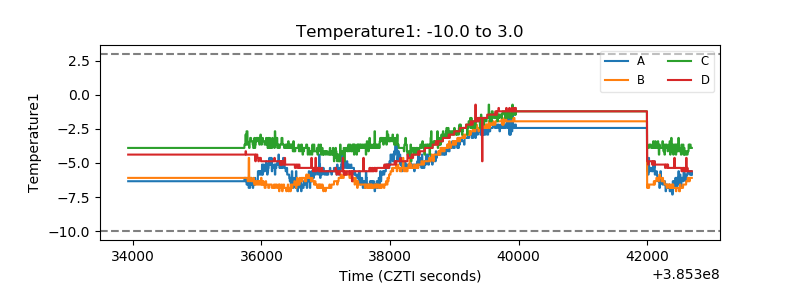 |
| Veto HV Monitor | 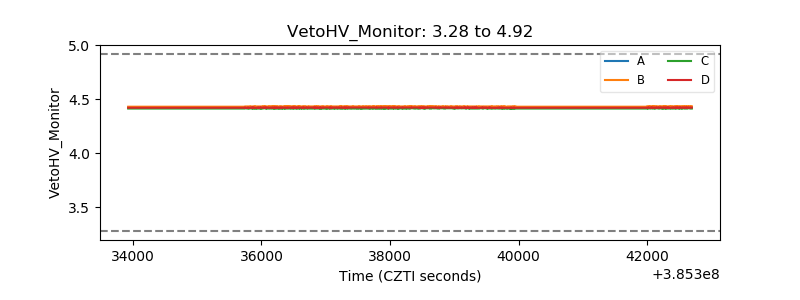 |
| Veto LLD | 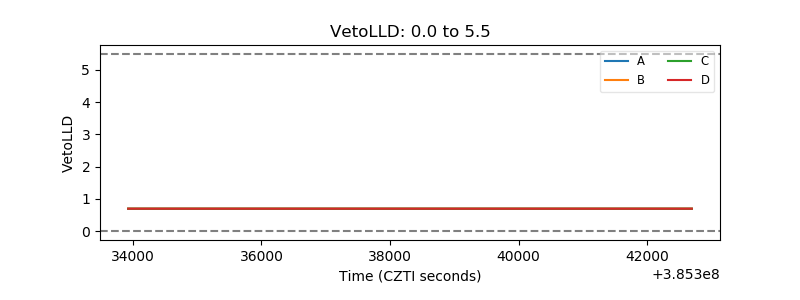 |
| Alpha Counter | 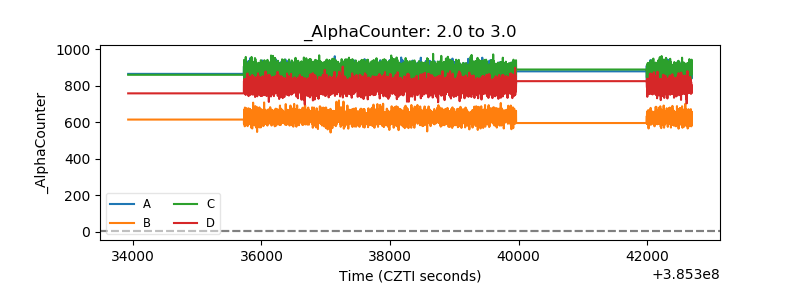 |
| _CPM_Rate | 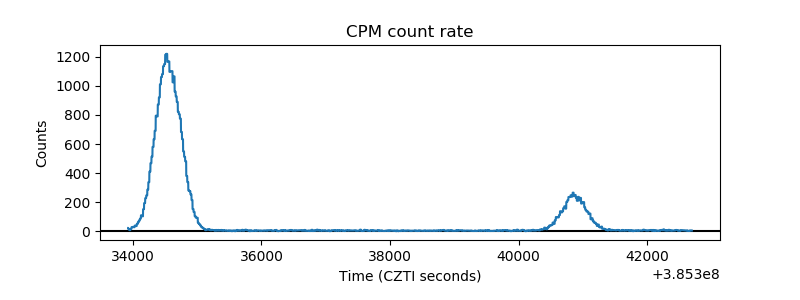 |
| CZT Counter | 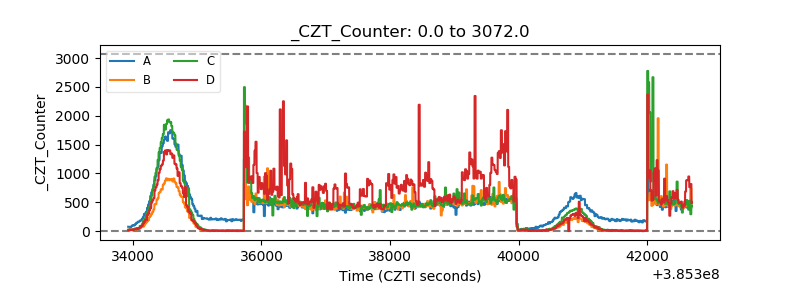 |
| +2.5 Volts monitor | 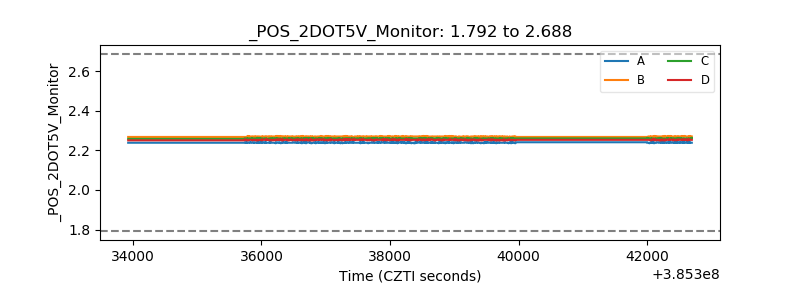 |
| +5 Volts monitor | 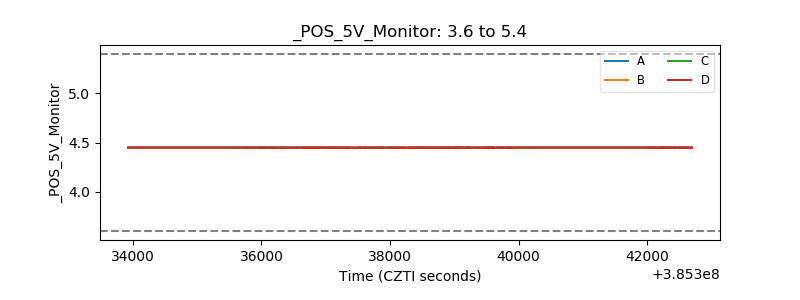 |
| _ROLL_ROT | 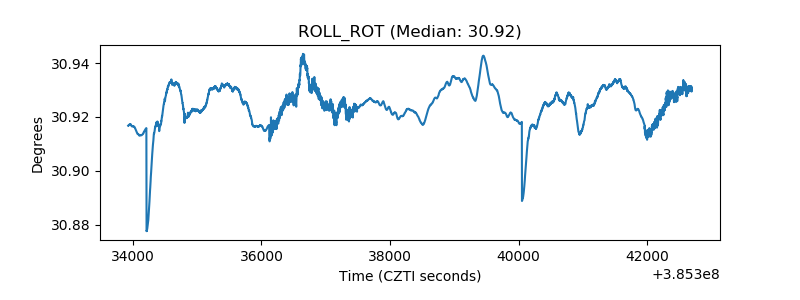 |
| _Roll_DEC |  |
| _Roll_RA | 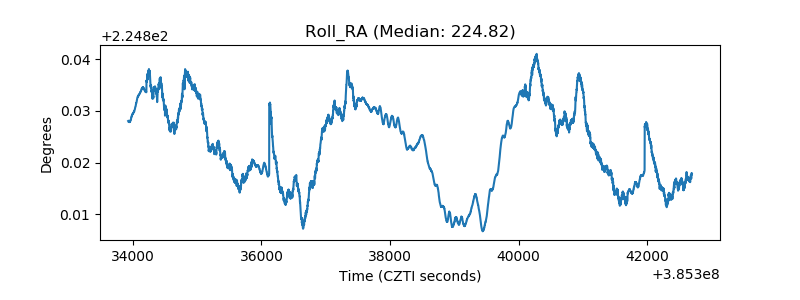 |
| Veto Counter | 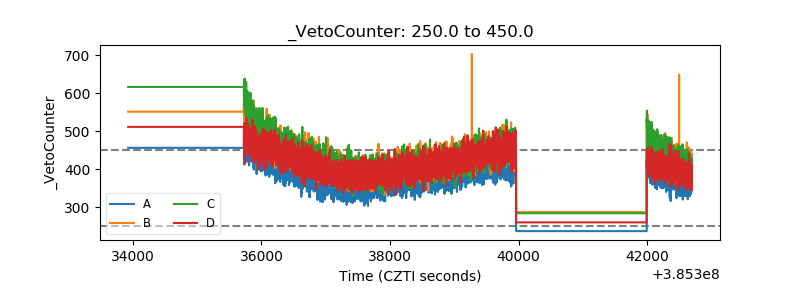 |